
Last updated: 2026
NOTE: This article was published in 2026, but the house was purchased seven years earlier in 2019. At the bottom of the article, the Annual Updates show how the property has performed over that time.
Here’s Property #15 in my Memphis rental portfolio! In case you missed it: this was one of the 14 I houses I purchased very quickly from May to September of 2019 — my opening acquisition sprint after I left my “first career” in retail, sold my NYC condo to become a renter, and used the proceeds to start building a portfolio that would generate real cash.
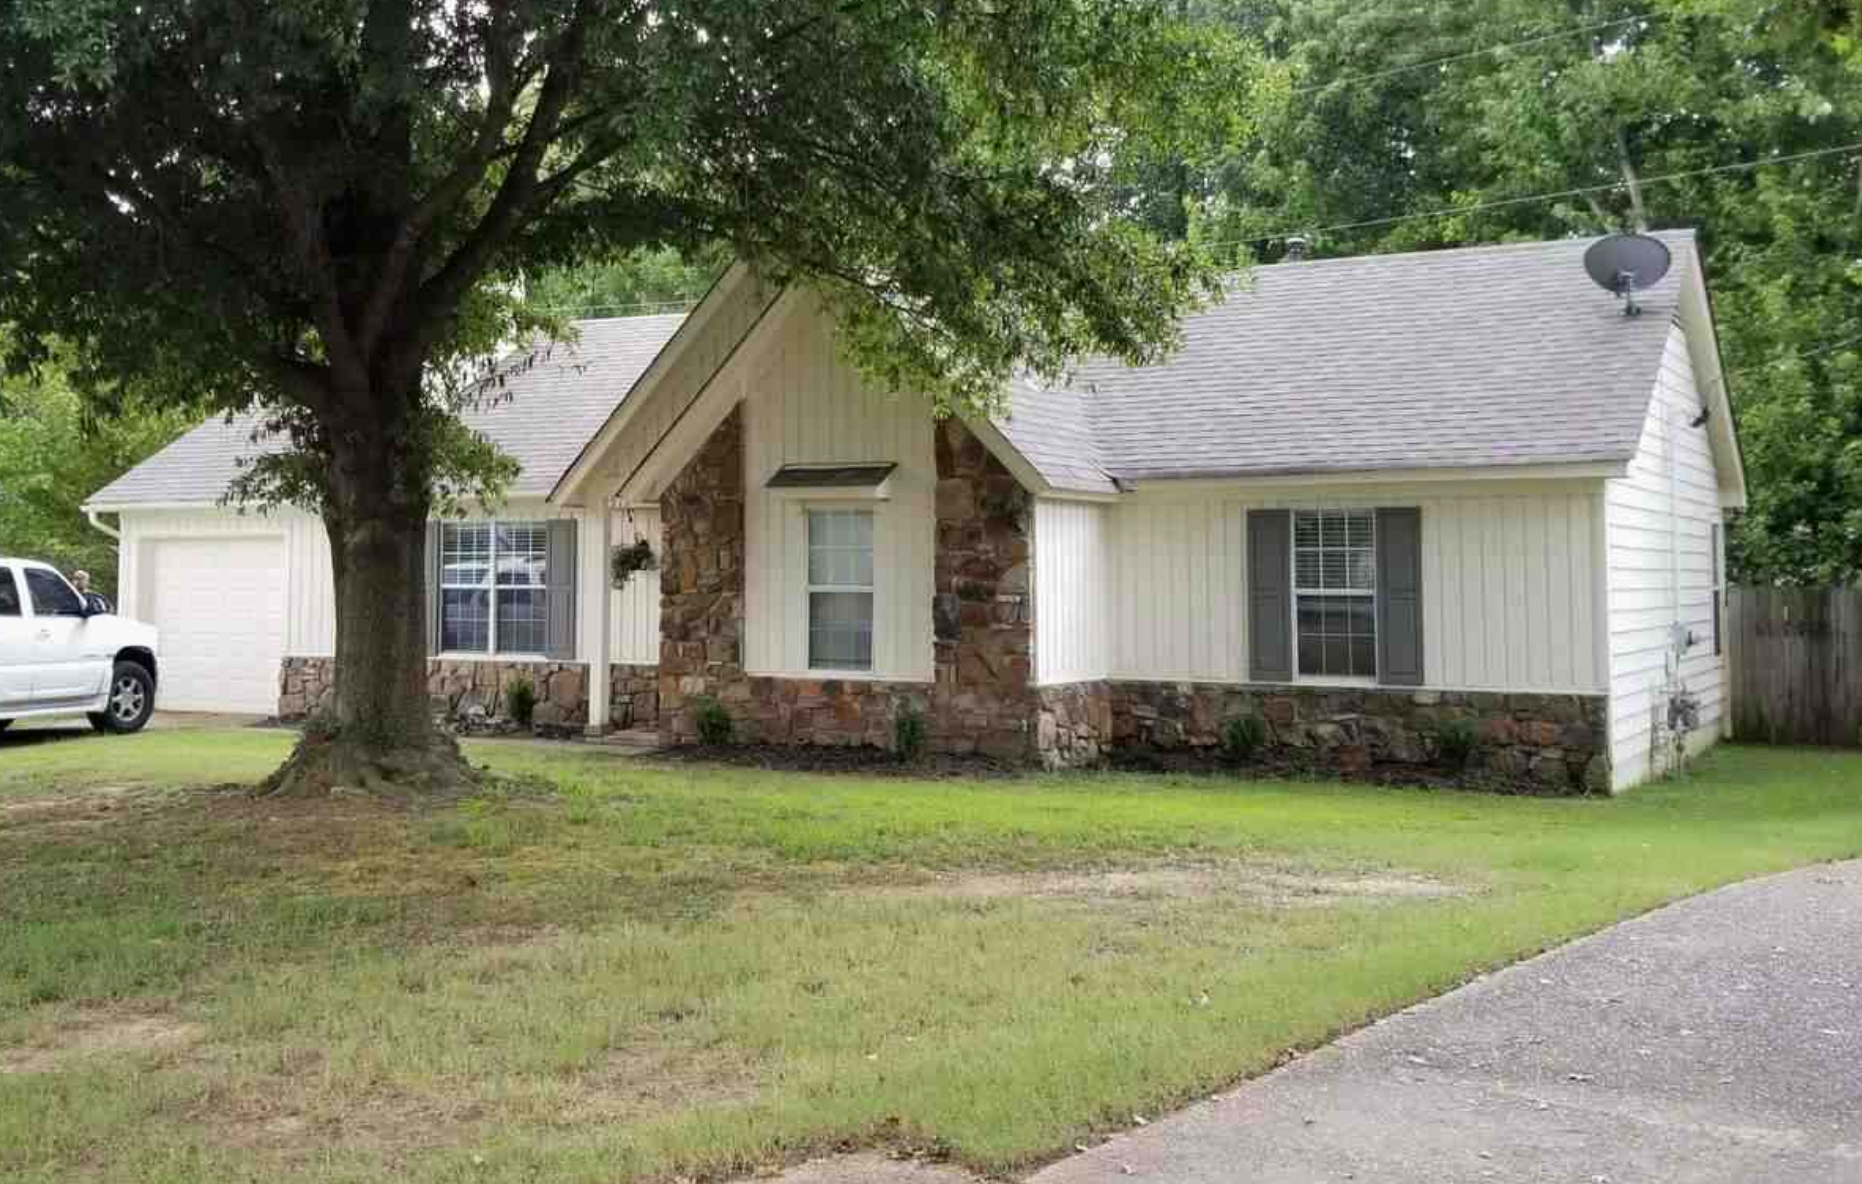
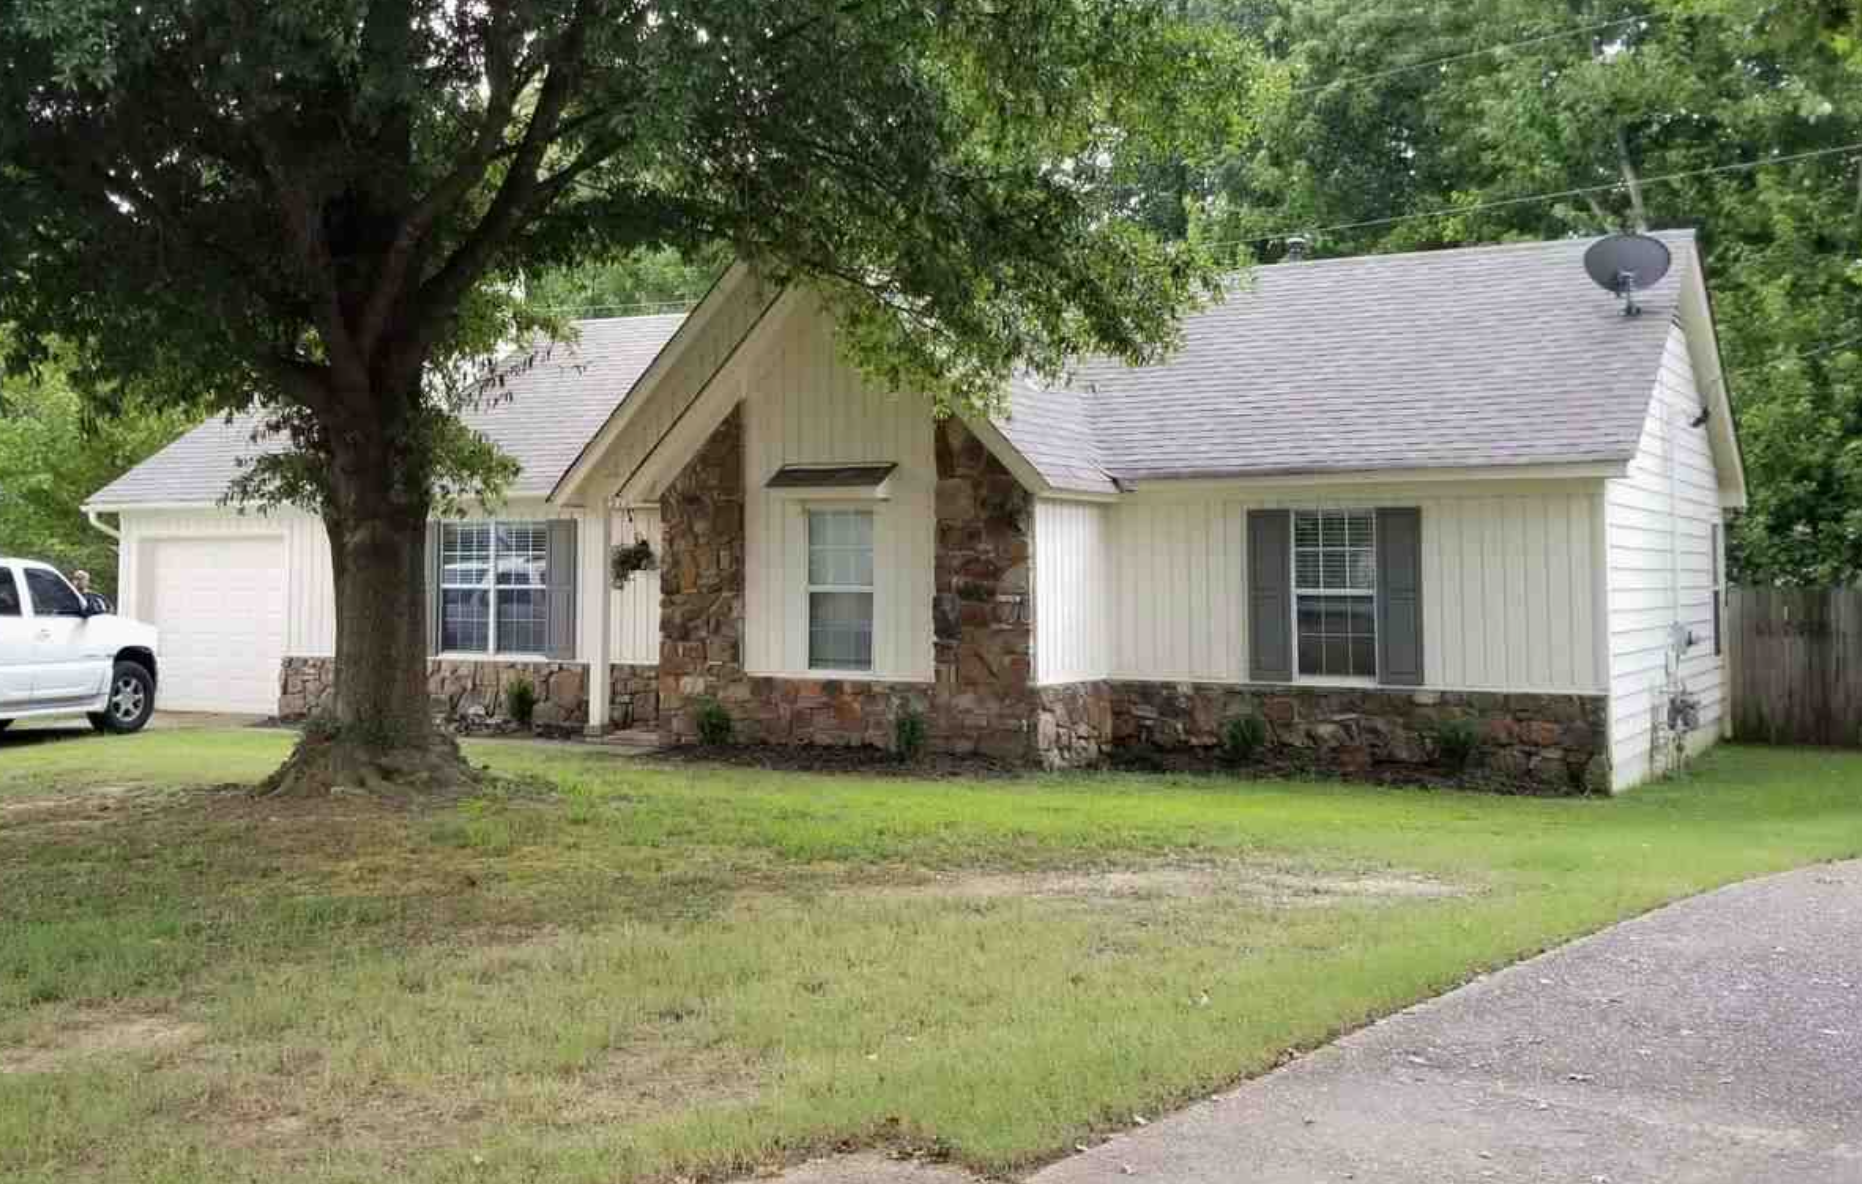
This is one of my newer homes, built in 1991, and it’s in a great B+ neighborhood. It has been, without a doubt, the most BORING home in my portfolio — which is what we like!
Alright, let’s take a closer look at this house and deal.
Property #15: The Deal
This was a turnkey property I bought from my go-to provider in Memphis. He had recently done a full rehab on the property, including:
roof
HVAC, furnace, and water heater
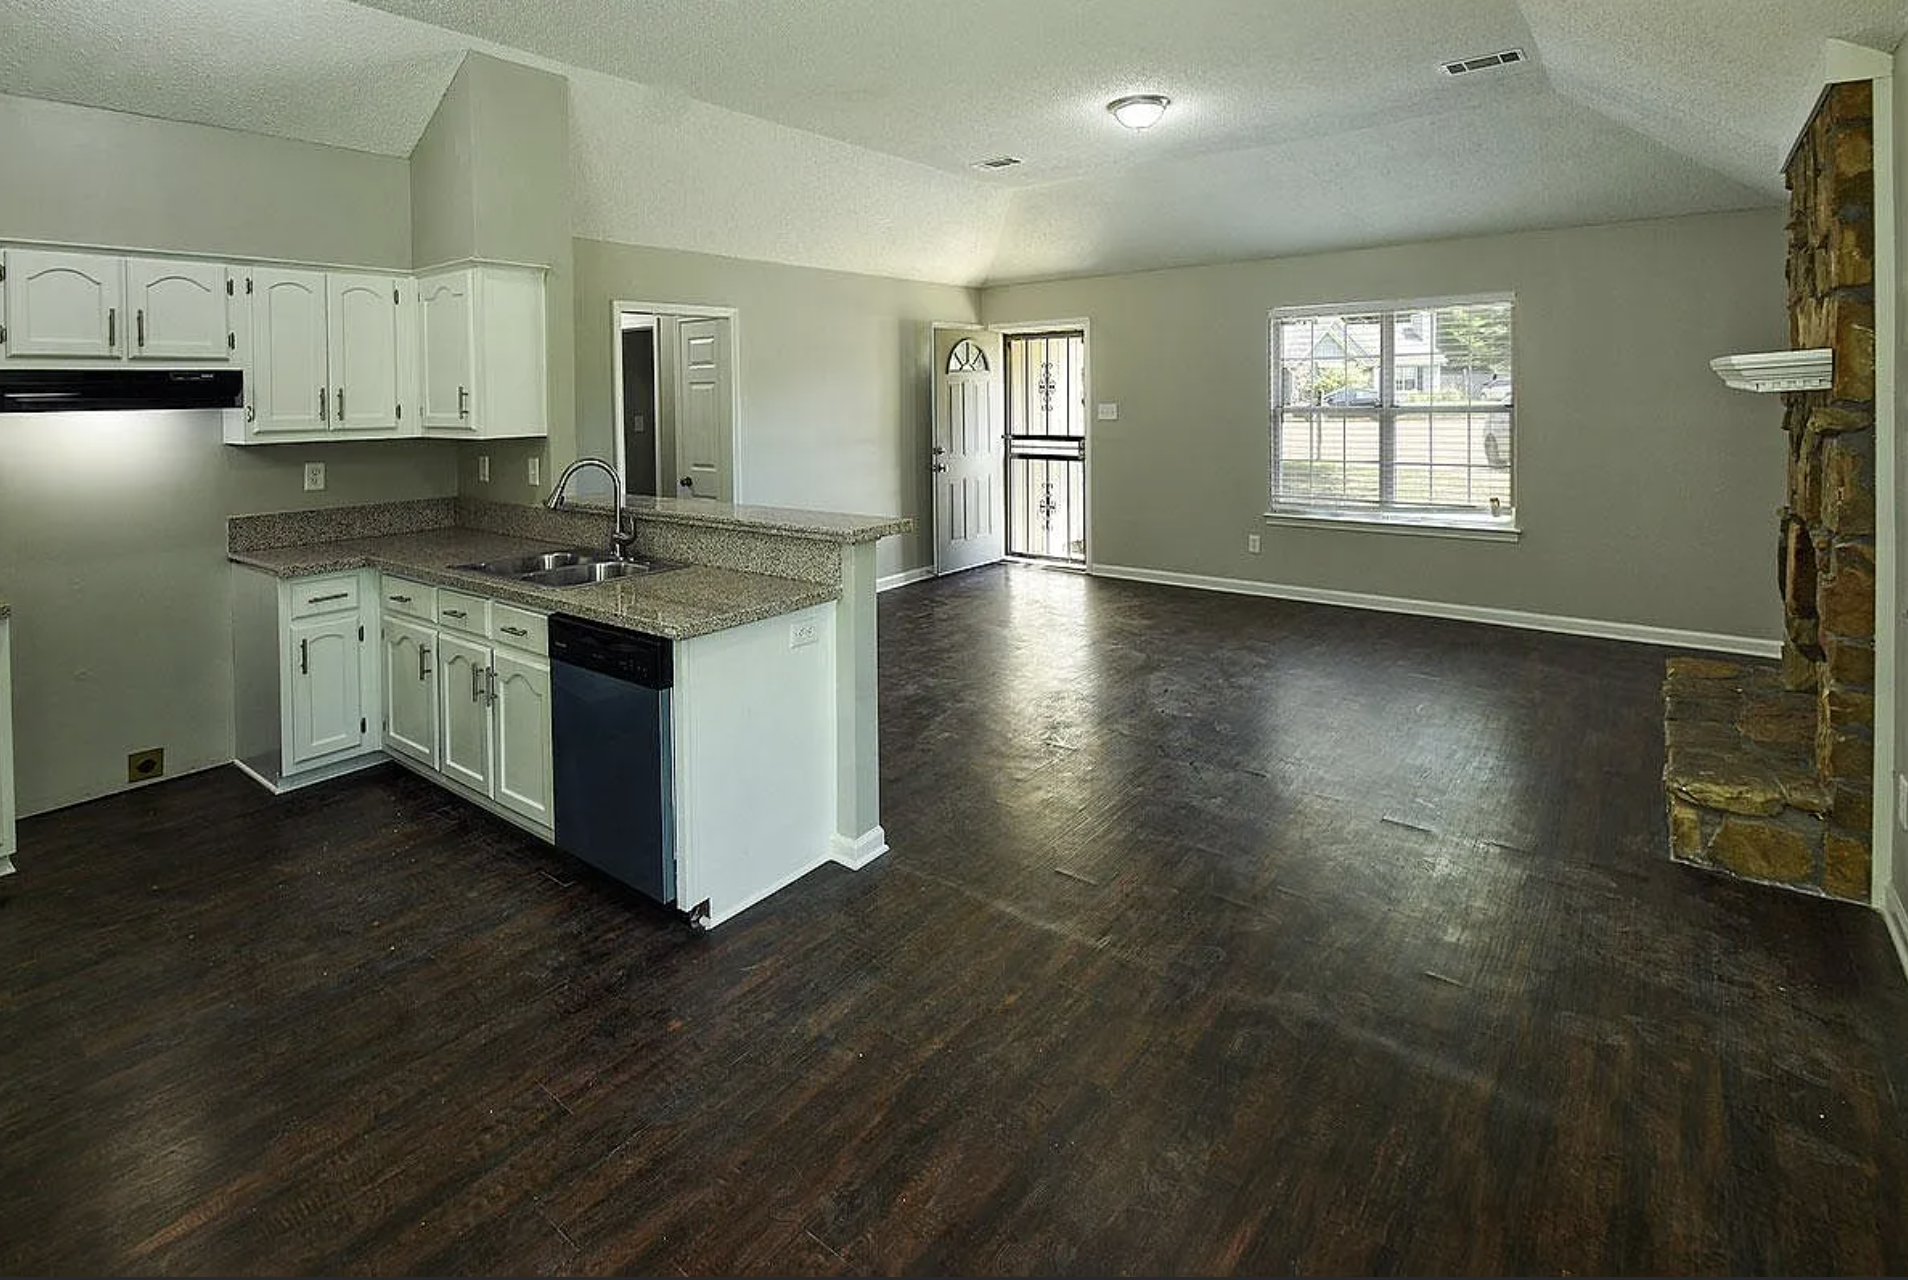
flooring
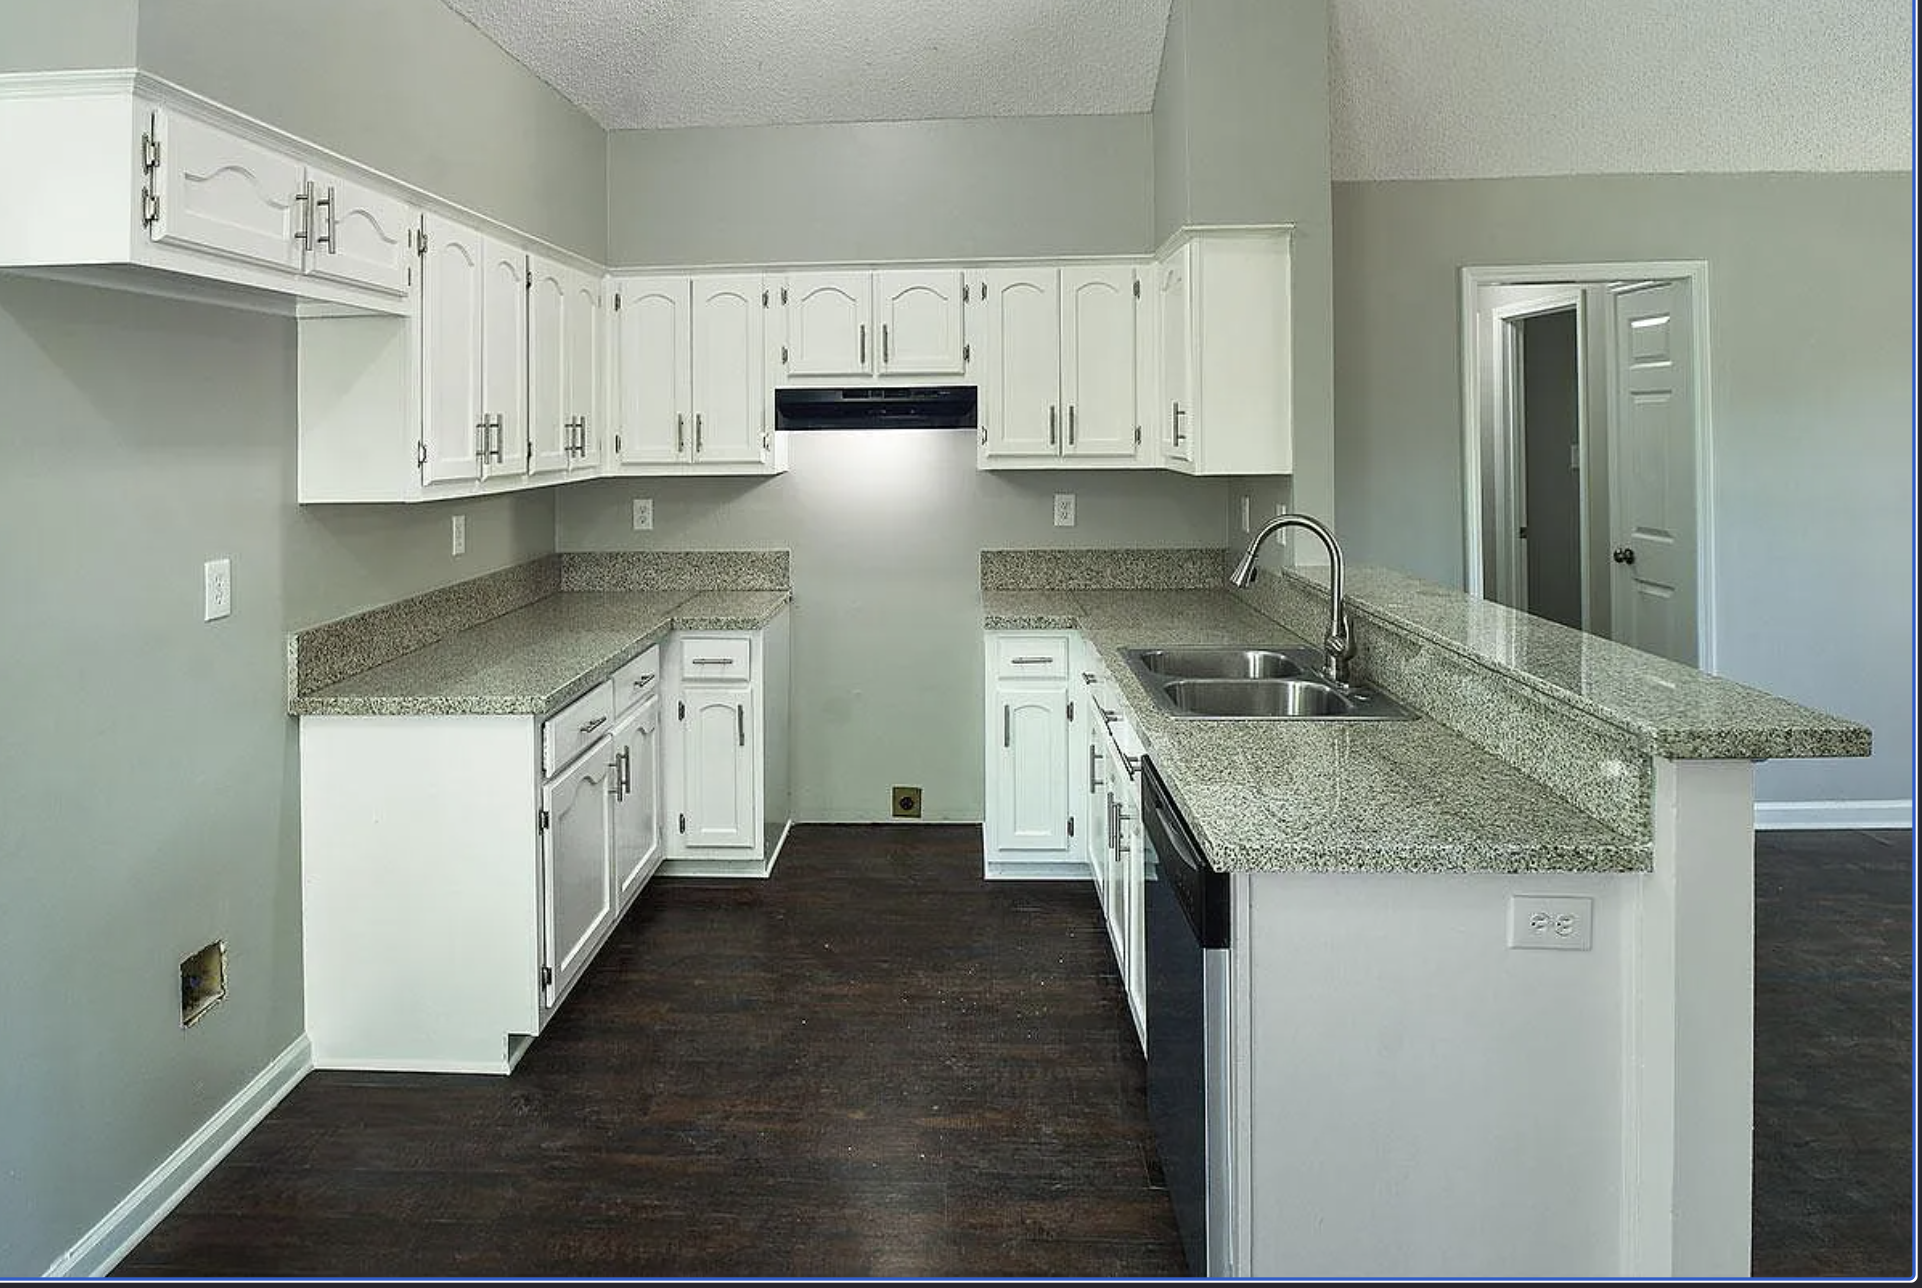
granite countertops
exterior and interior paint
and much more
A tenant had been placed a few months prior at $1,165/mo., and the house was offered at $130,000. Most of the time with turnkey properties, you can’t negotiate much on price, and that was the case here — I bought it for the offer price of $130,000. This is not the best price-to-rent ratio, falling well short of the 1% rule, but I liked the house and the are enough to be satisfied with somewhat lower cash returns.
Here are some additional facts about this particular house:
3-beds, 2-bath
In the 38133 zip code, great B+ neighborhood
Built in 1991
1,016 square feet of interior space
Central air
1-car attached garage
Property #15: Due Diligence
Due diligence was pretty straightforward on this deal: the turnkey provider did a final inspection, which surfaced a few small issues that he promptly corrected. The appraisal come in right at the purchase price. And…that was it! Sometimes, turnkey is super easy.
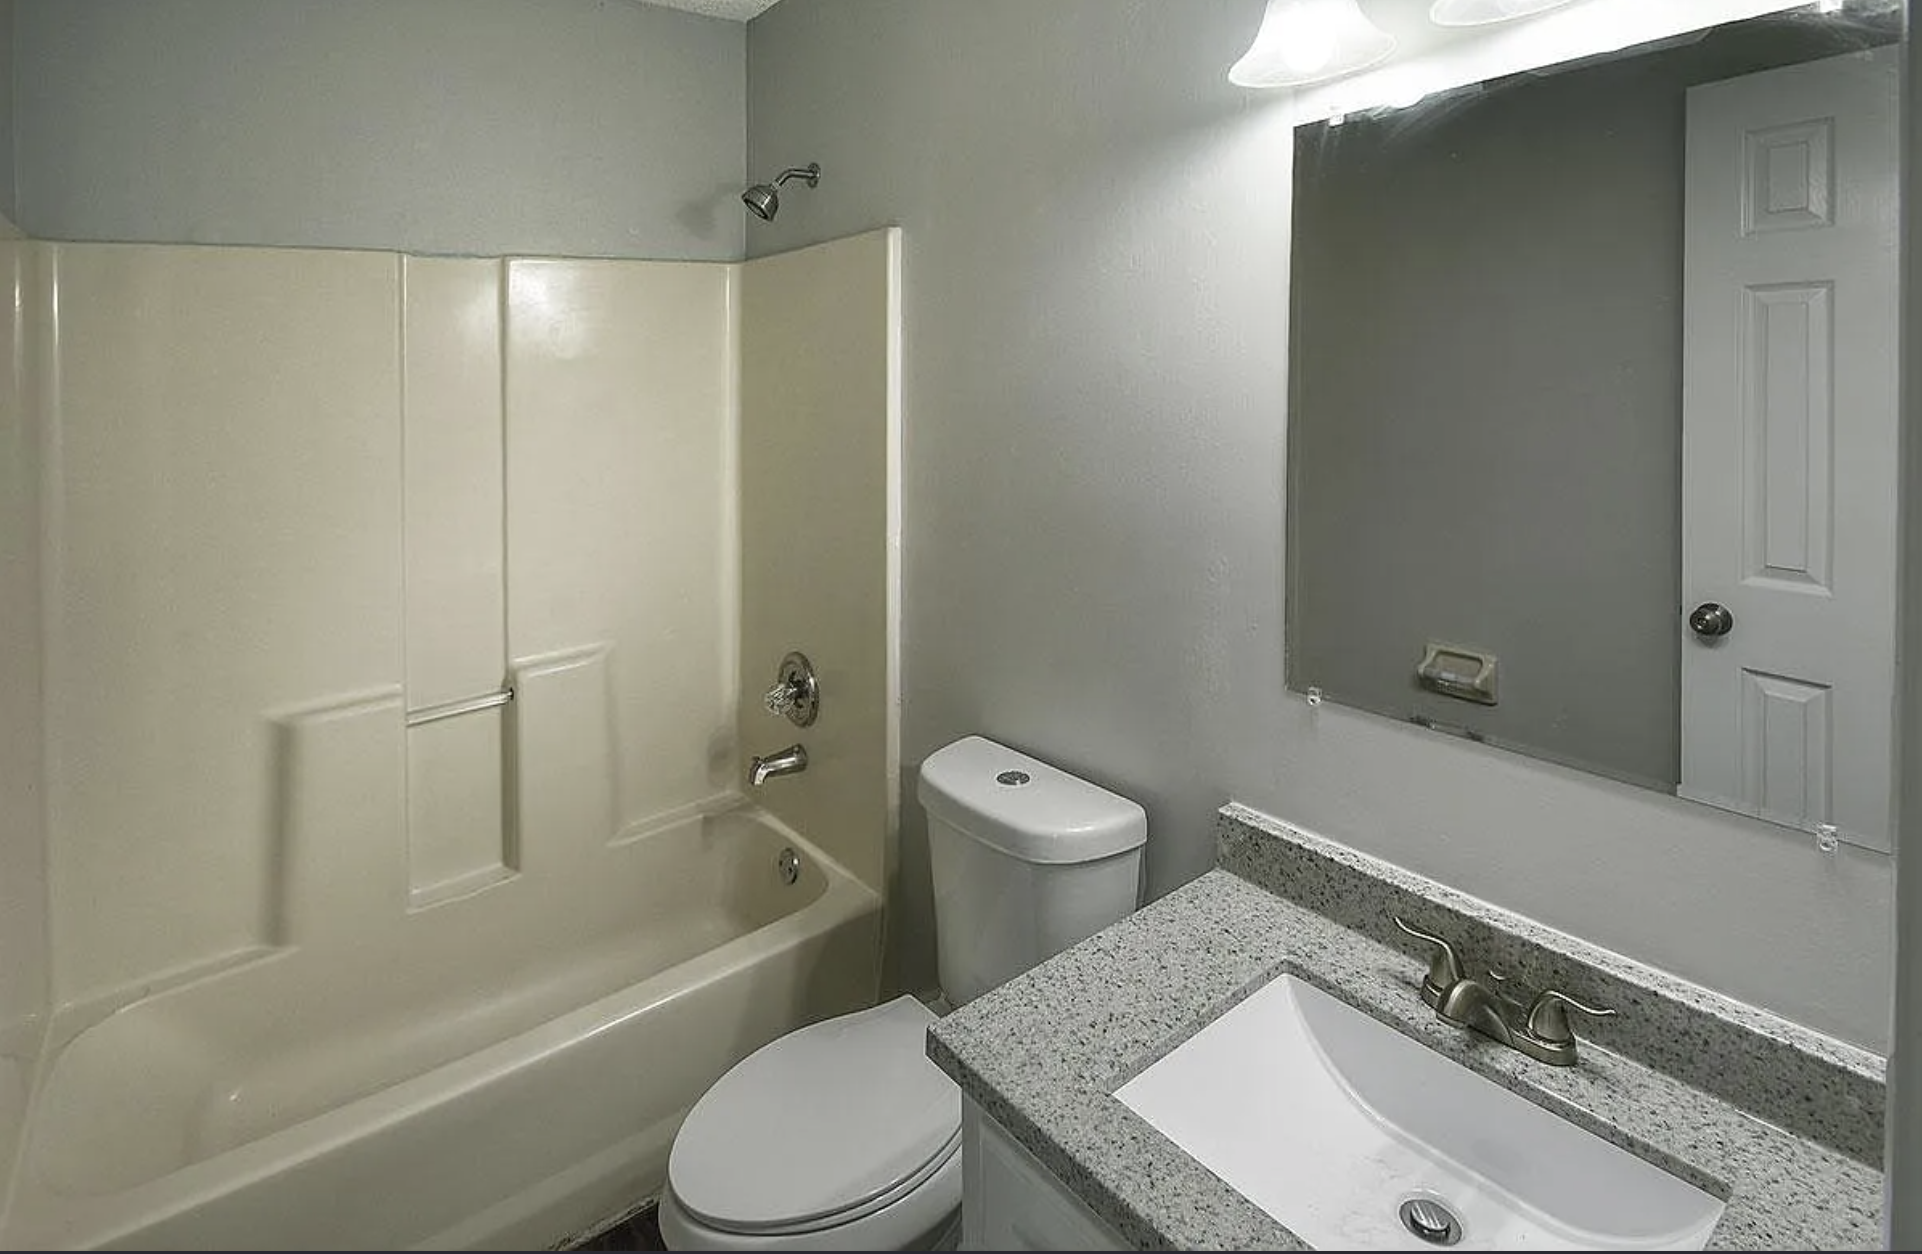
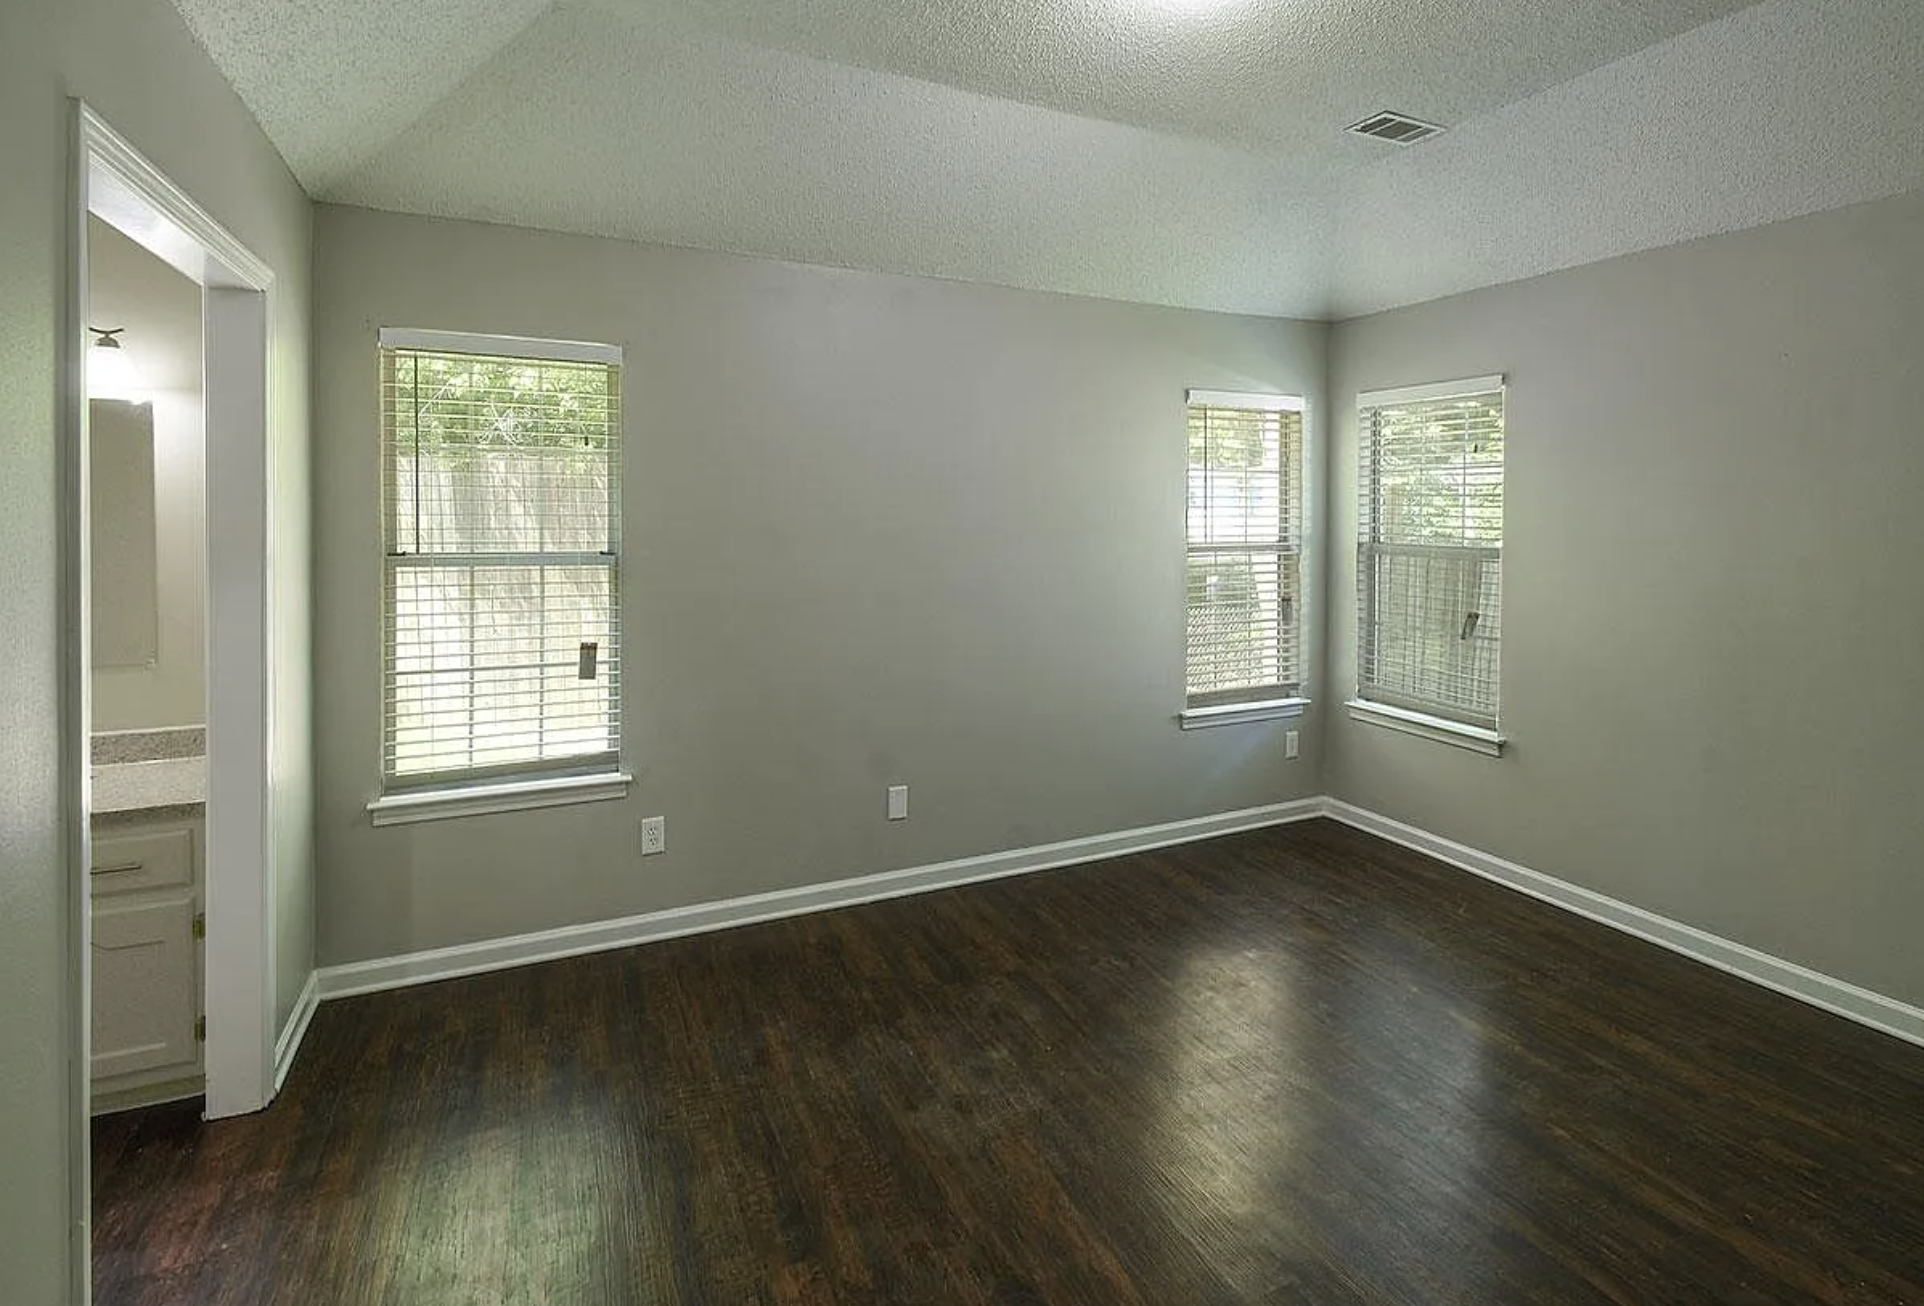
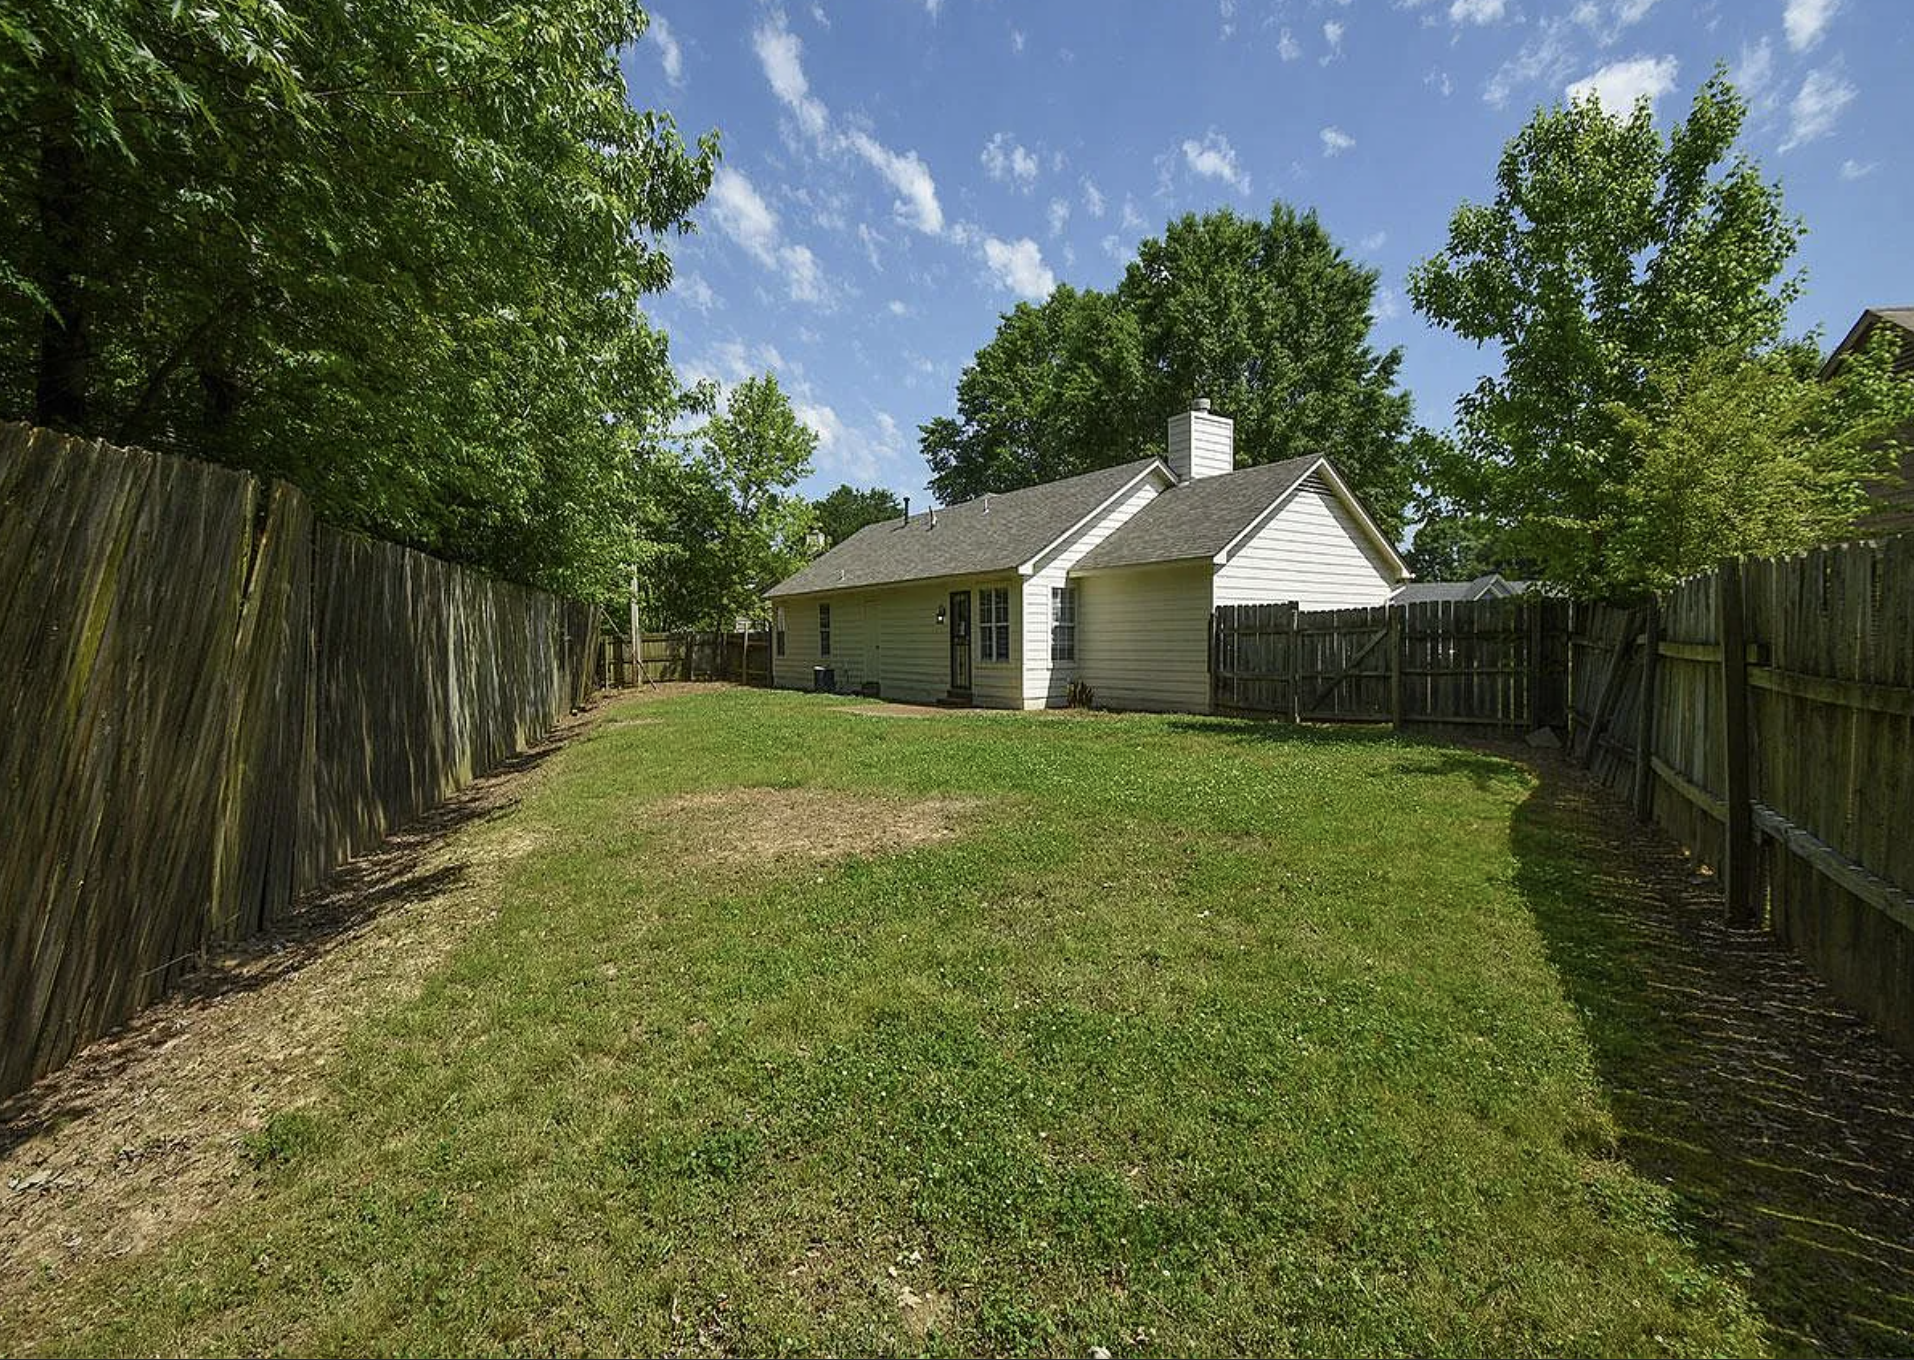
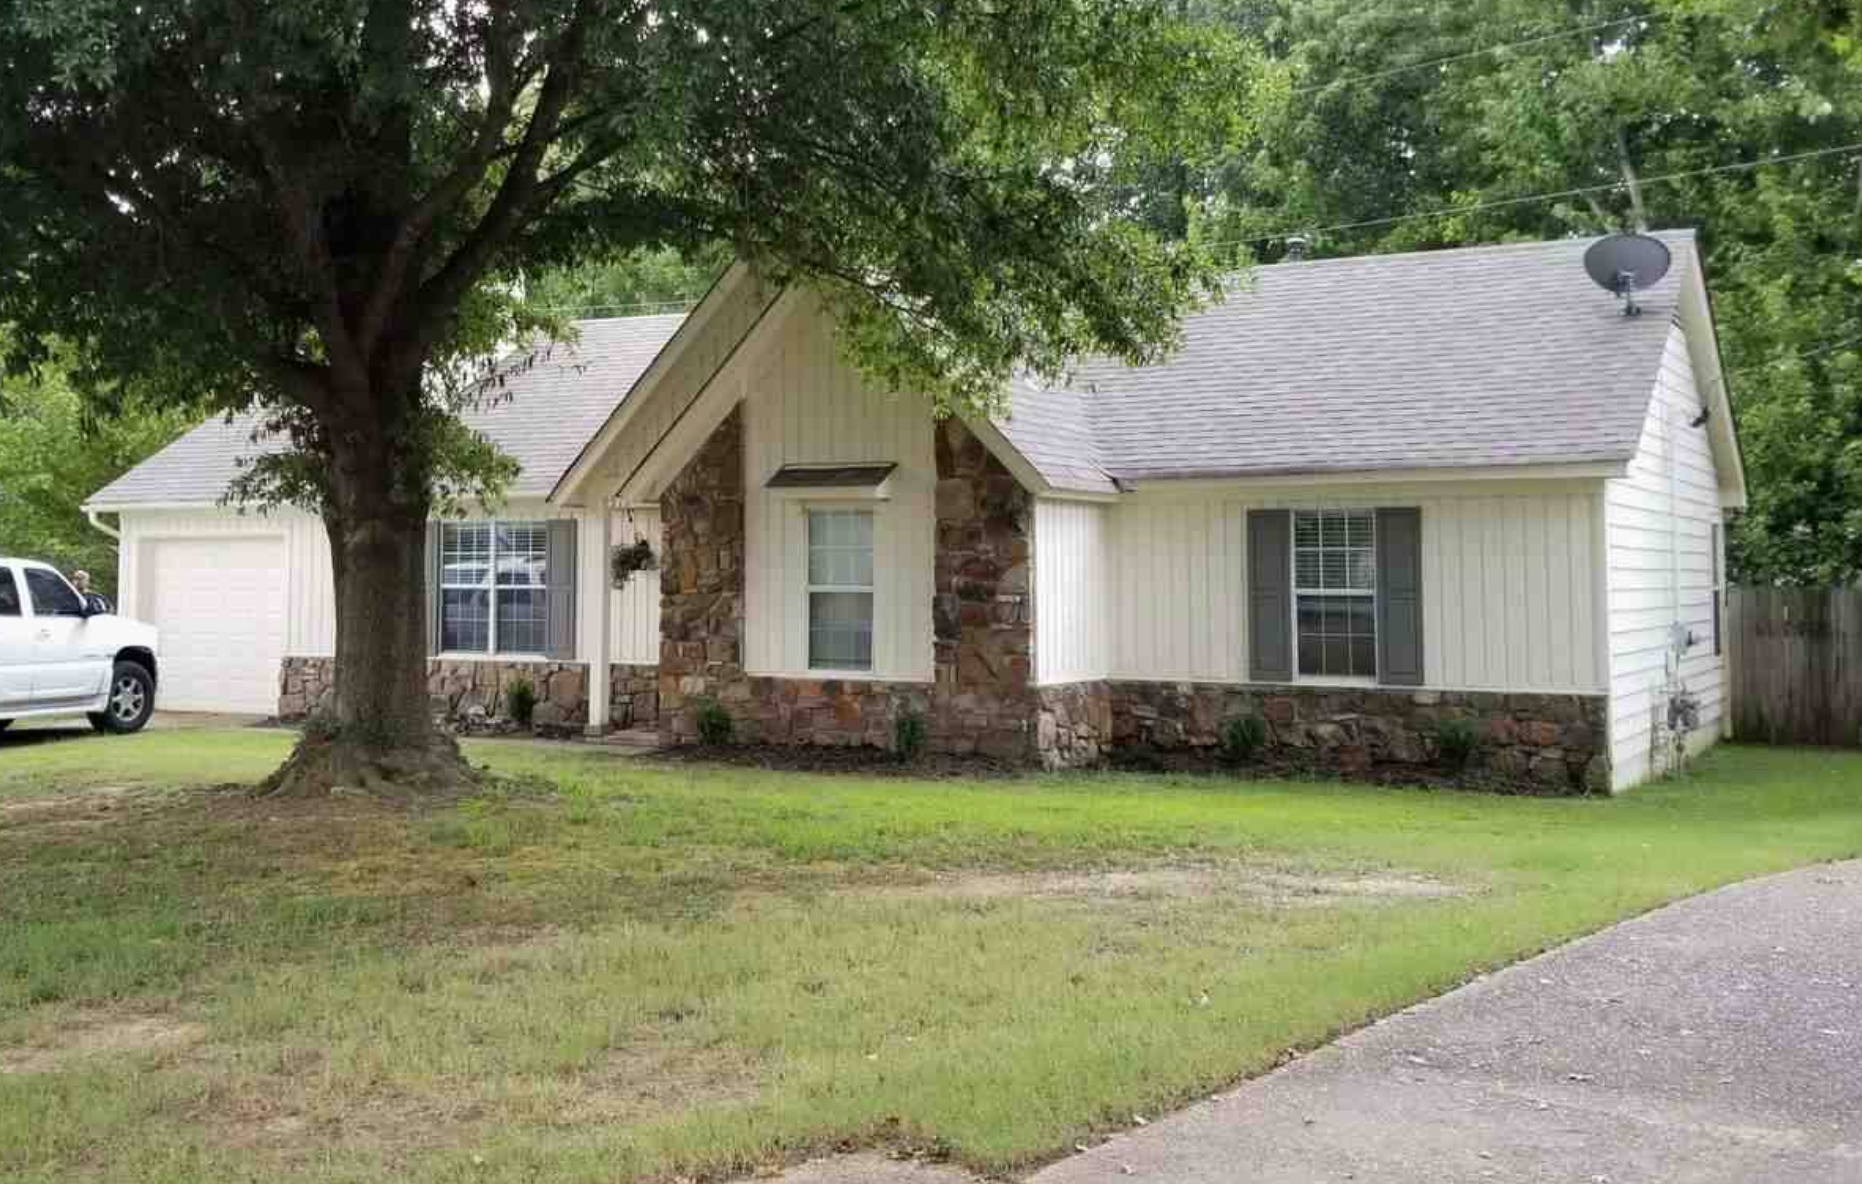
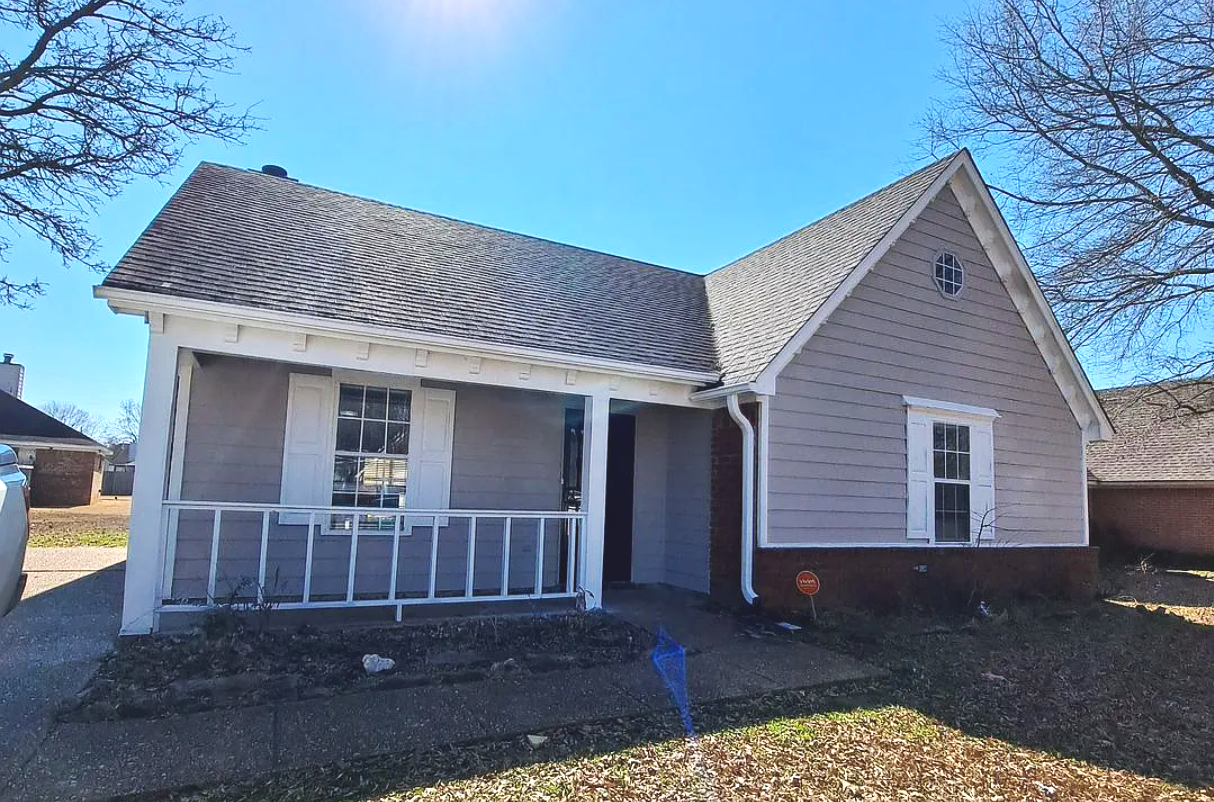
Here are some photos to give you a sense of what the property looked like:
Property #15: The Financials
At this stage of my investing journey, I had used up all my “golden tickets” so I no longer had access to conventional mortgages. I moved on to the next-best option, which were nonconforming rental loans — now usually called DSCR loans. It was still a 30-year fixed rate loan, but rates and terms were not quite as attractive, so my interest rate on this loan was 6.10%, and closing costs were quite a big higher than my previous conventional loans. I put down a 25% down payment.
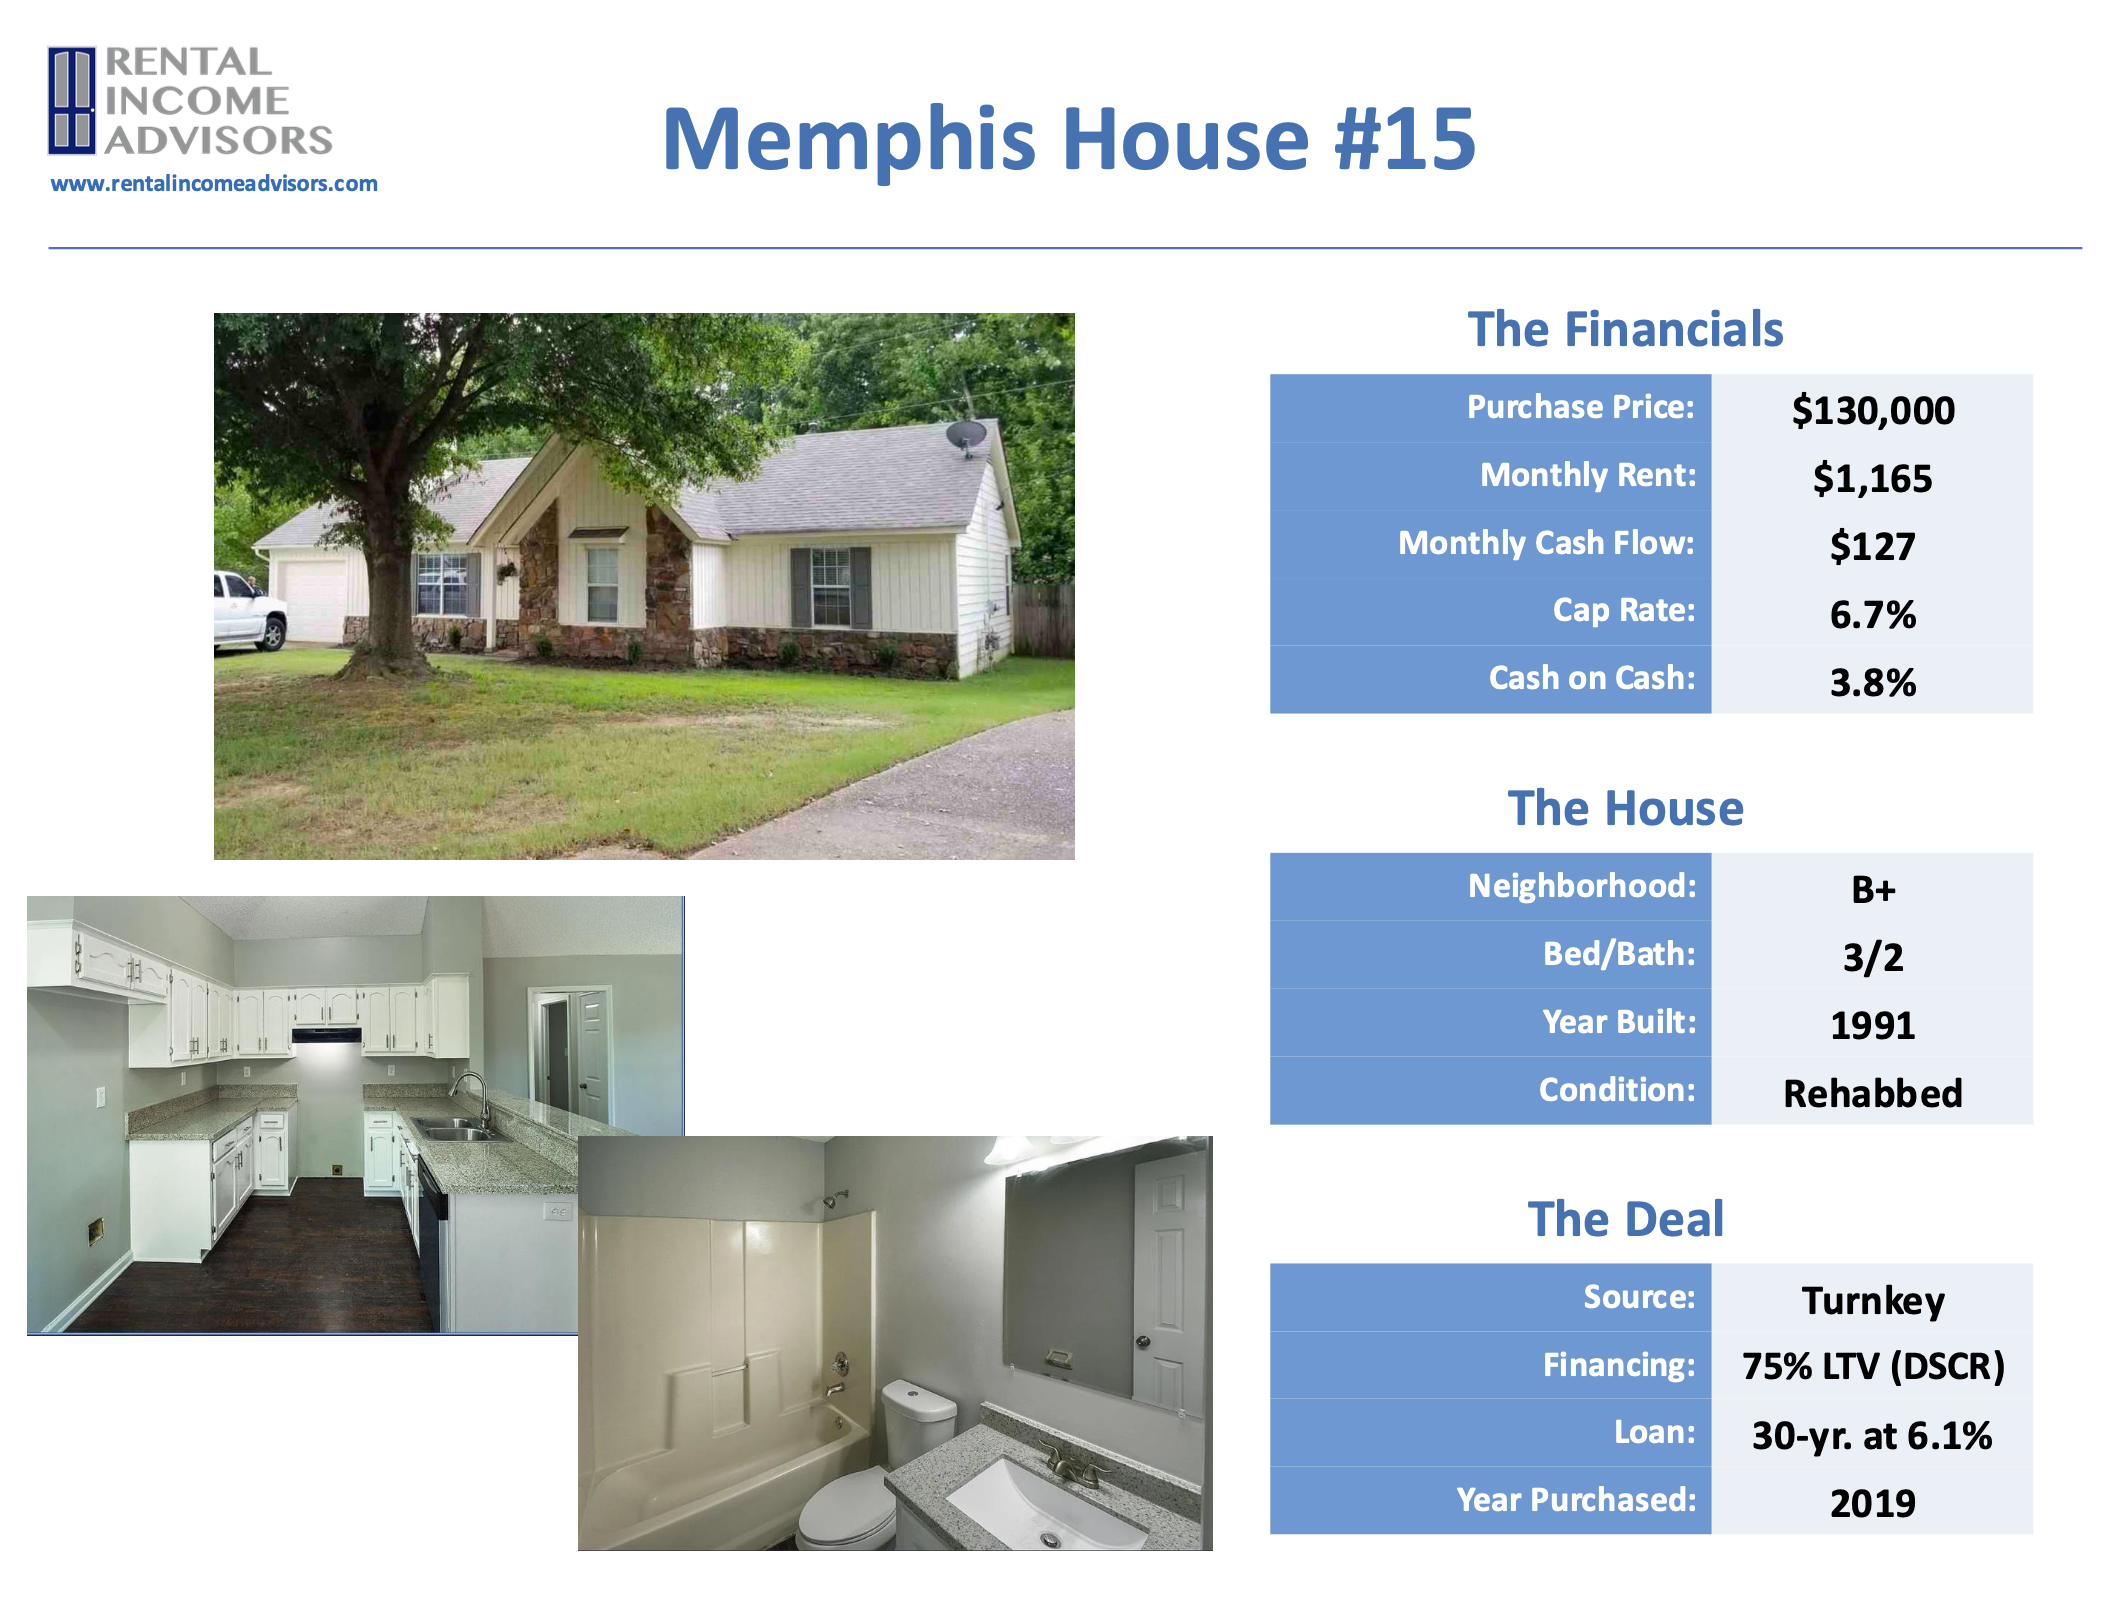
As I mentioned earlier, the inherited tenant was paying $1,165. Using the RIA Property Analyzer, I’ve modeled the original figures from this deal, so you can see what it would have looked like at the time:
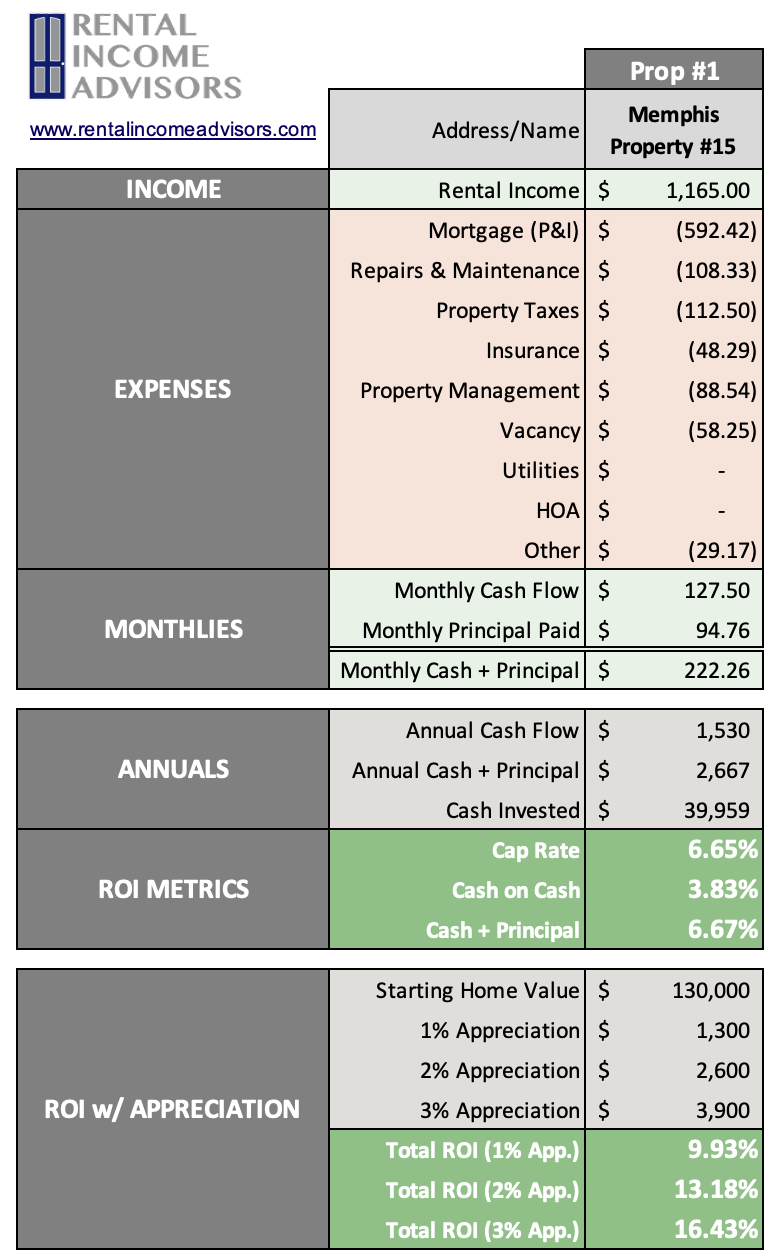
Purchase Price: $130,000
Monthly Rent: $1,165
Monthly Cash Flow: $127
Cap Rate: 6.7%
Cash on Cash Returns: 3.8%
Total ROI 2% Appreciation: 13.1%
(Want to use this calculator? It’s free!)
OR
Using the multi-year model in the RIA Property Analyzer, we can visualize some of the main long-term trends assuming a long-term inflation rate of 2%:
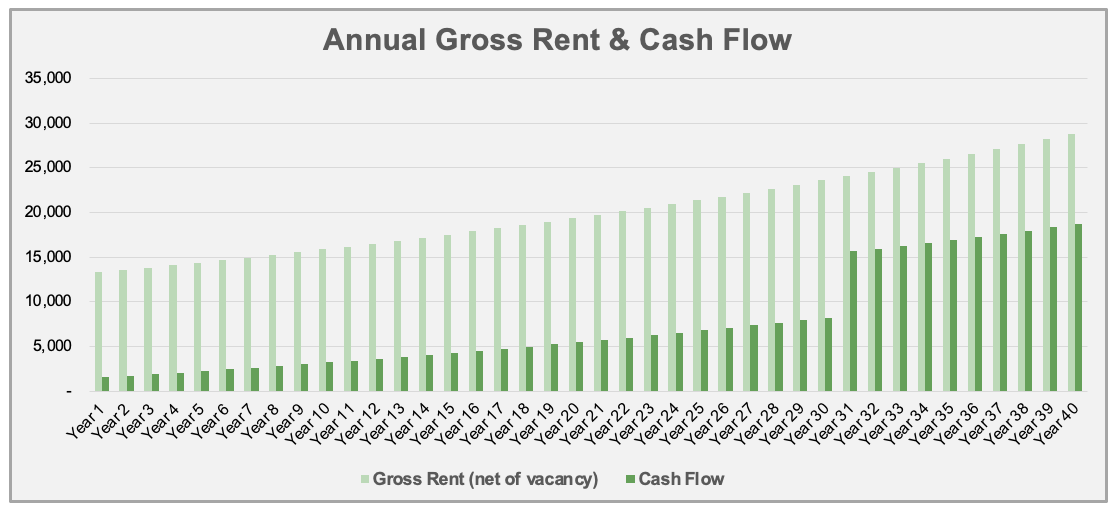
Cash flow increases over time. This is mostly because rent and expenses are expected to rise with inflation, but one major expense (my mortgage) is fixed.
Cash Flow Year 1: $1,530
Cash Flow Year 10: $3,215
Cash Flow Year 25: $6,786
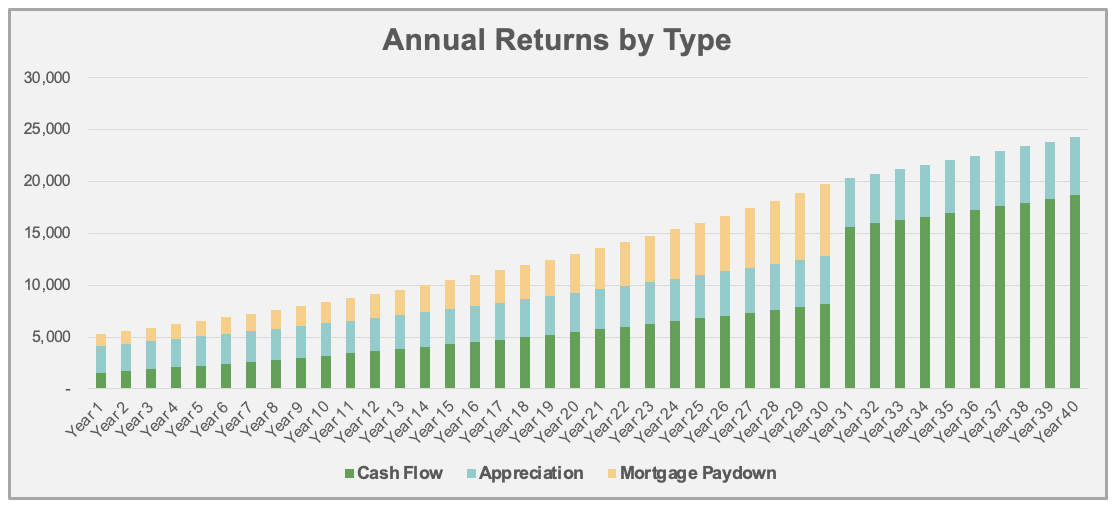
Mortgage paydown accelerates over time. This is because of the way banks amortize loans – each month, a little bit more of your fixed payment is principal, and a little bit less is interest.
Mortgage Paydown Year 1: $1,170
Mortgage Paydown Year 10: $2,027
Mortgage Paydown Year 25: $5,068
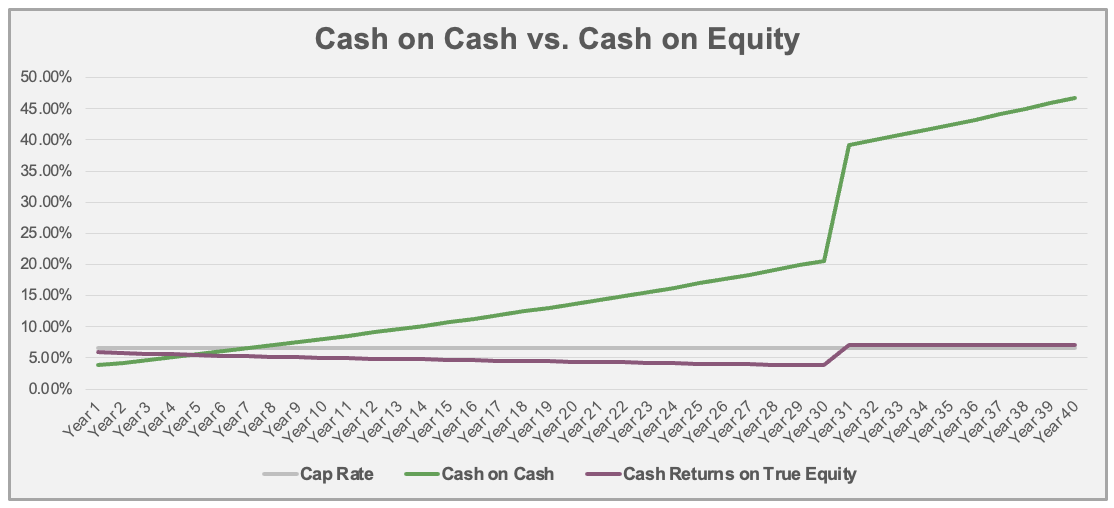
Total returns on cash increases over time. This is a consequence of the first two graphs – I will make greater total returns over time on the same initial investment of cash.
Total Returns on Cash Year 1: 13.3%
Total Returns on Cash Year 10: 20.9%
Total Returns on Cash Year 25: 40.1%
This house was a solid deal on a quality, newer property. The returns don’t look spectacular in the pro forma, but the advantages of the fully renovated turnkey property became apparent over time — the house has had remarkably few maintenance/capex costs in the seven years I’ve owned it, which means it has far surpassed the returns that I originally modeled. Some of that is luck, of course, but it’s an outcome that is much more likely with a turnkey house than with a typical property purchased off MLS.
Property #15: The Deal Sheet
Finally, to sum up Property #15 and its financials, here’s the full “deal sheet”:
Looking for YOUR Next Property?
If you need help finding, analyzing, and purchasing YOUR next property — or your first one! — schedule a free initial consultation with me. I’ve helped over 120 private coaching clients invest with confidence and build cash-flowing rental portfolios of their own.
Annual Updates
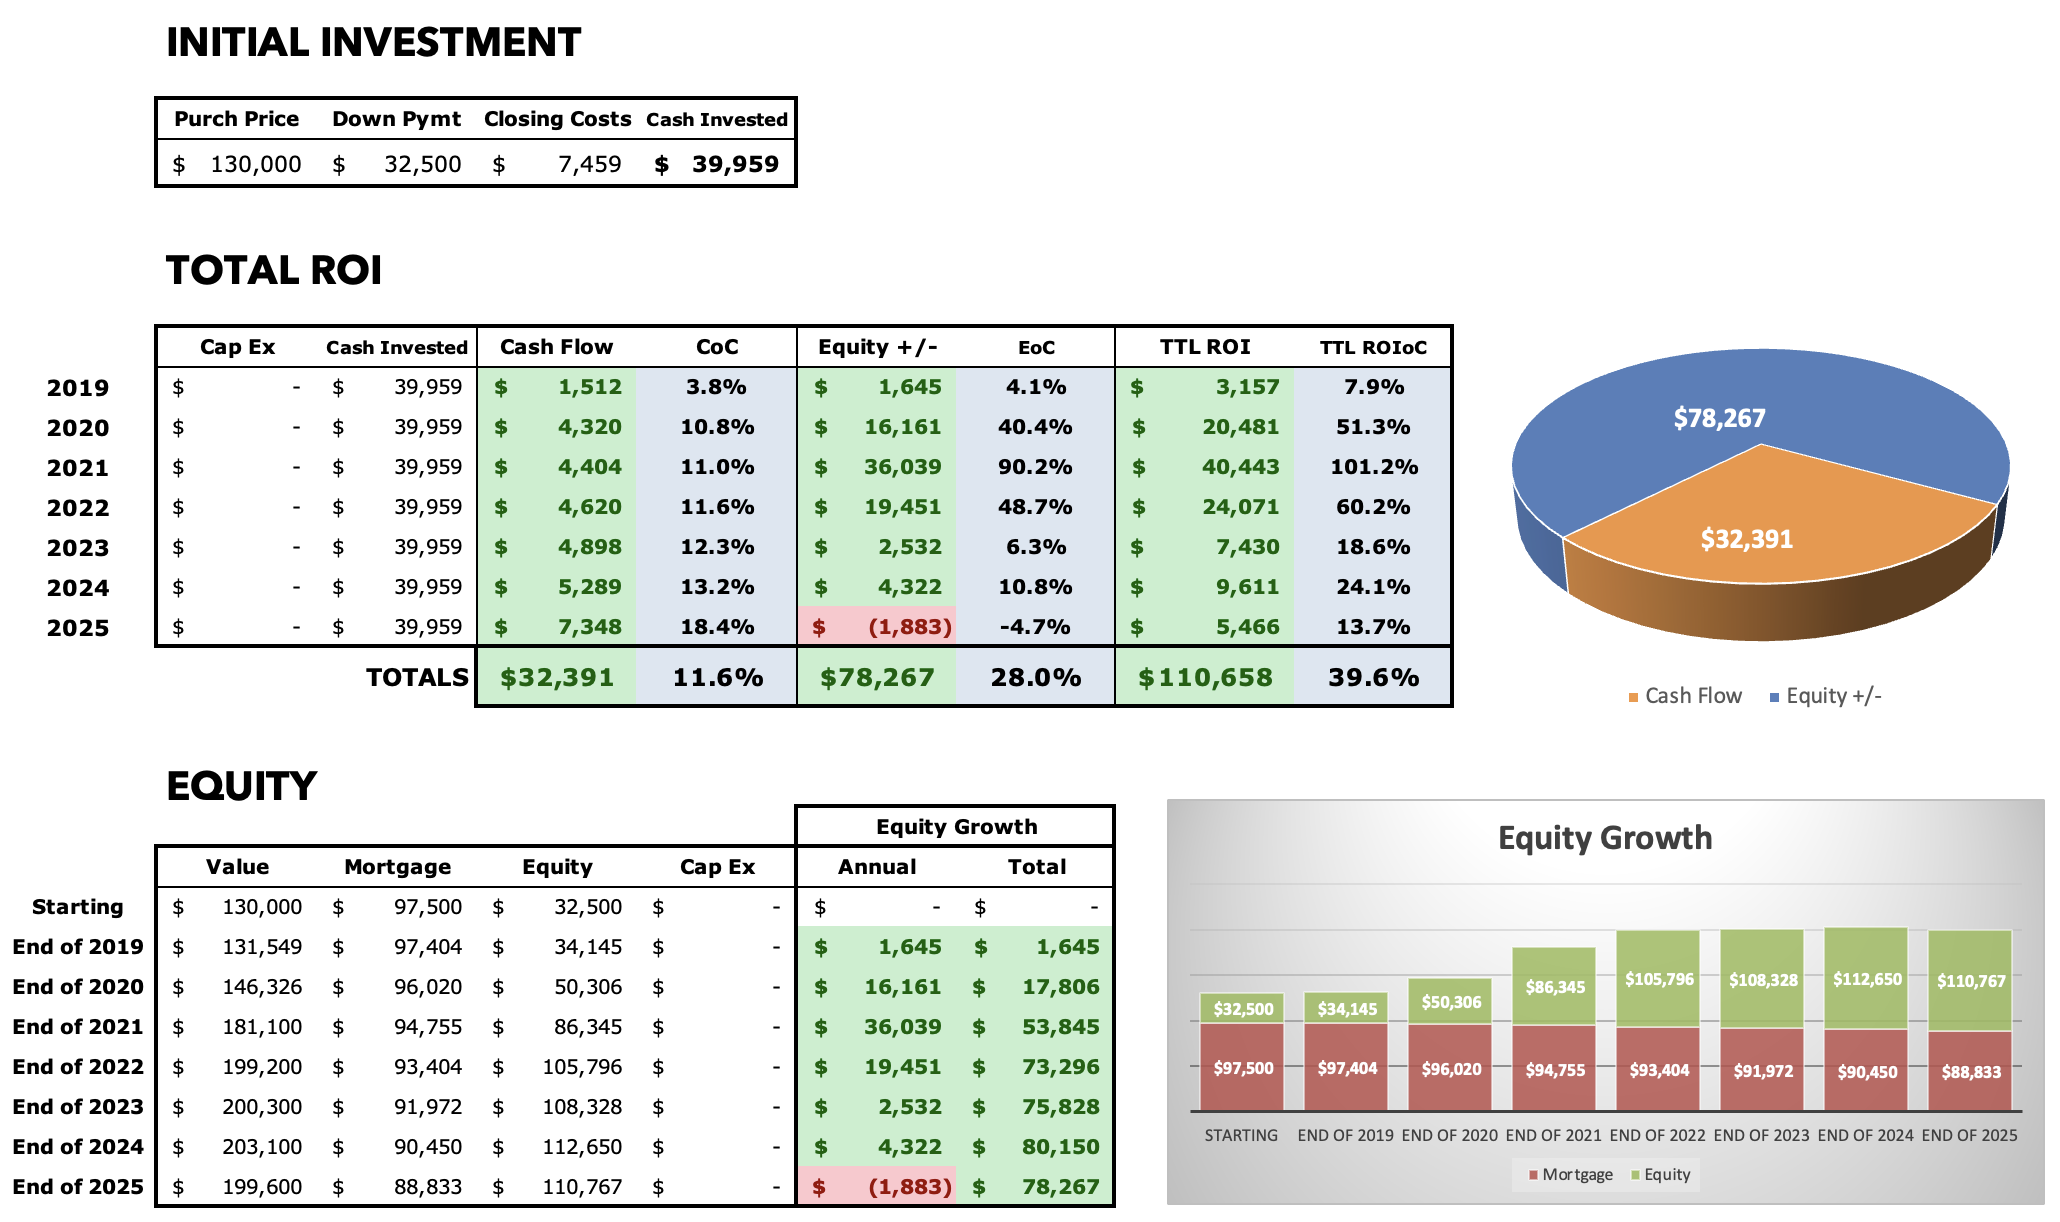
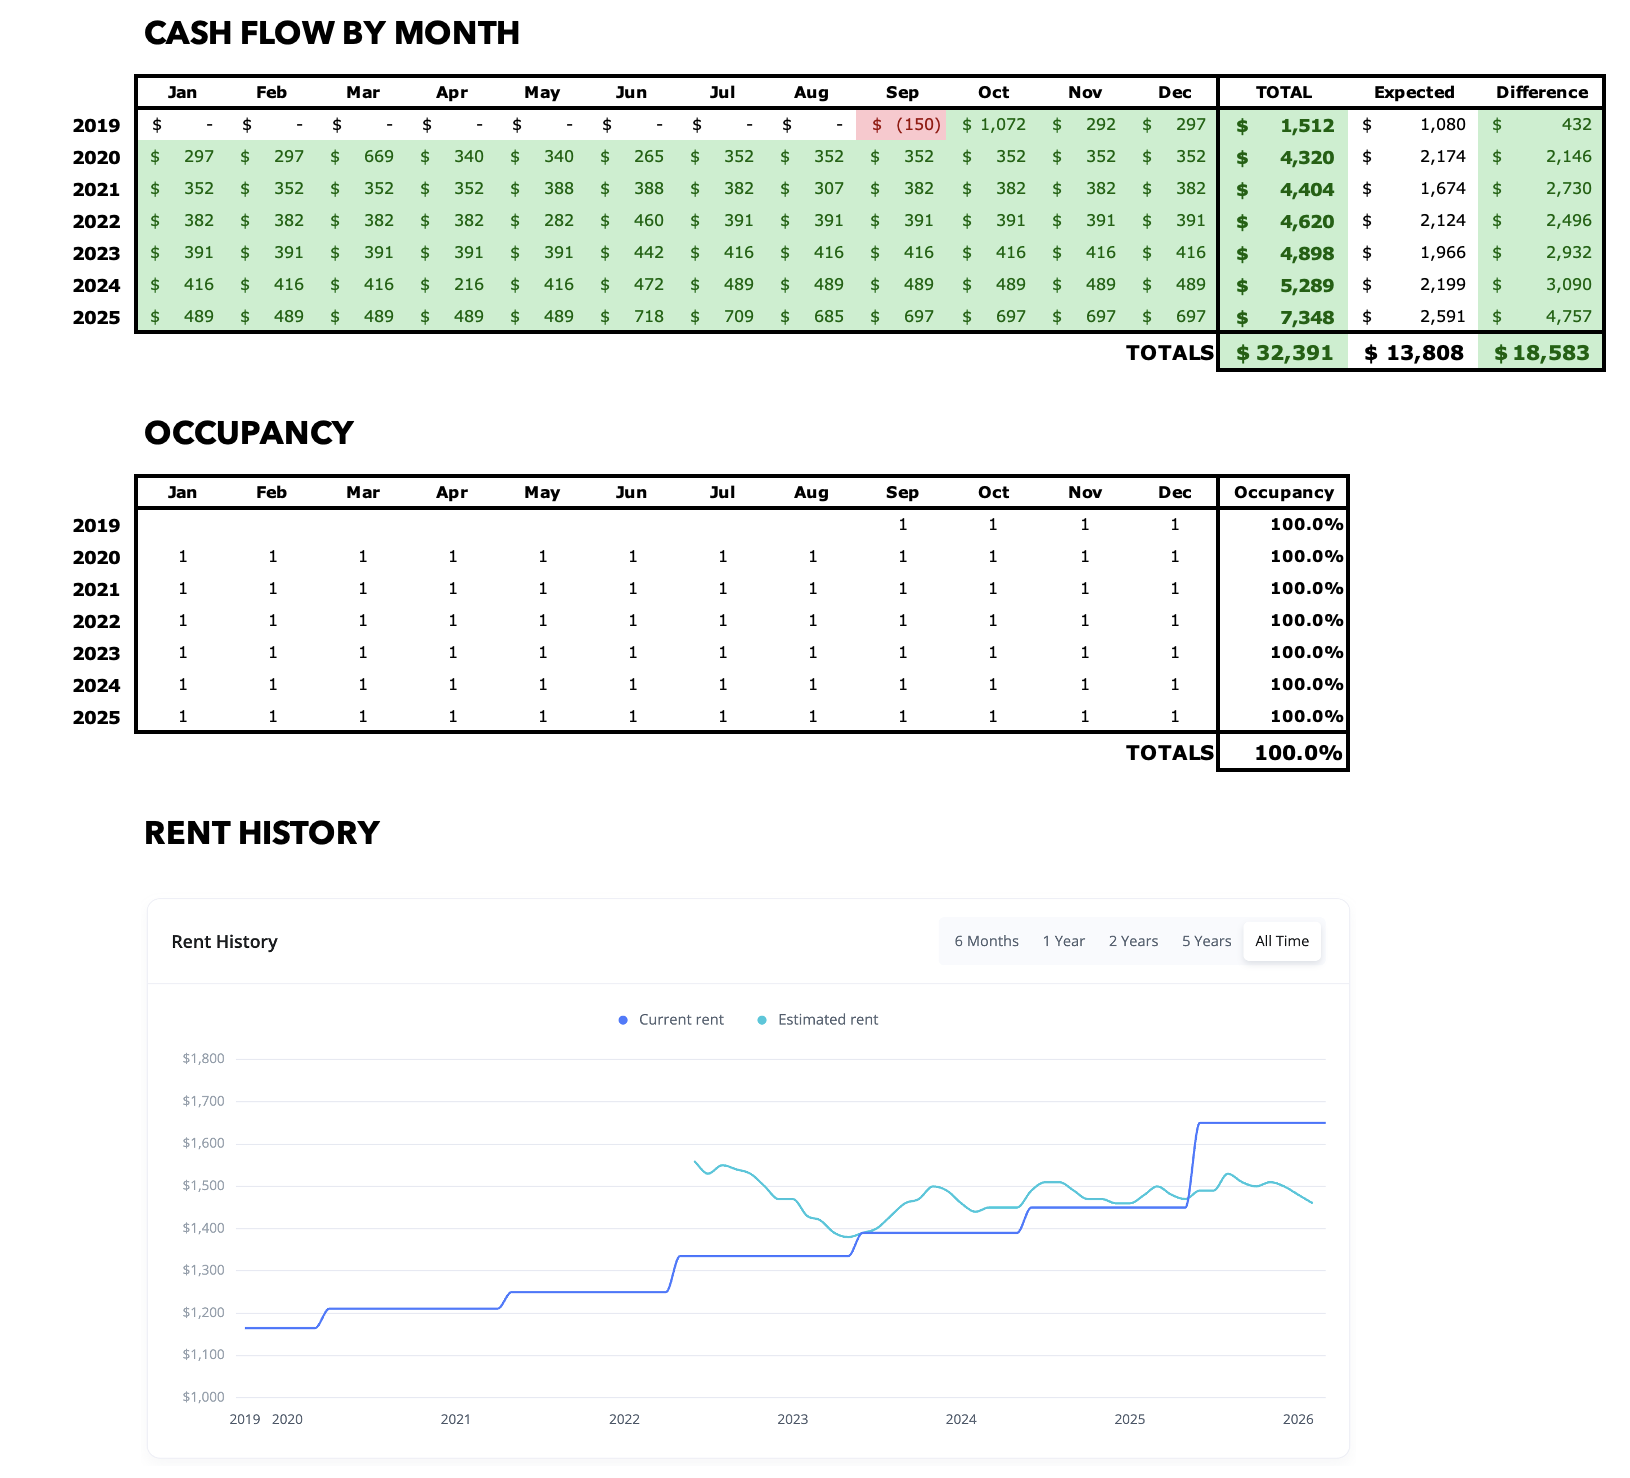
For all Property Spotlights, I come back at the end of each year to provide a brief narrative of what happened at the property that year. I also update my annual and cumulative figures for the property, including cash flow, equity growth, and occupancy.
2019
Everything went smoothly after closing in September, and I managed a positive cash flow of $1.5K for the year (not always easy in the Year 1.)
2020
The tenant renewed at $1,211/mo., and the only costs I incurred was $75 for an occupied home inspection from my PM. Cash flow for the year was $4.3K, about double my expected amount, and home prices began to increase as well.
2021
The tenant renewed again to $1,250/mo., and once again my maintenance costs were just $75 for the year. Cash flow was $4.4K, far outpacing my plan. Home prices spiked as part of the Pandemic Housing Boom.
2022
The tenant renewed again, this time to $1,335/mo. Rents were rising fast during these years after the pandemic. Maintenance costs were once again negligible, and my cash flow was $4.6K.
2023
Another renewal, another increase — this time to $1,390/mo. Expenses were $0, not even an occupied inspection this year, and cash flow rose to $4.9K. This really is the most boring, excellent house!
2024
Another year just like all the others: the tenant renewed for another year at $1,450/mo., which get them close to market rent; expenses were low, though I did have a $200 gutter cleaning (new preventative program from my PM); and cash flow was $5.3K, exceeding $5K for the first time.
2025
This year, the tenant decided not to sign a new lease, which made him subject to a $200/mo. to continue month-to-month. Apparently they were happy to pay this, rather than signing a new lease, so this turned into a de facto $200 rent increase for me. (No objections.)
As in previous years, maintenance costs were nil, and cash flow was very strong at $7.3K. The home’s value has been stable at ~$200K for several years now.
About the Author
Hi, I’m Eric! I used cash-flowing rental properties to leave my corporate career at age 39. I started Rental Income Advisors in 2020 to help other people achieve their own goals through real estate investing.
My blog focuses on learning & education for new investors, and I make numerous tools & resources available for free, including my industry-leading Rental Property Analyzer.
I have also served as a coach to over 100 private clients starting their own journeys investing in rental properties, and have helped my clients buy millions of dollars (and counting) in real estate. To chat with me about coaching, schedule a free initial consultation.
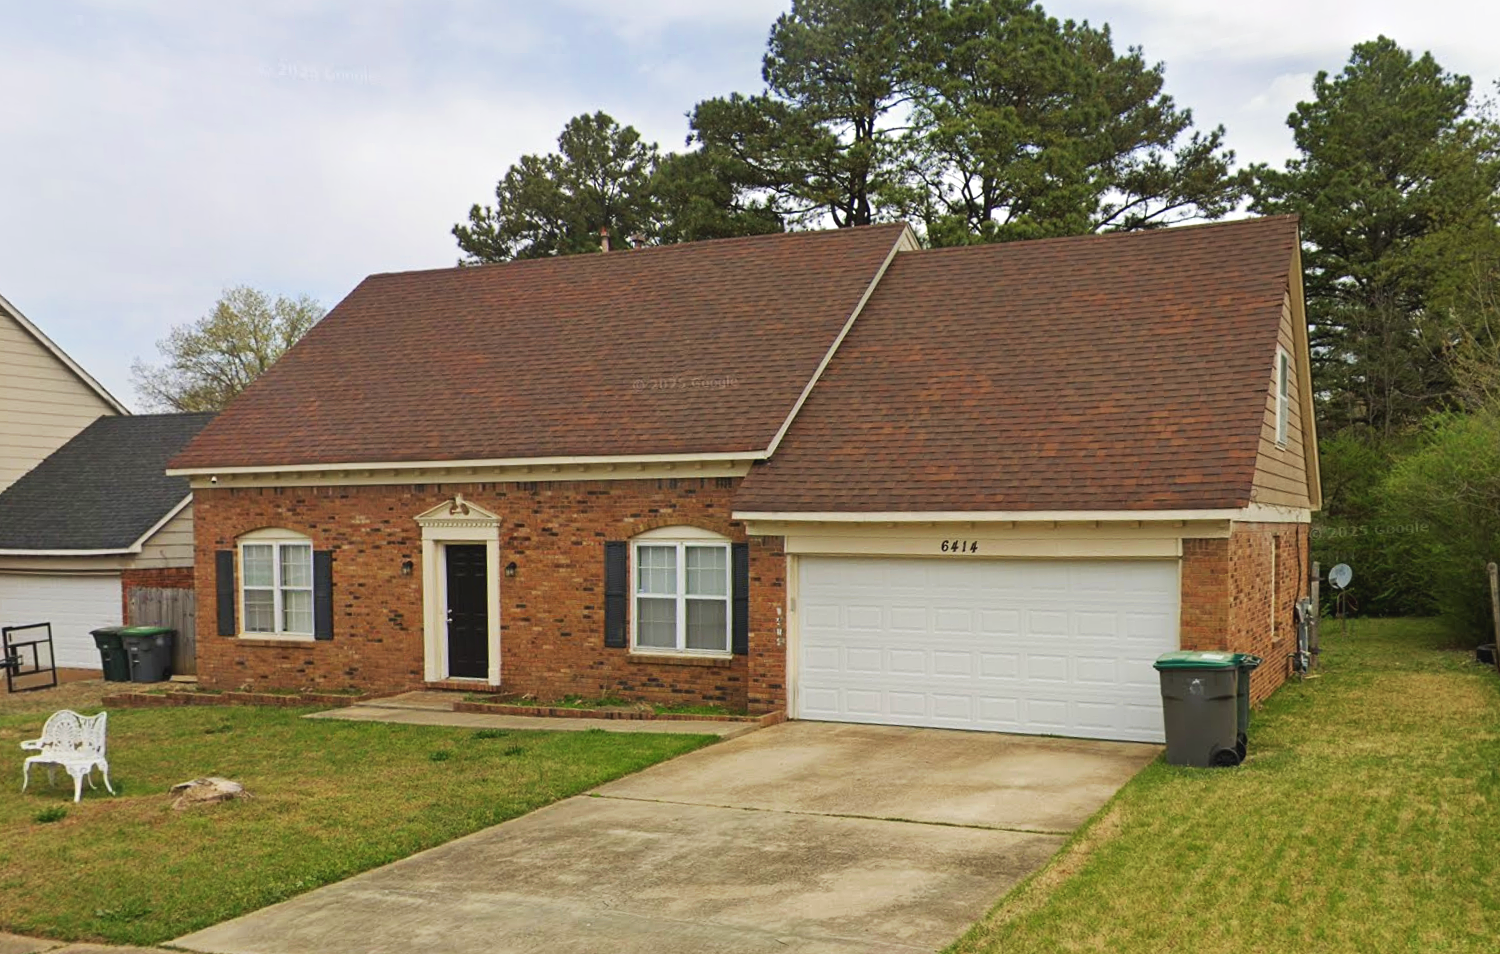
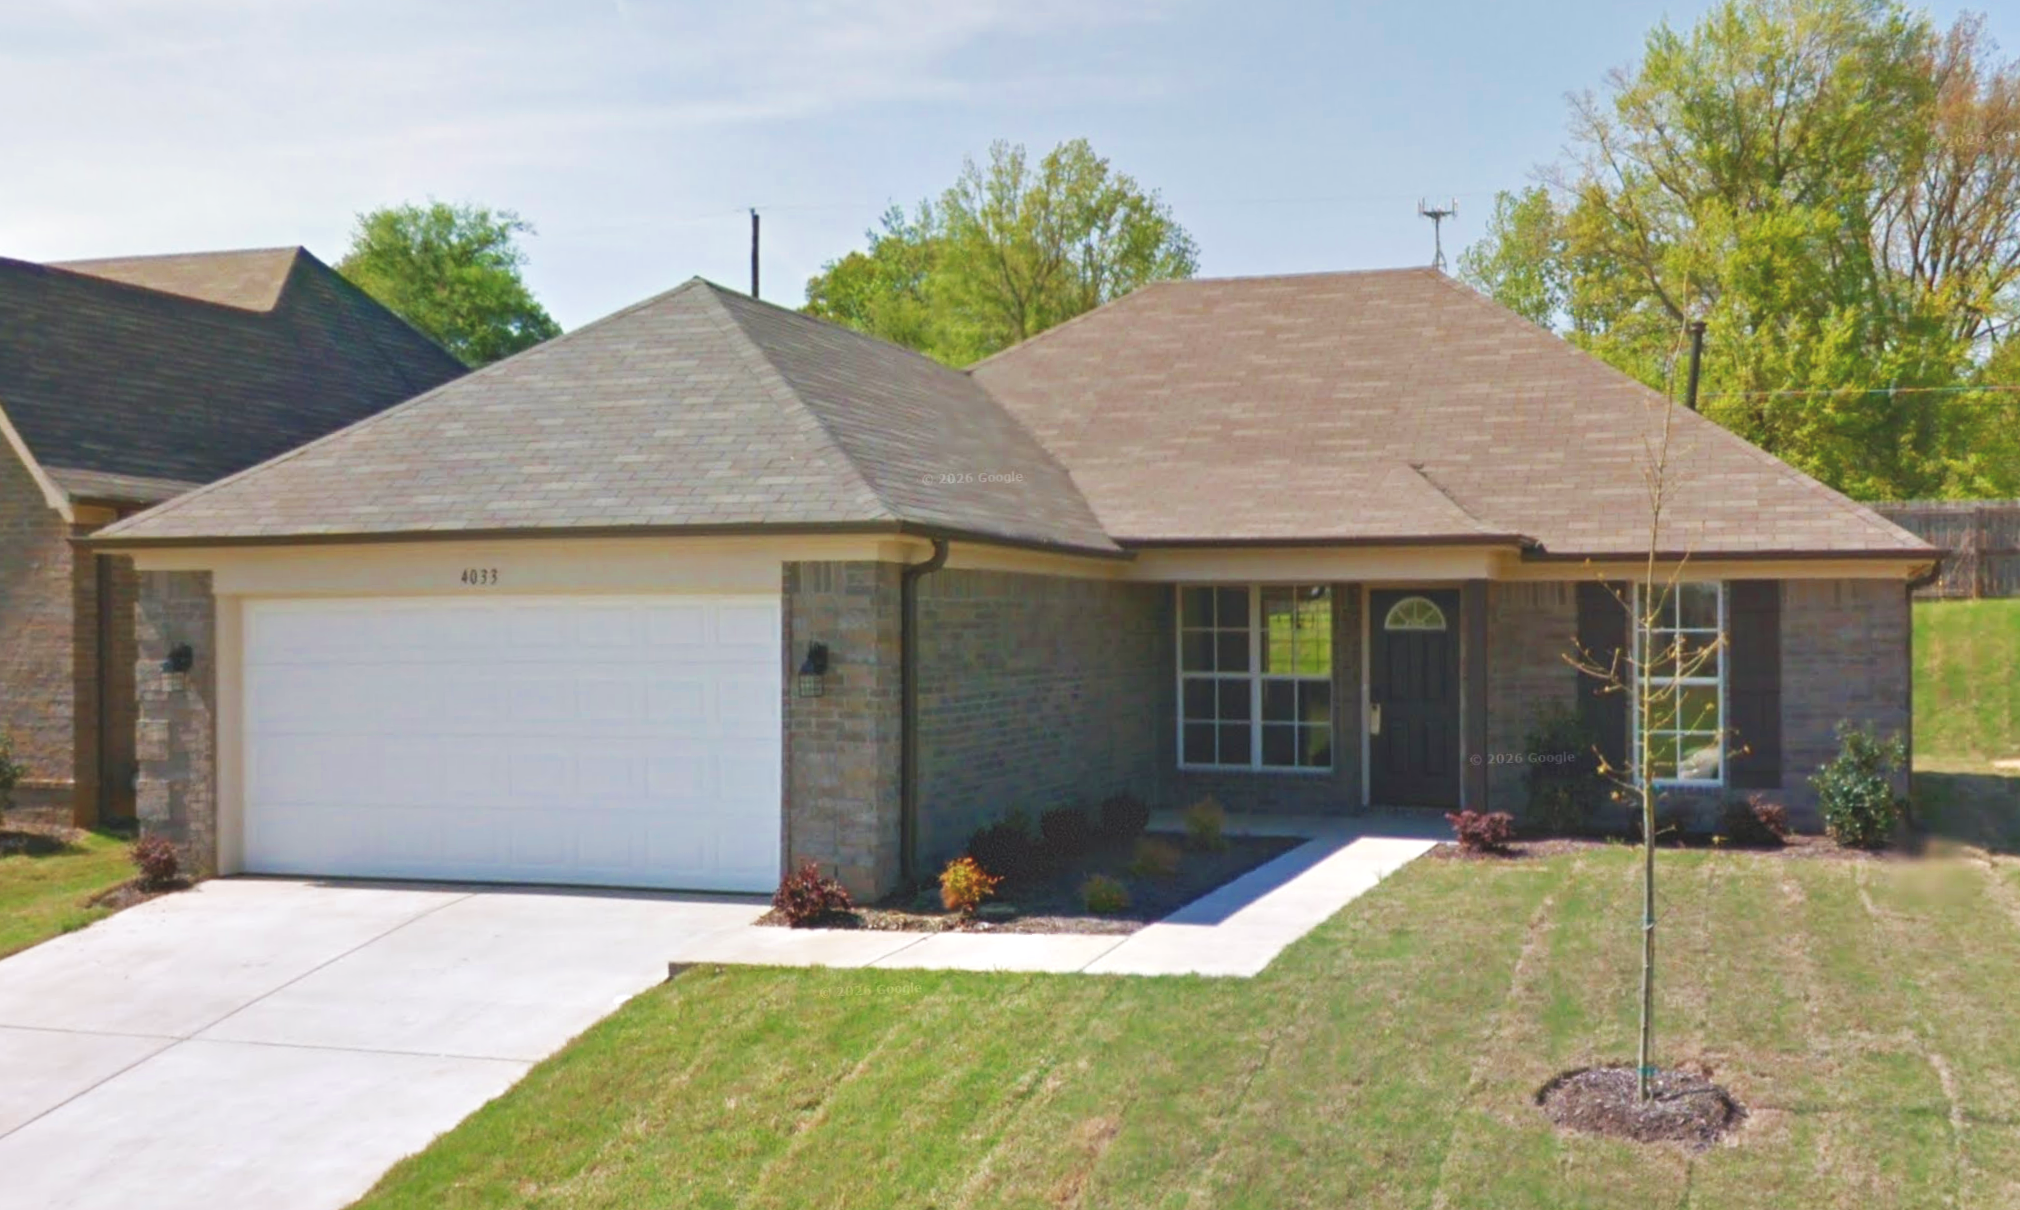
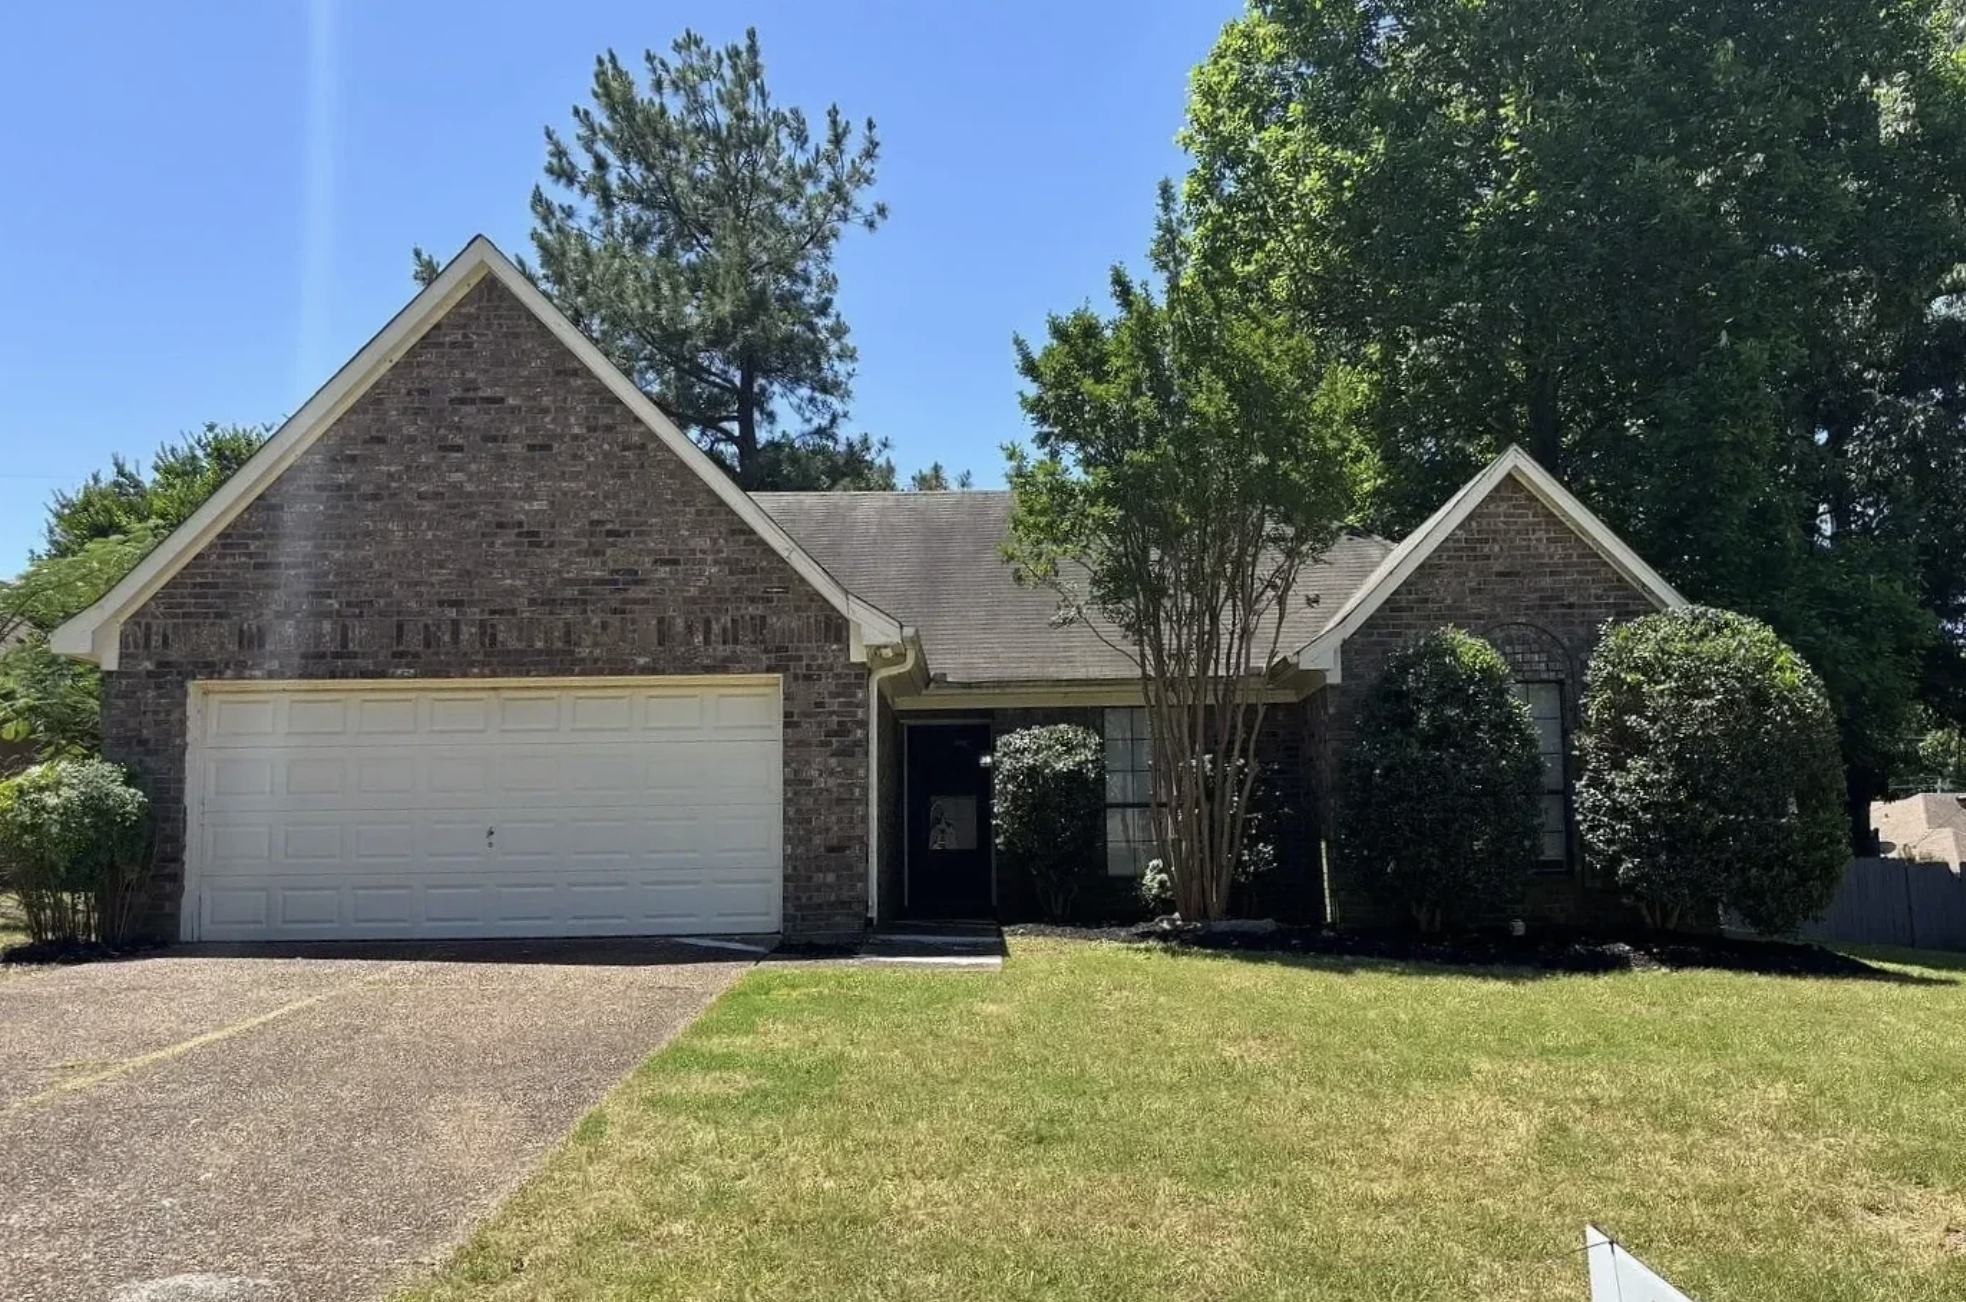
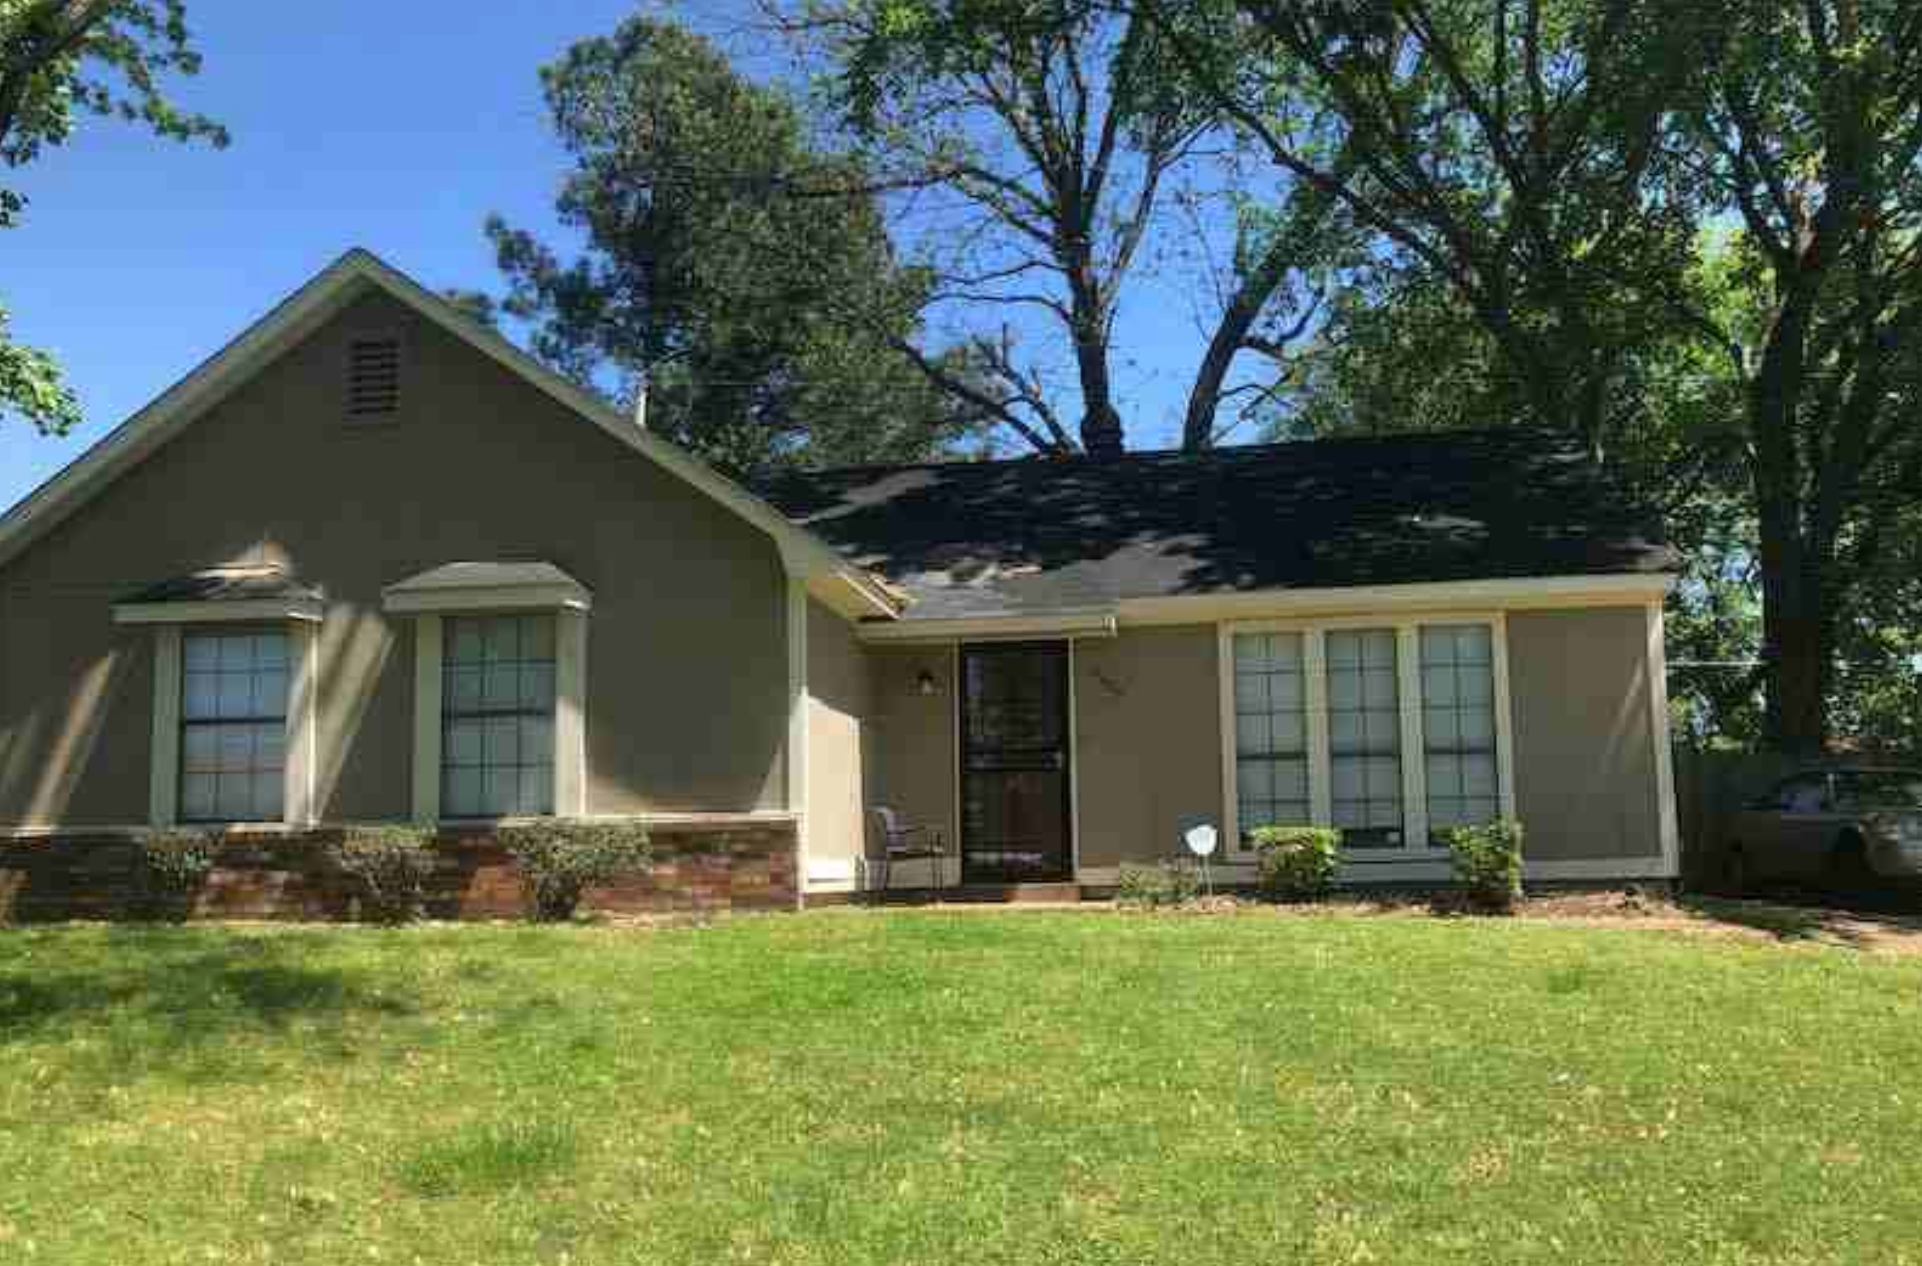
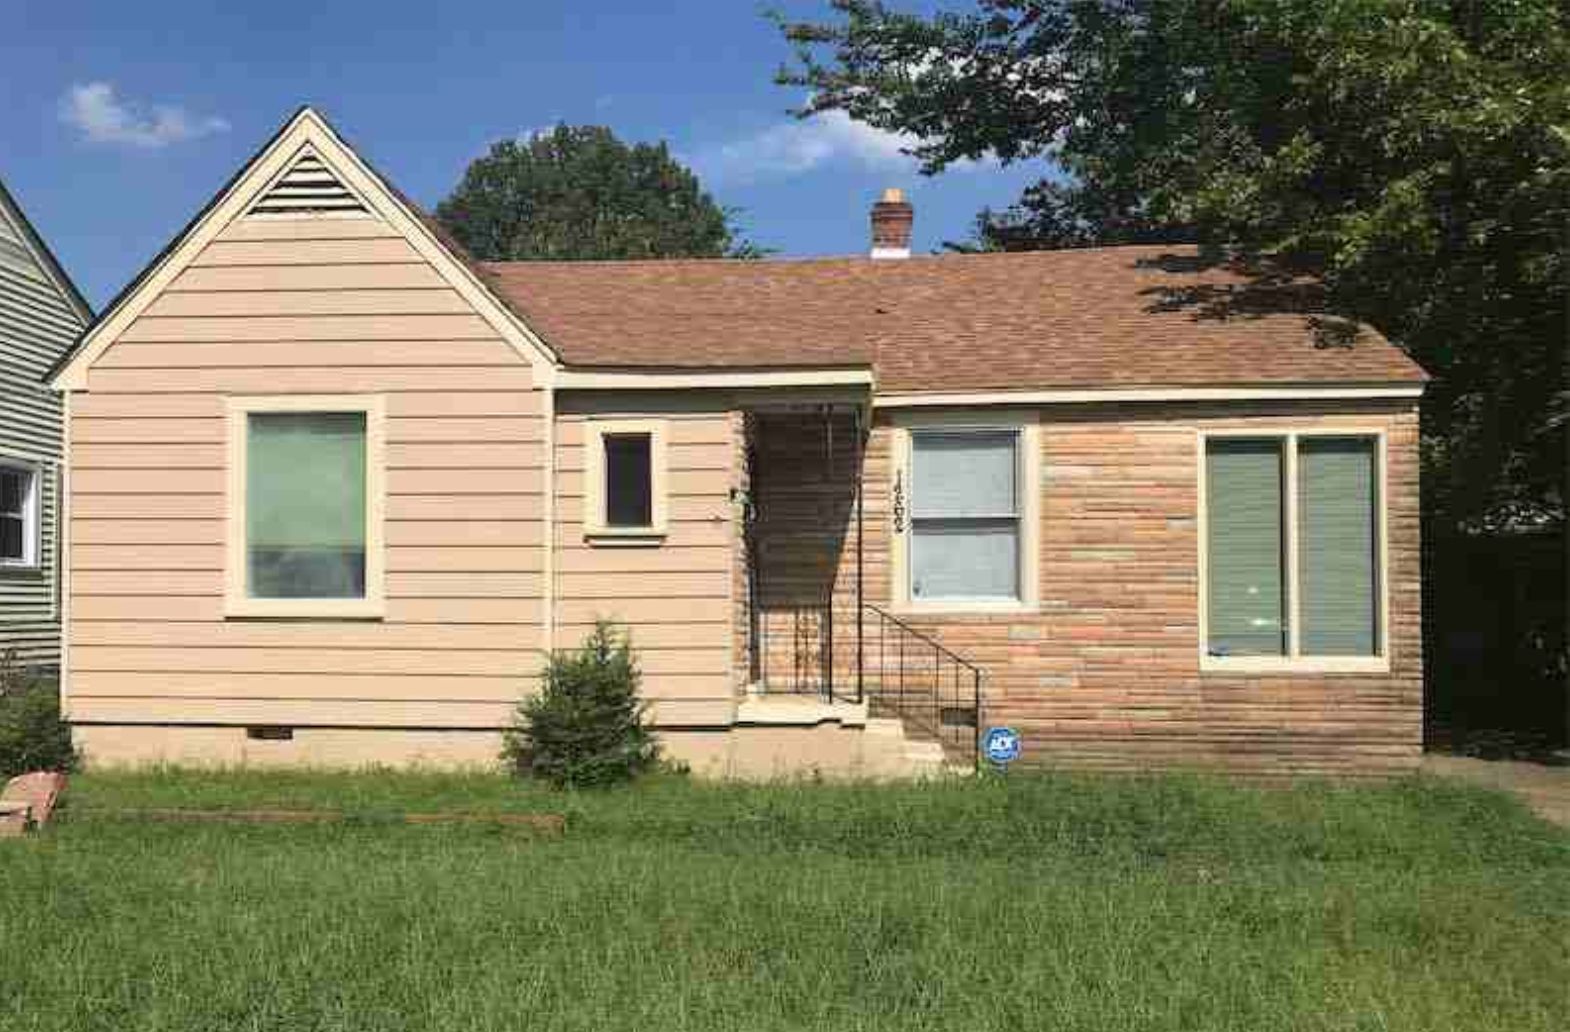


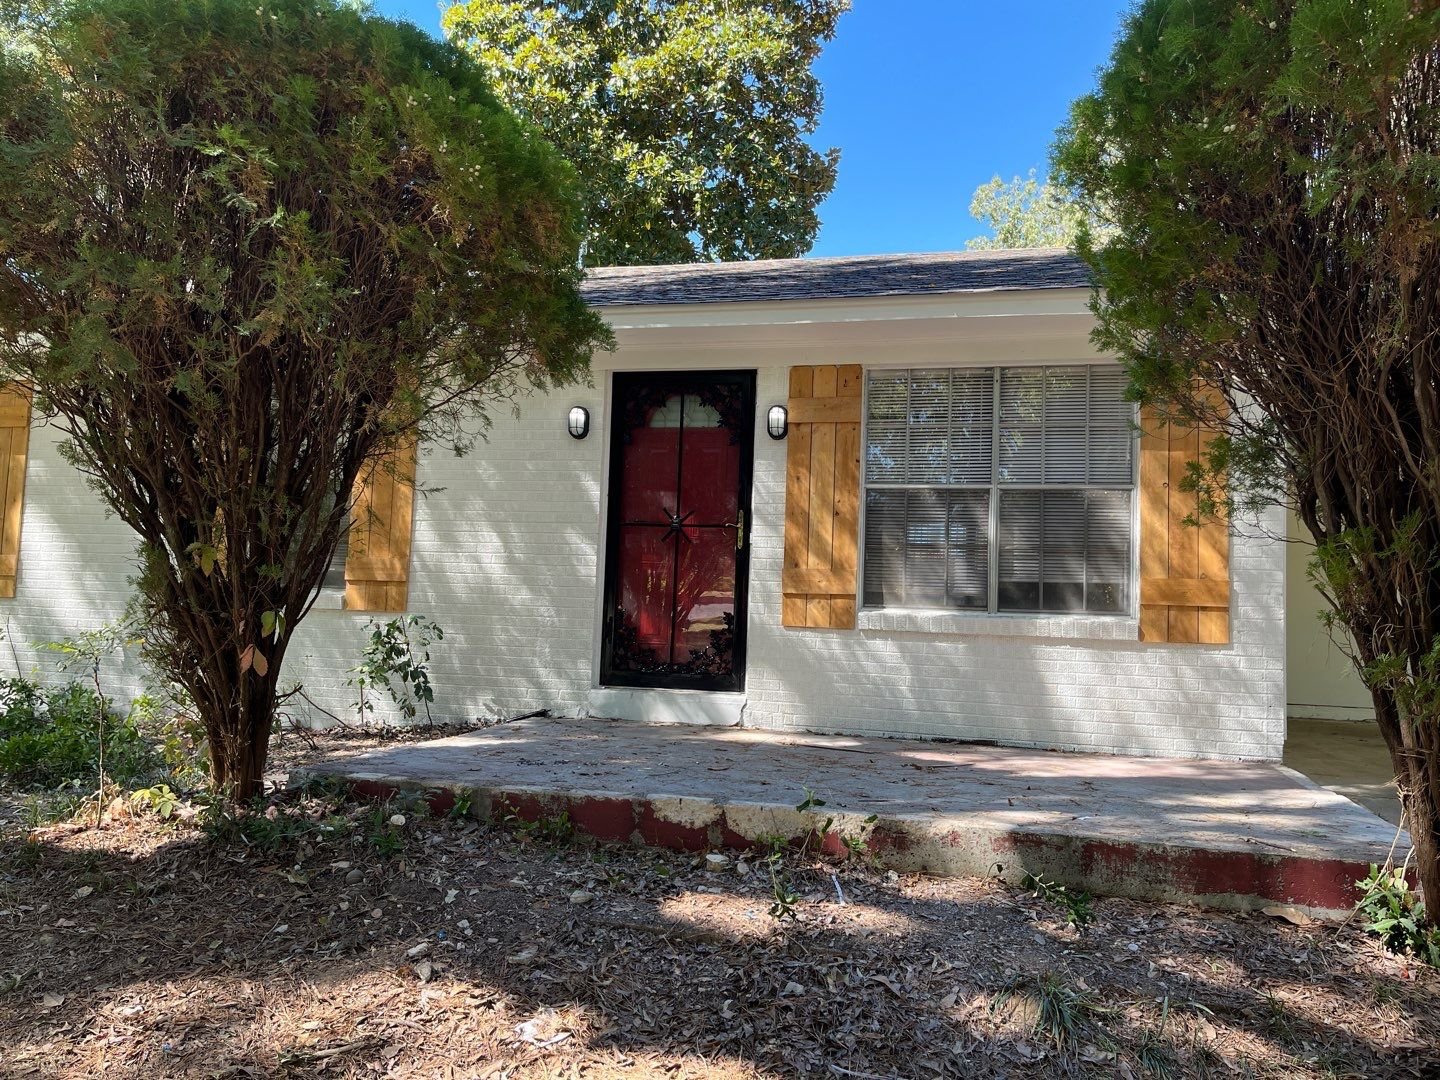


Property #16 in my Memphis rental portfolio is a cute 3/2 built in 1997, and sits in a quality B neighborhood. It has been a steady, strong performer in my portfolio.