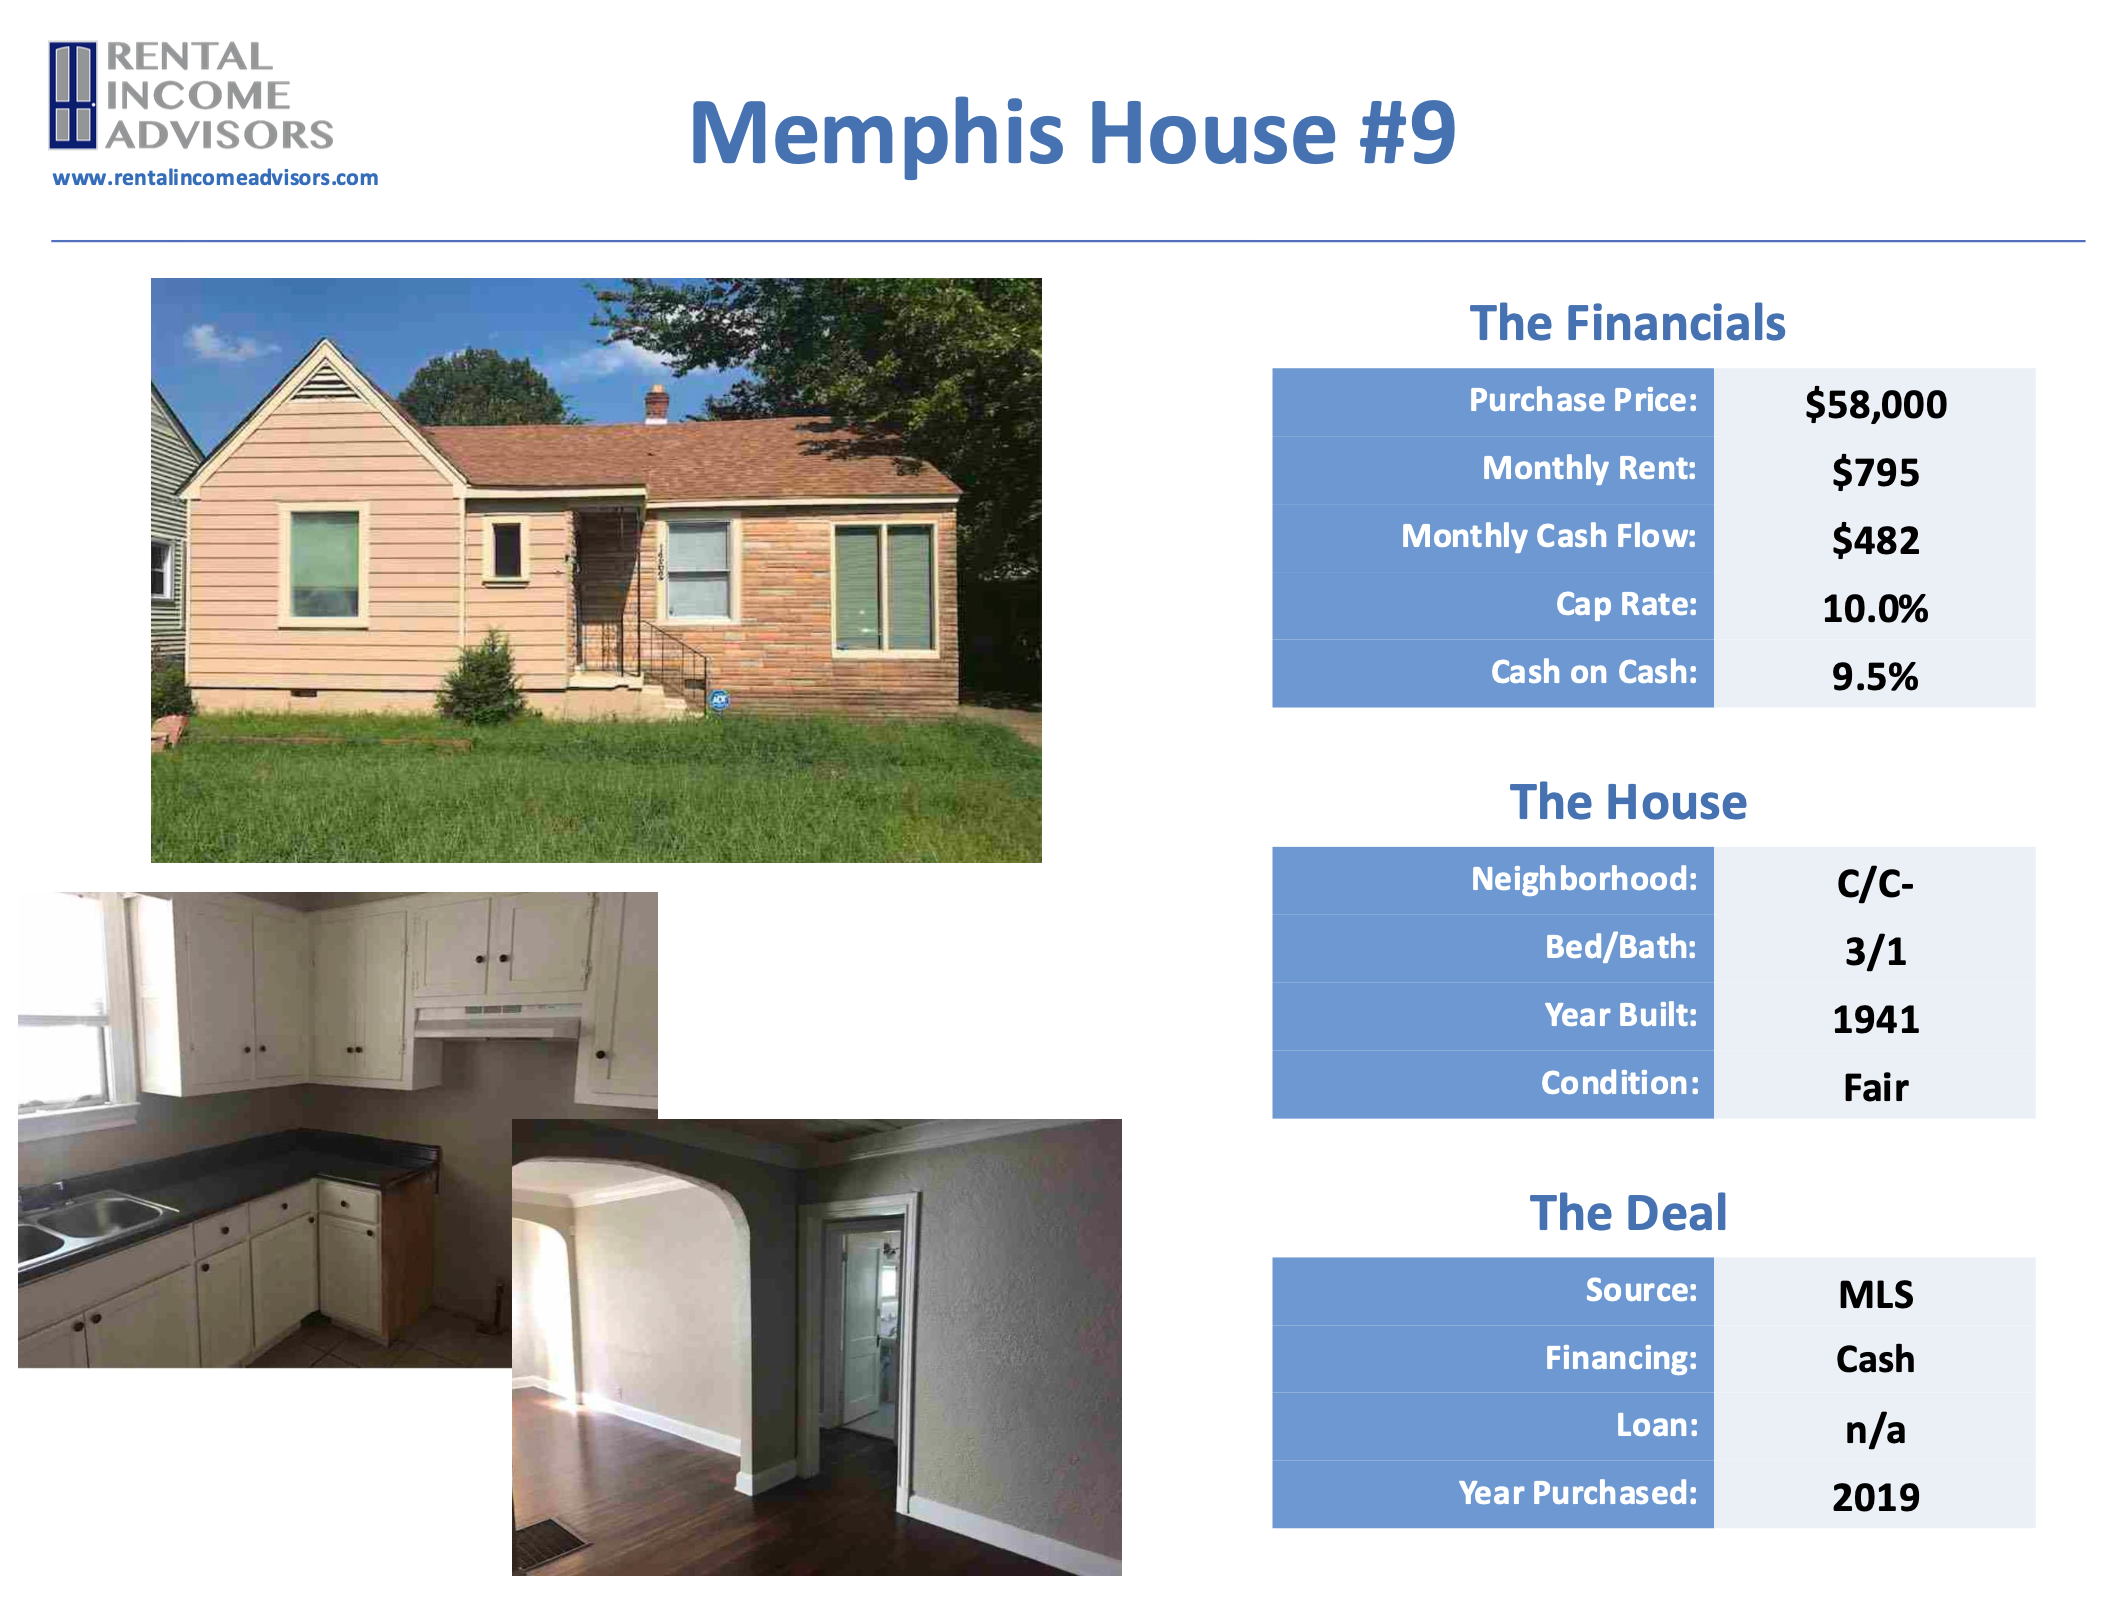
Memphis Rental Property #9

Last updated: 2026
NOTE: This article was published in 2025, but the house was bought six years earlier, in 2019. Refer to the Annual Updates section at the end of the article to see how the property has fared since then.
Say hello to Property #9 in my Memphis portfolio! Quick review: all my properties between #3 and #16 were purchased in a period of only 5 months from May to September of 2019. This was my opening acquisition sprint after I left my office job, sold my primary residence, and used the proceeds to invest in a portfolio of cash-flowing rental homes.
If you’re reading these articles in order, this property has a lot more in common with Property #7 than it does Property #8. Like Property #7, it’s among the oldest homes in my portfolio (1941), it’s in a C/C- area; it was purchased very cheaply ($58,000); and I did not use a mortgage. (Well, actually…I got a mortgage initially, but then paid it off a few months later in order to open a mortgage slot for a more expensive property. Very inefficient, don’t recommend! But I’ve owned it free and clear except for the first few months after I closed.)
This house also has a number of great lessons about specific things to look for (and avoid) when you’re shopping for properties. In fact, I would never buy this house today, for several reasons that I’ll review in the discussion below. Still, despite it’s shortcomings, it’s turned out fine, at least so far.
Alright, let’s take a closer look at this house and deal!
Property #9: The Deal
This was the first MLS property I bought. Before this one, I had relied mostly on Roofstock as a deal source, and had also purchased a turnkey property. However, as I got more confident in what I was looking for, I shifted my focus and began to rely more heavily on publicly-listed properties, where I had many more options from which to choose.
The house was being offered at $59,500, and had a tenant in place at $795/mo. This is a very strong price-to-rent ratio, which was typical in these neighborhoods at that time. Still, the rent amount was relatively low, which means that larger maintenance and capex items will take a bigger chunk out of the homes revenue as compared to a higher-rent home. (That’s something to always keep in mind when estimating expenses in a pro forma — sometimes blindly using percentages will lead you astray.)
Through my agent, I originally offered $54,500. The seller came down to $58,000, but was unwilling to go any lower, so I ultimately agreed to move forward at $58,000.
Here are some additional facts about this particular house:
3-beds, 1 full bath
In the 38122 zip code (the only house I own in that zip)
Built in 1941
1767 square feet of interior space (huge for a 3/1, due to an addition…more on that below)
Central air in original home; through-wall unit in the addition
Hardwood floors (rare; most rental homes have had LVP installed)
Freestanding carport (a bit unusual)
Tenant in place paying $795/mo.
Property #9: Due Diligence
Looking back over my email and documents from the time I purchased this property, it appears I did not do a licensed home inspection, and instead relied on a a rehab scope from my property manager at the time. (Yikes! Don’t ever do this.)
As a result, I didn’t really have great info on the age and condition of the roof, HVAC, furnace, or water heater. I did have some photos and info about small repairs and cosmetic improvements that might be needed when the tenant vacated. The home was in decent shape, and here are some things I liked about it (beyond the strong numbers):
Plenty of space
Hard surface floors throughout
Nice look & feel with arched doorways between rooms
Tenant kept the home nicely
Why I Would Avoid This House Today
But I was focused on the wrong things when I evaluated this home, and ignored some important factors that I pay close attention to these days. Here’s why I would likely never buy this house today:
It’s too big. 1800 square feet is enormous for a 3/1, and more space leads to more maintenance costs over time
It’s too old. It’s tough to completely avoid older homes when you’re shopping in C-neighborhoods, but I would probably draw the line today at no older than 1950. This is informed by my recent deep dive into my own maintenance costs across my portfolio, which made clear that older homes cost more to maintain, on average, than newer ones.
It has an addition. This can be a problematic feature in rental properties for a few reasons. First, it’s more space (and therefore more cost) typically without additional bedrooms or bathrooms that would increase rent potential. Second, additions are not always built to a high standard, or even to local codes. Third, they are not always fully integrated into the main systems of the home, such as electrical, plumbing, and heating & cooling. That turned out to be the case in this home, but I only realized after the fact that the original house had central air, while the addition had a through-wall AC unit (that I would have to replace early on when it broke down. D’oh!)
It has a freestanding secondary structure. The carport here is a separate structure, which again means more stuff to maintain over time (including a separate roof.)
Back to the rest of due diligence: the tenant had moved in just under a year before, and had a spotless payment record, so no concerns there.
The house appraised at $62K, just above the purchase price, and we proceeded to closing in May 2019.
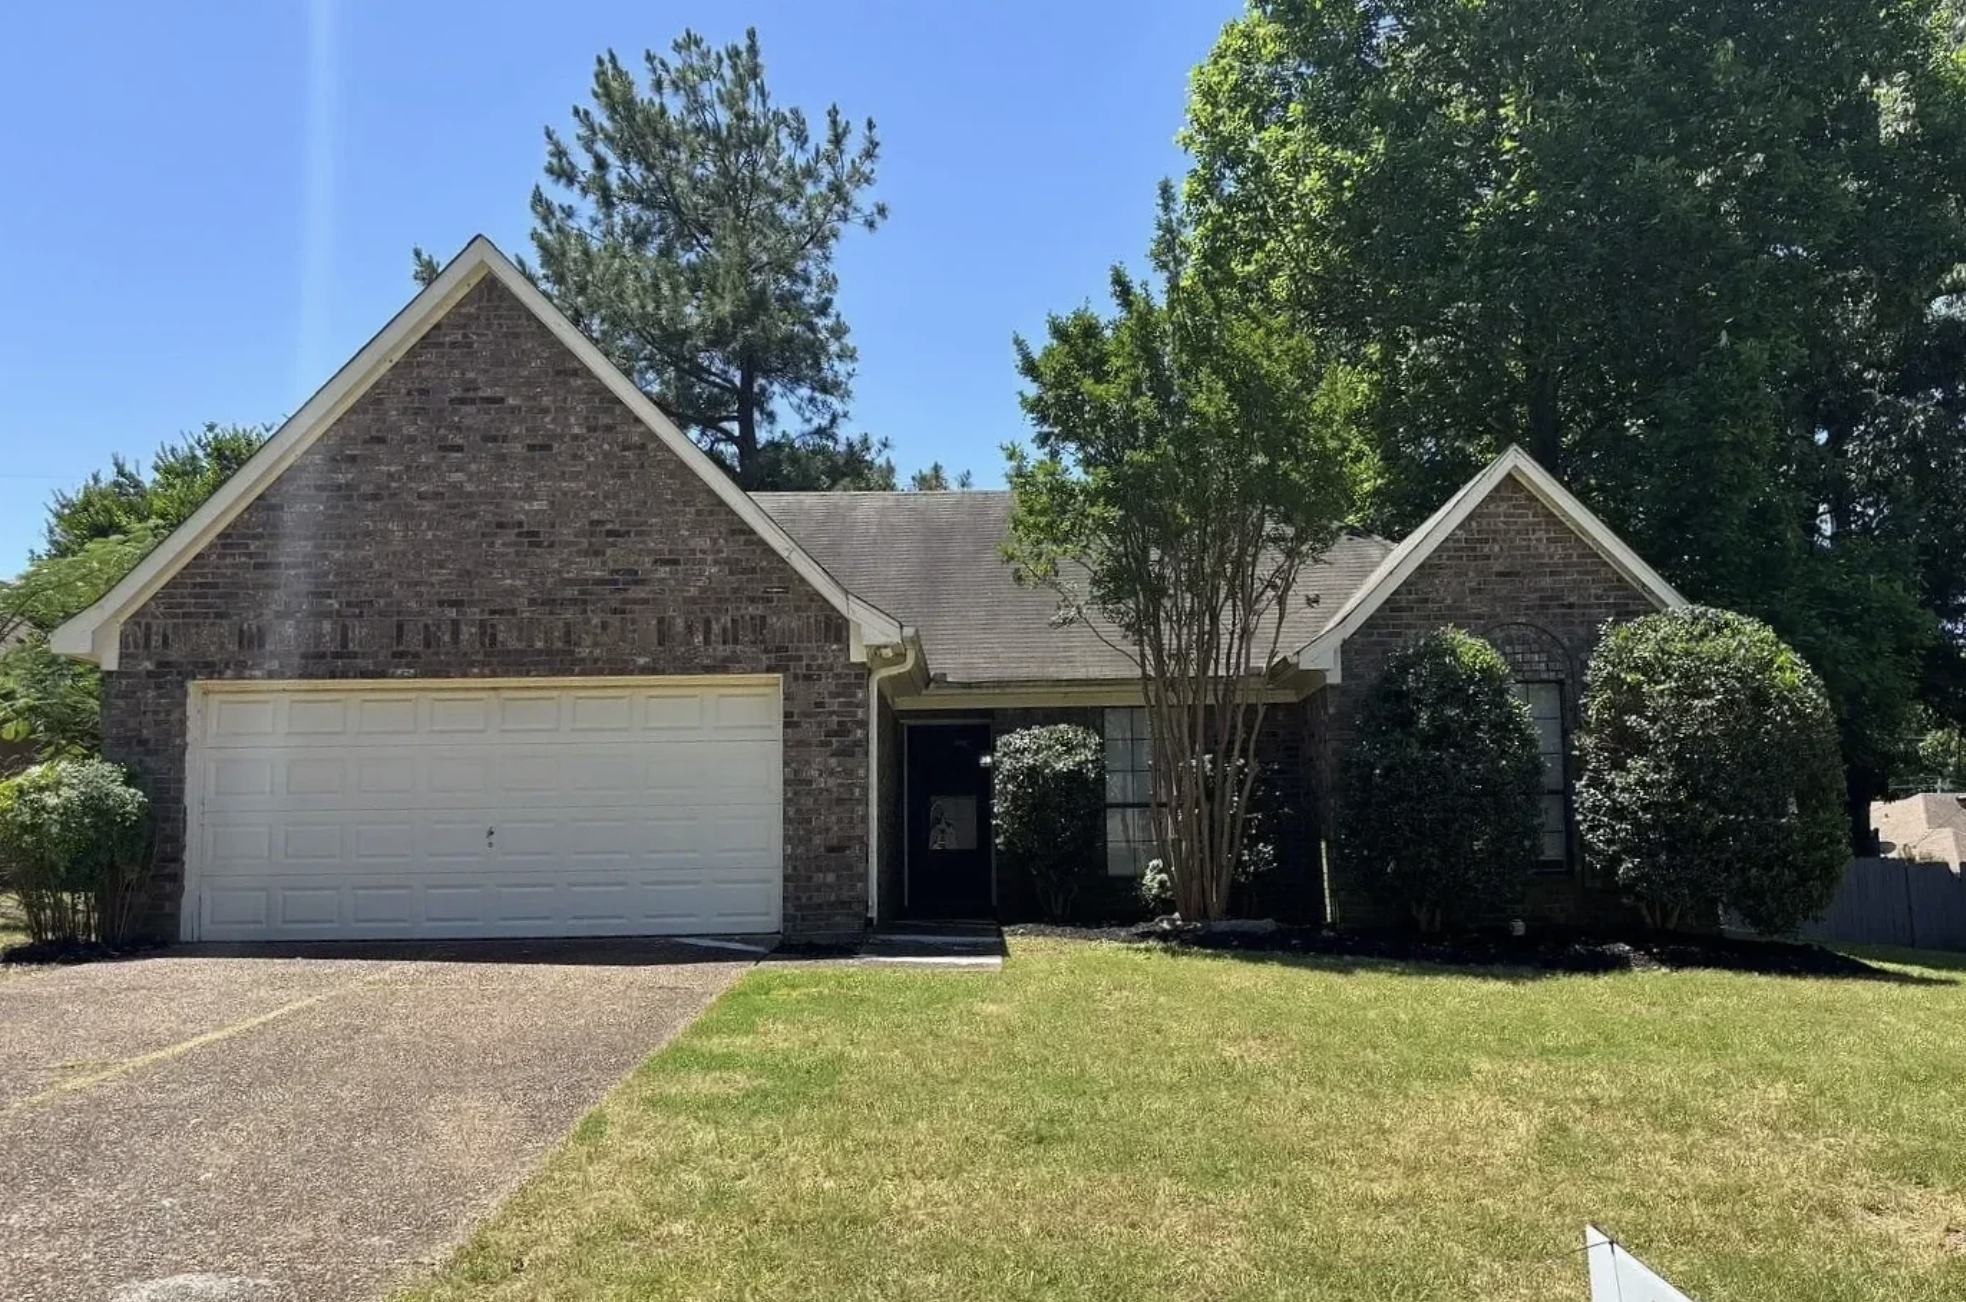
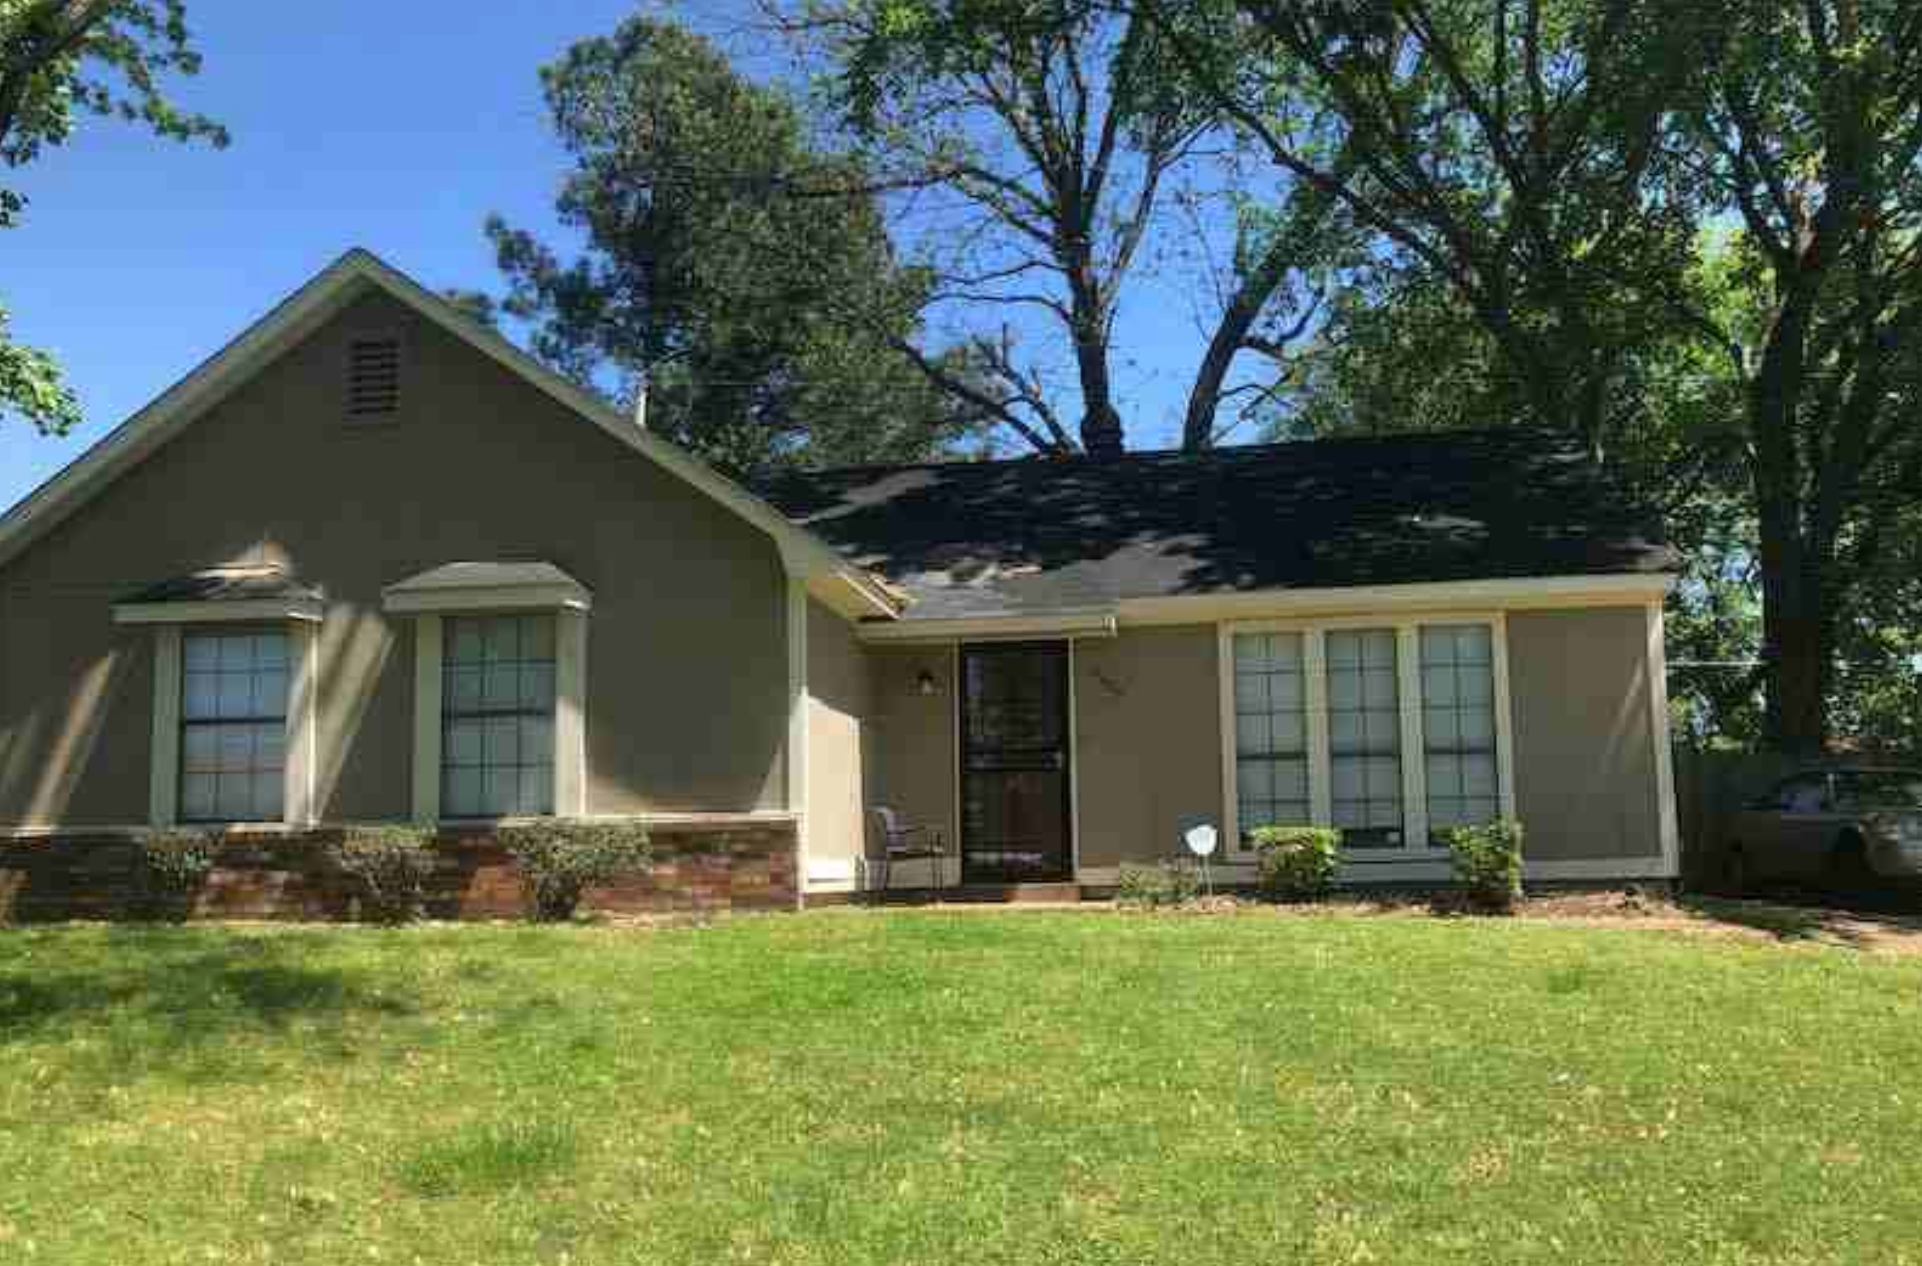
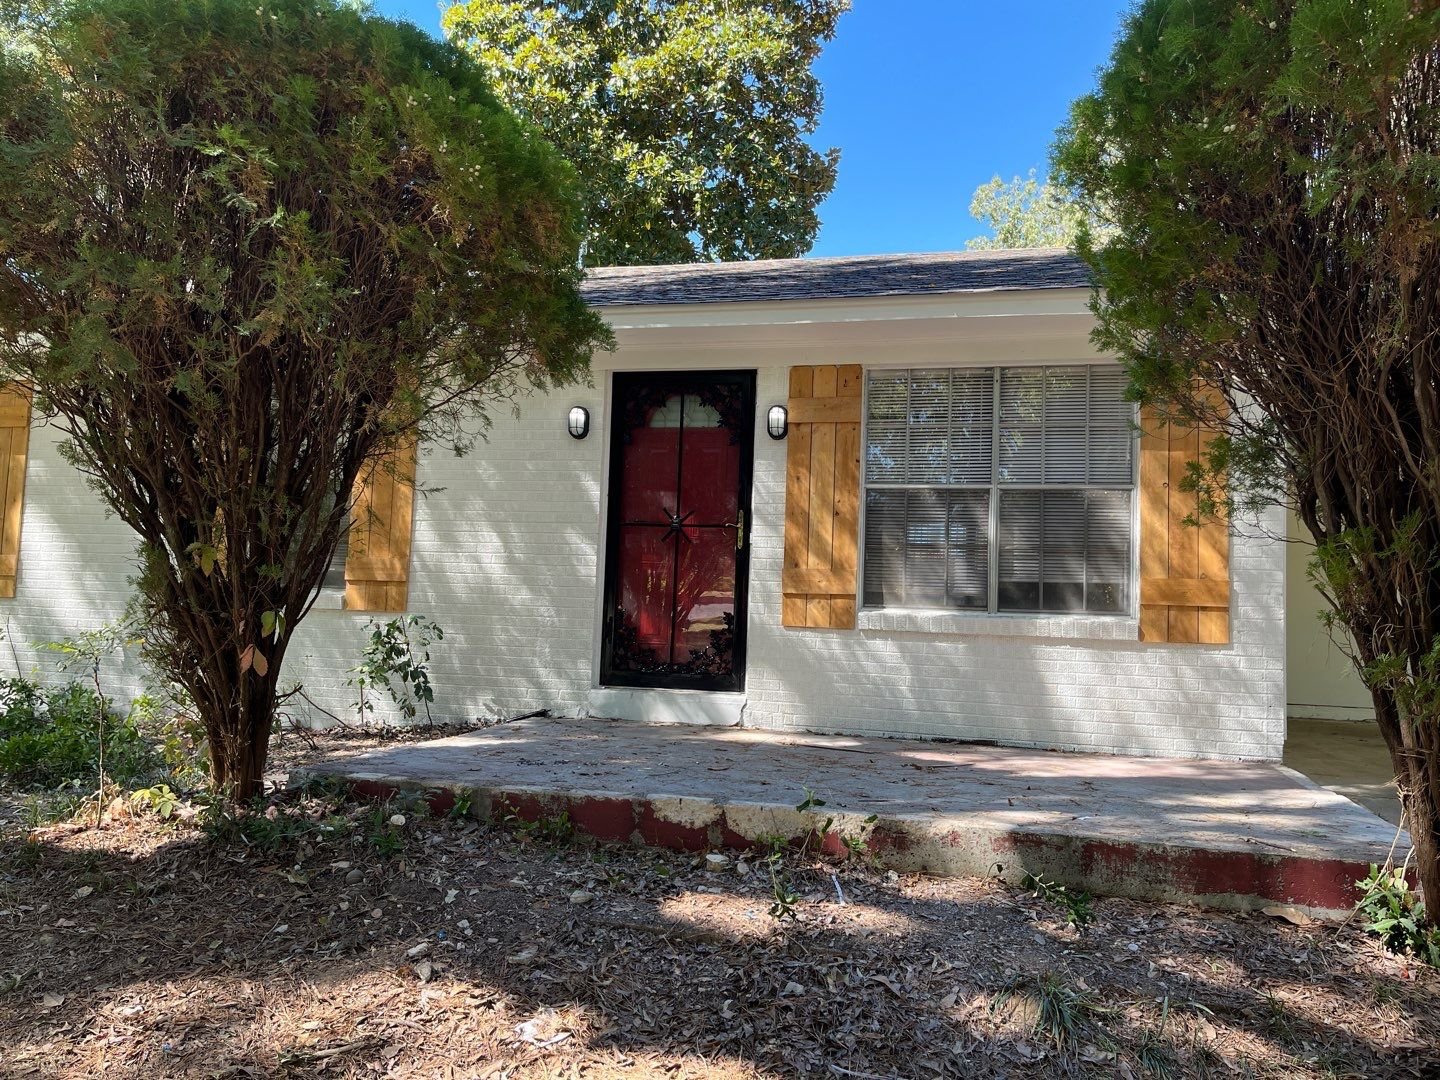
I don’t have any good marketing photos of this house — the only turn was in 2019, a few months after I bought the house, and I don’t have the photos from that time period. So forgive the poor quality of these photos, but here are a few just to give you an idea:


Property #9: The Financials
As already mentioned, I initially had a mortgage on this home, but I paid it off shortly after closing — so for the purposes of my numbers, I will assume I always owned it in cash (while still incorporating the loan closing costs I paid.)
I used the RIA Property Analyzer to run the final numbers on this property, and here’s what I came up with for an initial pro forma. Without a mortgage, I don’t get the benefit of leveraged appreciation in my total ROI, but the cash returns are very healthy:

Purchase Price: $58,000
Monthly Rent: $795
Monthly Cash Flow: $482
Cap Rate: 10.0%
Cash on Cash Returns: 9.5%
Total ROI 2% Appreciation: 11.4%
(Want to use this calculator? You can!)
OR
Using the multi-year model in the RIA Property Analyzer, we can visualize some of the main long-term trends assuming a long-term inflation rate of 2%. Some of these trends are noticeably different from other Property Spotlights due to the fact that there is no mortgage on this property:

Cash flow increases over time. Both rent and expenses are projected to increase with inflation, but the gap between the two still grows each year:
Cash Flow Year 1: $4,332
Cash Flow Year 10: $5,177
Cash Flow Year 25: $6,968
Without leverage, total returns are lower, but the vast majority of the returns are in the form of cash flow. The only other form of returns are appreciation, which are a much smaller portion:
Appreciation Year 1: $900
Appreciation Year 10: $1,076
Appreciation Year 25: $1,448


Total returns on cash increases over time. This is a consequence of the first two graphs — I will make greater total returns over time on the same initial investment of cash. But total returns on equity remains flat.
Total Returns on Cash Year 1: 11.4%
Total Returns on Cash Year 10: 13.6%
Total Returns on Cash Year 25: 18.36%
The numbers here reflect an aggressive play for cash flow. Not a newer or nicer home, and not in a great area - but still with the potential to produce attractive cash returns, which was one of my major goals. (Remember, I had just left my job, and needed to replace as much of my income as I could!)
Property #9: The Deal Sheet
Finally, to sum up Property #9 and its financials, here’s the full “deal sheet”:
Looking for YOUR Next Property?
If you need help finding, analyzing, and purchasing YOUR next property — or your first one! — schedule a free initial consultation with me. I’ve helped over 100 private coaching clients invest with confidence and build cash-flowing rental portfolios of their own.
Annual Updates
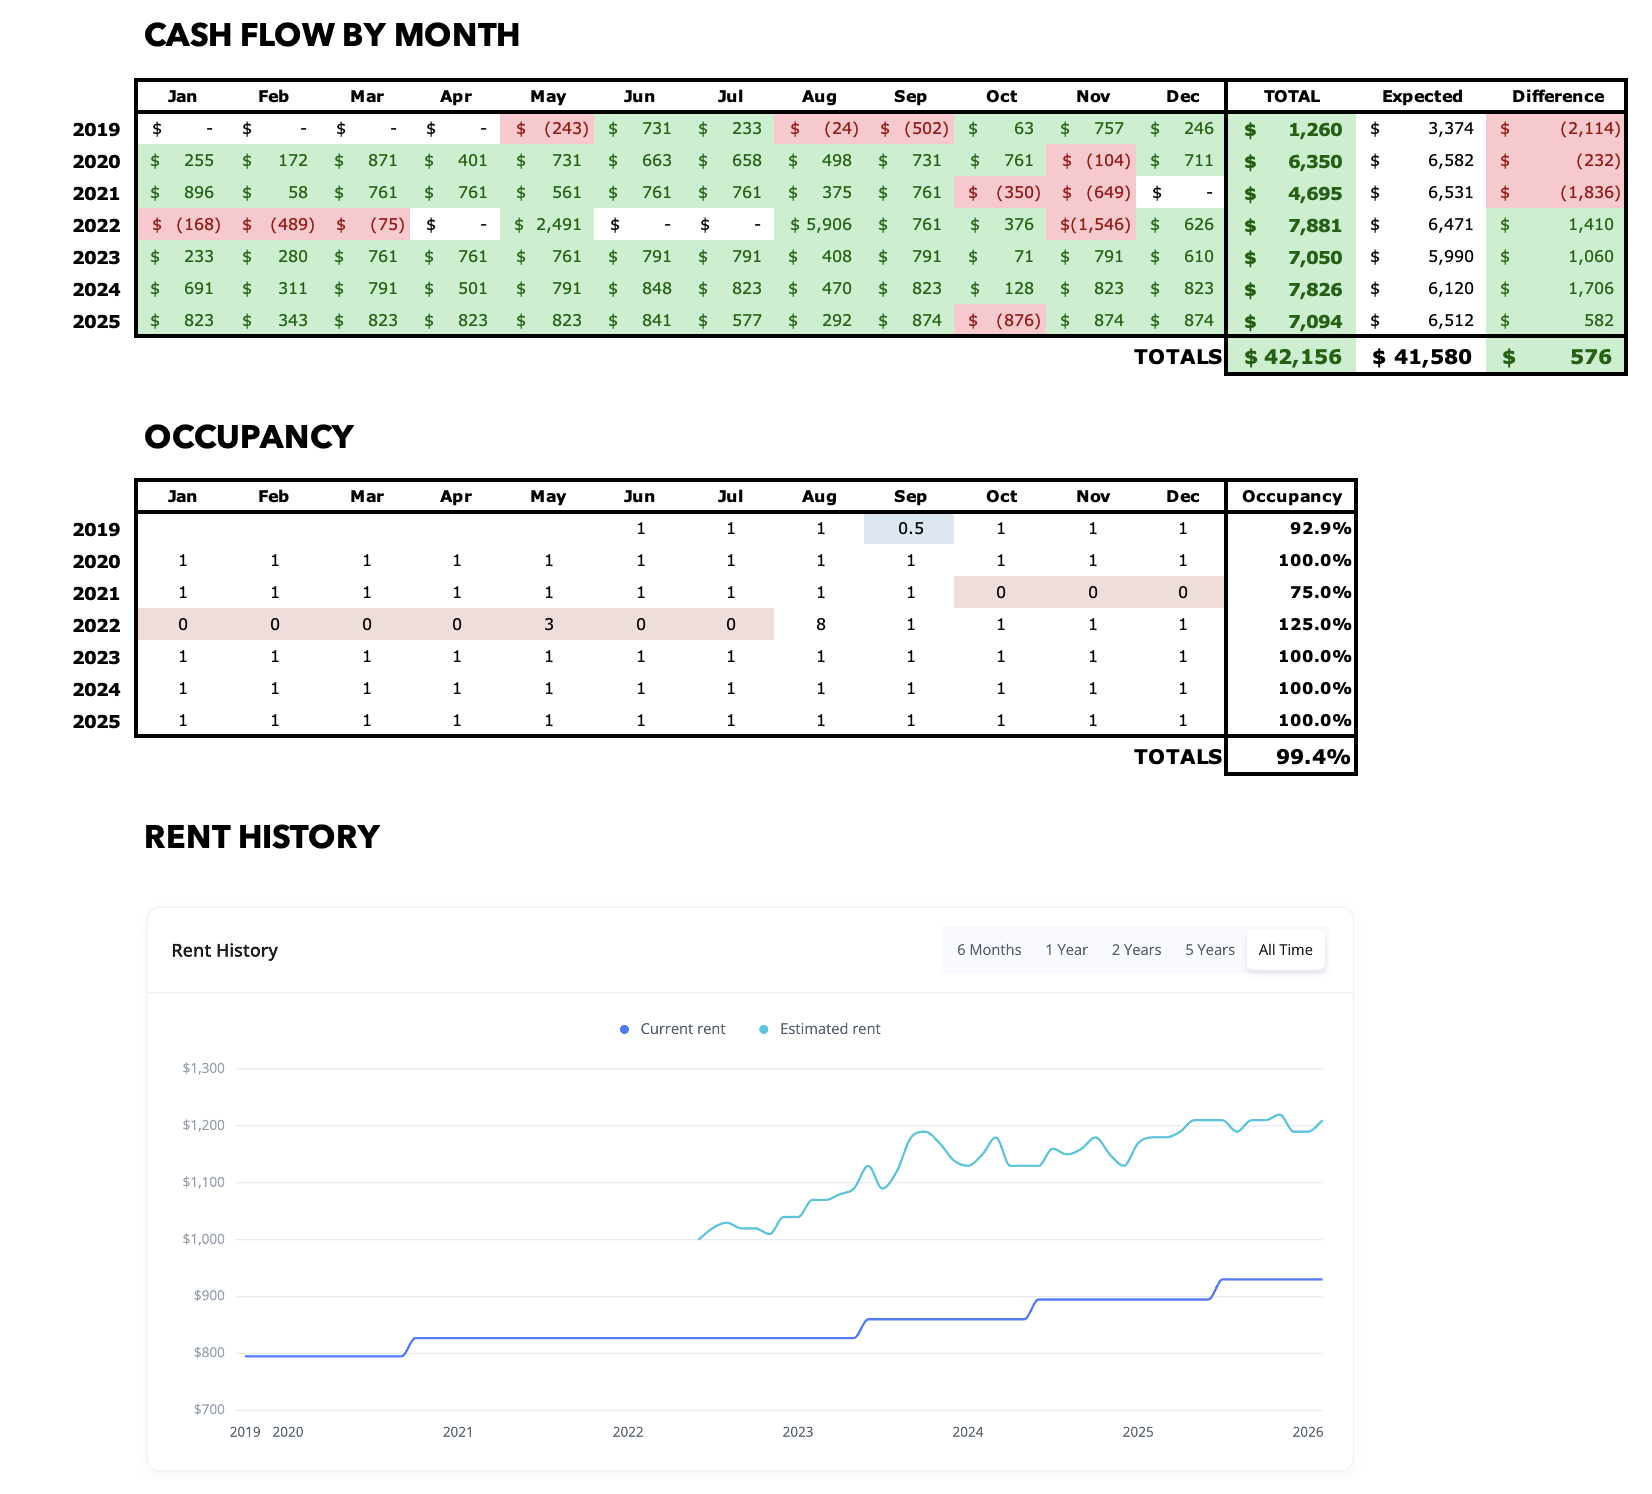
For all Property Spotlights, I come back at the end of each year to provide a brief narrative of what happened at the property that year. I also update my annual and cumulative figures for the property, including cash flow, equity growth, and occupancy.
2019
Unfortunately, the tenant submitted their notice to vacate about a month after I closed, which meant I had a turn right out of the gates. The tenant would abandon their lease a few months early; I agreed to waive the early termination fee if they paid through their residency and left the home in good shape, which they did. Fortunately, the turn costs were quite low at ~$1,300, because the tenant had only been in the home less than one year, and I still retained the security deposit of $795 due to the lease break.
I was able to re-rent the house quickly at the same rent ($795mo.), so the financial impact of the vacancy was small. I still managed over $1,200 in cash flow for the year, though this fell short of my initial estimates by ~$2K.
2020
Quiet year that met expectations. Maintenance costs were low at ~$700 for the year, with no major issues. The tenant renewed their lease at a new rent of $827/mo. Cash flow for the year was over $6K, meeting expectations.
2021
Another quiet year at this property, with only $300 of maintenance expenses. But the tenant ran into payment problems in the fall, and stopped paying rent altogether in October. We filed for eviction in early November, but the courts were very backed up due to the pandemic, so I knew it might take a long time. (See 2022…)
Because of the non-payment, cash flow for the year fell a bit short of goal, but was still a healthy $4,700.
2022
While I waited for a court date to evict the tenant, my PM also worked with local rent assistance agencies that might be able to help. We received 3 months’ of rent in May, and then a deal came through in August to receive all the remaining back-rent if I canceled the eviction (giving the tenant a fresh start), which I was more than happy to do. Big win win!
I had some larger repairs this year, including $1,300 for a roof repair and ceiling patchwork in the kitchen. Still, because I actually collected EXTRA rent this year, my cash flow was nearly $8K, beating projections by $1,400.
2023
The tenant had been month-to-month, just in case they ran into more payment issues, but when renewal time came in the summer, I thought it was time to get them back on a normal lease. They signed a 1-year lease at $860/mo. This was significantly below market rent, but because of the previous payment issues, I wanted to take a slow and steady approach and avoid a turn.
I had to replace the breaker box, a $1K capex item. I also had ~$700 of other repairs. Cash flow for the year was strong, at just over $7,000.
2024
The tenant’s situations now seems stable. They pay rent each month, usually on time. The tenant renewed once more at $895/mo. (still way below market rent, but I’m OK with this for now.) The tenant has now been in the property over 5 years.
Maintenance costs were super low, just a few hundred dollars for the year, allowing my cash flow to balloon to $7,800. My cumulative cash flow on the property since 2019 is remarkably close to projected figures — I’m only $6 short!
2025
The same tenant renewed for another year with a small increase to $930/mo. This is still significantly below market rent. But the tenant now pays on time nearly every month, a big change from a few years ago. Avoiding turns is a big win, so I’m content to continue with small rent increases each year.
Another $7K+ in cash flow for the year, and regular maintenance was less than $1K: repairing & repainting the kitchen ceiling, and installing a condensate drain pump for my HVAC. I also spent $3,105 on Cap Ex by installing new tub and shower surround (which looks great!)
About the Author
Hi, I’m Eric! I used cash-flowing rental properties to leave my corporate career at age 39. I started Rental Income Advisors in 2020 to help other people achieve their own goals through real estate investing.
My blog focuses on learning & education for new investors, and I make numerous tools & resources available for free, including my industry-leading Rental Property Analyzer.
I have also served as a coach to over 100 private clients starting their own journeys investing in rental properties, and have helped my clients buy millions of dollars (and counting) in real estate. To chat with me about coaching, schedule a free initial consultation.