2023 Annual Portfolio Checkup

It’s that time of year again: let’s take a look back at a full year of results in my rental portfolio, and see how things are going!
This is such an important discipline for rental property investors. A lot can be obscured in the short-term swings of the business, so only by looking at a full year, and seeing patterns over several years, can you begin to see the big picture and learn from it.
That’s why I go through this exercise each January. It takes a long time, but part of me quite looks forward to it (that’s the analyst in me.) I want to stay connected to my key metrics, and distill learnings that might otherwise be lost in the day to day. And as always, you have the chance to peek over my shoulder, see what I see, and learn what I learn through this process.
This will be the fourth installment of my Annual Checkup, covering my cumulative numbers for 2023. (You can check out the previous years here.) It will follow a similar format as in previous years, including the following elements split into two large sections:
A Financial Results
A1 Cash Flow vs. Projected Cash Flow
Review of Maintenance & Repair Costs
Rate of Rent Increase
A2 Change in Equity
True Appreciation
Mortgage Paydown
Capital Expenditures
Total Change in Equity
A3 Total Returns (Cash Flow + Change in Equity)
B Tenancy Results
B1 Occupancy Rate
B2 Tenant Turns
Frequency
Duration
Cost
Also according to past precedent, I will only include in this analysis those properties that I owned for the full calendar year — so the numbers will include for the first time these five properties that I purchased in 2022:
But Property #25 will be excluded, because I didn’t close on it until early in 2023.
Also note that I’ve updated each property’s annual results (or, at least those for which I’ve created blog posts) in the Property Spotlights section of my blog. Scroll down to the bottom of each post to see the annual figures since I purchased each property.
Alright, let’s get into it, and bring my full year’s results into focus!
A Financial Results
Evaluating my total financial results over the year will help me to answer questions like these:
Did my cash flow meet expectations?
Were maintenance & repair costs in line?
Was I successful in raising rents?
How much did my total home equity increase (or decrease)?
What were my Total Returns on the cash I’ve invested?
The answers to these key questions will provide insights into my property manager, the state of the real estate market, and of course my properties themselves.
A1 Cash Flow vs. Expected Cash Flow
Let’s start by looking at cash flow. It’s what I care about most, and it’s why I got into rental properties in the first place. When it comes to my rental properties, cash is king.
The goal with my investments was always to maximize my cash-on-cash returns, because that’s what created more freedom and flexibility in my life, including the freedom to quit my lucrative but soul-smushing corporate job. Many investors who are chasing financial freedom have the same goal cash flow goals. Appreciation of home prices is nice, but as I’m fond of saying, you can’t buy groceries with home equity. So it’s critical for me to understand if my portfolio is producing the cash I’m expecting it to.
I model my expected returns ahead of time, so that I know how much cash my properties SHOULD produce. This kind of model is frequently called a pro forma. For my modeling, I use the RIA Property Analyzer (and you can, too, because I make it available as a free download!) This tool quickly calculates an expected average monthly cash flow, after all expenses are accounted for; it also calculates an expected rate of cash-on-cash returns.
When I put together the numbers for my portfolio in 2023, and compare them to the pro forma model, here are the results:

Overall, my properties generated $104K in cash flow, which was about $9K better than expected. This translates into a cash-on-cash return of 10.4%, notably better than the 9.5% pro forma. Overall, then, this was one of my best cash flow years to date.
As I do each year, I need to pause for a moment here to explain why these numbers do not perfectly align with my December monthly update, which showed I fell a few hundred dollars short of my cumulative cash flow expectations for the year. Notice that the actual cash flow in both places is the same — about $104K — it’s just the expected cash flow that’s different. In other words, my expected annual cash flow in this yearly analysis is ~$9K less than the sum of the monthly expectations as outlined in my monthly reports. This discrepancy is caused by two factors:
Most of this difference is due to mid-year rent increases. When I calculate the “expected cash flow” for each property in the table above, I’m using the rents as they were in January 2023. So when a property’s rent increases during the year, this results in a small “bonus” vs. the expected annual cash flow. Conversely, in my monthly updates, rent increases are immediately incorporated into my expected monthly cash flow. Therefore, the sum of those monthly pro formas exceeds the annual pro forma for any property where the rent increased mid-year. I don’t store the pro forma cash flow values by month by property, so this isn’t something I can solve for. (And in fact, I think it’s just as reasonable to do it this way.) As we’ll see later, there were several properties that had significant rent increases this year, so this accounts for ~$7K of the difference between the two measures.
A smaller portion of this difference is due to new properties that get included in the monthly updates, but are excluded from this annual summary. I bought Property #25 in the first few months of 2023, and was expecting positive cash flow for the year. Cash flow ended up neutral for the year at that property, but by excluding this property from my annual numbers, I lop off over $2,000 of expected cash flow from my total. So this accounts for ~$2K of the difference.
Another question that observant readers might have: why did my cash-on-cash expectations go down this year versus last year? In 2023, I was modeling a 9.5% CoC return, whereas in 2022 I was expecting 10.1% CoC. While cash-on-cash will naturally increase over the life of a property (because rent and expenses go up while the mortgage stays the same), this small lift was counteracted by a specific change I made last year at this time: I upped my expectations for what I’d pay in maintenance and repairs, reducing my expected cash flow. I discussed this change, and the reasons for it, in the 2022 annual report.
The results at the individual property level varied, but followed the normal pattern that I’ve seen in previous years: most individual properties exceeded their pro formas. If a property does not experience a turn or vacancy during the year, this is a bonus vs. the model, which plans for a 5% vacancy rate — so unless there are significant maintenance expenses, that property is likely to end up in the green. This was true for 16 out of my 24 properties last year.
The biggest problems houses this year were those where I experienced a turn or vacancy, which is also typical:
Property #22 missed its target substantially, and had cash flow of negative $7K on the year. (Ouch!) This was due to a vacancy and costly turn, which was not all bad news. As I discussed in my monthly updates this year, the tenant was way below market rent and not amenable to an increase. Therefore, the turn allowed me to get the property up to standard, and place a market rate tenant at $1200, vs. the previous rent of $825, which sets me up wonderfully for this property going forward.
Property #4 also had a big miss this year, and also had negative cash flow. Another turn here explains the cash flow miss.
Property #18 missed its target as well, though it still had positive cash flow of over $5K. I had a turn at this property as well, but it was only one side of a duplex, and the turn costs were relatively low — so my cash flow was somewhat spared.
Other properties had small misses due to higher-than-expected maintenance costs — or, in the case of Property #14, the highly unusual mid-year rent decrease. (It would have been much worse had the tenant vacated, which is what I was trying to avoid by lowering the rent.)
Review of Maintenance Costs
The biggest variable component of a rental portfolio’s expense structure is maintenance & repair costs. Across all 24 properties, my model budgeted for $36,176 in maintenance & repairs. The actual number came in a bit higher, at over $42K. As has been typical for me, turns (aka Rent Ready expenses) were a big driver of those costs:

Despite this overage, I’m still reasonably confident in my expense budgets going forward. Here are the reasons why:
Last year, I made a change such that I’d use 1% of the current value of the home as my annual maintenance budget, rather than leaving that budget tied to the original purchase price. I’ll continue to do that going forward — though, as we’ll see later in this report, the value of my properties didn’t change much in the last year.
I’m nearly through my “first turns” at my non-turnkey properties, which are the ones that have been most expensive. I continue to think that my average turns will be less expensive in the future — where I’ve experience “second turns”, they tend to be relatively cheap (i.e. <$5K), whereas first turns can easily exceed $10K. Turns have been a bit cost drive for me in the last few years, and that will always be true to some extent — but I think it will somewhat less true in future years.
Rate of Rent Increase
I also like to look at how much I was able to increase rents in the course of the year. Rents must increase to make properties profitable in the long run. Why? Because all costs other than my mortgage — such as property taxes, insurance, and repairs — are certain to go up over time, so rents need to (at least) keep pace with those increasing costs.
In my portfolio, my property manager is responsible for leasing vacant properties, and renewing existing tenant leases. Therefore, the rate of rent increase is really a way to measure how well my PM has managed rents across my portfolio — though of course it also reflects larger market forces.
With inflation falling back to typical rates of late, I’m lowering my rent increase target back down to 2%. (I had increased it to 4% in 2021 and 2022, due to higher inflation during those years.) Two percent may not sound like a lot, but it’s the figure I always use when modeling long-term returns for a property.
So — did I meet my 2% target last year? Here’s a look at where my rents were in January 2023, and where they are now a year later:

Overall, rents across these properties increased 4.6%, which easily exceeds the 2% inflationary target. This is much less than last year (10.2%) but very much in line with results in 2020 and 2021 (3.4% and 4.6%, respectively.)
A typical rent increase is ~4%, but there are a few notable exceptions to point out here:
Larger increases were achieved in some properties, but we only ask for this in cases where the tenant is significantly below market rent.
Several properties had no change in rent. This can sometimes be due to a 2-year lease, but in two cases (Property #13 and Property #16), we froze rents because the tenant was already at or above market rent.
As already discussed, we dropped the rent for the tenant in Property #14 in an effort to prevent a vacancy.
The huge increase at Property #22 was due to the newly placed tenant paying much more than the previous tenant who vacated.
A2 Change in Equity
While cash is king in rental property investing, appreciation is still part of the equation. Particularly when using leverage, small increases in home prices can mean big returns — you capture all the appreciation, even if you’ve only put 20% or 25% down on the house. You also get the paydown of mortgage principal on those properties, yet another way to create positive returns.
On the flip side, capital expenses must be considered in this section as well. As I’ve argued before, capital expenditures are not true expenses, and are better understood as increases in the cost basis of the home; therefore, capex reduces your appreciation, not your cash flow. Here is where that reduction in appreciation will come into play.
Let’s look at each of these pieces that are part of the equity calculation — true appreciation, mortgage paydown, and capex — and see where those numbers landed in my portfolio last year.
True Appreciation
This one is pretty simple: how much did the value of each home increase in the last year? I track home values using the Zillow Zestimate, which has its flaws but it is nonetheless a straightforward way to see changes over time, and takes my own personal bias out of the equation.
This year, after three consecutive years of of double-digit increases, home prices were relatively flat. Let’s compare my home values now to where they were a year ago:

Overall, my home values decreased by about 1% last year. This doesn’t do much to blunt the huge cumulative increases we’ve seen since the pandemic, and my equity gains are still substantial.
I said last year at this time that I wouldn’t be surprised to see negative numbers in this section in 2023. I was correct, though these decreases are quite muted. Prices may continue to float downward in 2024, but if interest rates fall further (as I expect they will), that could bring more buyers into the market and provide upward price pressure. We’ll have to see how it shakes out.
Several individual properties had double-digit increases or decreases, and I don’t have great explanations for those jumps. The two largest increases (Property #2 and Property #19) are in the same general neighborhood, but the other property in that zip code (Property #17), had a decrease. It’s just the vagaries of using the Zestimate for this purpose — but again, it’s probably as good as anything else, and the overall picture is both accurate and useful.
Mortgage Paydown
Home equity also increases each month on leveraged properties due to the loan principal slowly being paid off. This is the portion of rental property returns that is pretty much guaranteed — and as a bonus, it accelerates over the life of the loan.
Here’s a picture of the reduction in loan balances I experienced in 2023, which added another $24K to my annual returns (you’ll notice that four of the properties have no mortgages):

It sure is nice to see your loans melt away over time! This is one of the numerous reasons why conventional mortgages are your precious “golden tickets”!
The percent reduction of each loan is a function of the loan’s interest rate: the higher the interest, the lower the percent paid off. The maturity of the loan also matters; because mortgage payoff accelerates over time, older loans (mostly toward the top of this list) tend to have larger payoff percentages than the newer loans at the bottom.
Capital Expenditures
While I have MORE equity due to appreciation and mortgage paydown, I have LESS equity due to capital expenditures, which increase the cost basis of the property — in other words, they increase my cash invested into the house.
My capital expenditures for last year were just over $22K. That’s a tick higher than last year, but given that there are five additional properties in the analysis this year, it’s actually less per property. Here is the annual trend in CapEx:
2020: $10,882
2021: $16,915
2022: $21,772
2023: $22,468
Here’s how the 2023 capital spend breaks down:
Property #2: $10,274 for a new roof and new LVP flooring
Property #4: $2,267 for new LVP flooring in the bedrooms
Property #9: $1,066 for a new electrical breaker box
Property #22: $8,861 for a new HVAC unit, new LVP flooring throughout the entire home, and a new gas stove (purchased as part of the new tenant’s leasing deal)
My CapEx continues to be in a reasonable range. Investors use various methods to estimate and budget for capital expenditures. Some assume a percentage of the value of the properties each year, typically 1%. Others prefer to use a percentage of rent, usually 8% or 10%. Some prefer a fixed dollar amount per month per unit, such as $100.
Using each of these three methods yields slightly different values, but all of them are above what I spent last year — which indicates that my CapEx in future years is likely to be somewhat higher:
1% of home value: $3.6M x 1% = $36,000
8% of rent: $330K x 8% = $26,400
$100 per unit per month: 25 x 12 x $100 = $30,000
Total Change in Equity
Now let’s put all of these pieces together — appreciation, mortgage paydown, and CapEx — and calculate the total change in equity for the year:

In dollar terms, then, my total change in equity was -$30K. Let me also explain the two percentages I calculated here:
Equity ROI: Compares the total change in equity to the value of the property at the beginning of the year.
Equity RoC: Compares the total change in equity to the total cash invested into the property.
Said a different way, my total equity across these 24 properties fell at a rate of -0.8% relative to their value at the start of the year, and at a rate of -3.1% relative to the amount of cash I have invested in the properties.
For the first time since I’ve been publishing these annual reports, the results here are mediocre. But that’s fine — it couldn’t go gangbusters forever! I’ve locked in such large gains that even a few years of small price decreases wouldn’t make a dent. Of course, increasing equity in my properties isn’t my main focus or goal — rather, it’s cash flow — and I therefore treat these long-term equity-building effects of rental property investing as “icing on the cake”. There’s been plenty of icing in the last few years, and as long as home prices keep up with inflation in the long run (which they always do), I’ll meet or exceed my long-term projections.
A3 Total Returns
To calculate total returns, we’re simply going to add together the cash flow and equity portions that we’ve already calculated. Total returns is an important number — particularly your rate of total returns on cash invested — because that’s what you would mentally compare against other types of investments. For example, the stock market has historically returned ~10% total returns (before adjusting for inflation); if your rental properties are yielding total returns on cash of 10% or more, then you can assume that you’re beating the stock market. (Yes, I know that doesn’t include real estate transaction costs, taxes, and other factors — but my epic Stocks vs. Rental Properties article contemplates ALL those factors, if you want to dive deep into that perennial debate.)
Anyway, here’s what my Total Returns look like for 2023, putting together all the numbers that we’ve looked at so far:

Here’s how I calculated the three rate-of-return metrics above:
Total ROI: Compares Total Returns to the value of the property at the beginning of the year.
Total RoE (Return on Equity): Compares Total Returns to my total equity in the property at the end of the year.
Total RoC (Return on Cash): Compares Total Returns to the total cash invested into the property.
Or said a different way, my Total Returns across these 24 properties were equal to 2.0% of their value at the start of the year, 3.4% of my current equity in the properties, and 7.3% of the amount of cash I have invested in the properties.
This year, unlike in the past, my cash flow drove nearly all of my total returns. And that’s just fine. Though this year’s numbers look very different from the past few years, changes in home value don’t really mean much for me in the short-term. Sure, equity gains are nice, but far more important to me is that the portfolio continues to meet its expected rate of cash returns, which provides the foundation for the financial and work freedom that I currently enjoy.
B Tenancy Results
The second large section of the Annual Checkup will be a close look at tenancy — specifically occupancy rate and tenant turns. While these factors influence the financial results that we’ve already calculated and reviewed, it’s important to break them out separately to understand them — just as the variable costs of maintenance & repairs can make or break a property’s financial results, so can your ability to keep your properties occupied with quality tenants.
Or, more accurately, your property manager’s ability to do so. Because my PM is fully responsible for keeping my properties occupied with strong tenants, this entire section is largely a reflection of their degree of success with this critical task.
B1 Occupancy Rate
This key metric is simply a measure of the percent of the time that your properties are occupied. (Just as often, the inverse metric, Vacancy Rate, is used — but I like Occupancy Rate better, simply for psychological reasons. It just seems more positive, right?) In my expense modeling, I always use a 5% vacancy factor (assuming 95% occupancy), because I know that some percentage of the time I won’t be collecting rent on properties, such as when they are being turned between tenants.
So the question here will be: did my portfolio exceed the 95% occupancy goal that I budget for?
Calculating vacancy rate is pretty simple. Each combination of a month and property (i.e. October at Property #5) is a slot to be potentially filled — this serves as the denominator of the fraction. The number of slots that were, in fact, occupied, is the numerator. For example, if you owned two properties for a full year, that’s 24 “tenant month” slots; if the first property had no vacancy, and the second property was vacant for one month, that’s 23 out of 24 tenant months occupied. So your occupancy rate would be 23 divided by 24, or 95.8%.
One quick caveat: I count a property as occupied if I’m collecting rent on it, whether or not a tenant is actually living there. For example, in a lease break situation where I retain a 1-month security deposit after the tenant moves out, I count the property as occupied for that additional month. Conversely, if a tenant IS in place but I’m never able to collect rent for that month, then I count the property as vacant. This aligns with my pro forma modeling, which does not budget for vacancy in the strict sense of the word, but instead for months where rent is not collected.
Using this math across my 2023 portfolio, here’s what we find:

In total, these 24 properties maintained an occupancy rate greater than 97%. This is a very solid result that is better than my modeled expectations.
Blue highlights indicate periods of a tenant turnover. As you can see, I had four turns in 2023, which I’ll discuss in more detail in the section below.
Red highlights indicate evictions. I had two evictions last year that overlapped in late summer. The financial impact of this was mitigated thanks to my PM’s willingness to reimburse me for lost rent during the eviction at Property #20 — that’s why you see the “6” in the table in October. This was a tenant they had recently placed who defaulted after only a few months, so they stepped up to make me mostly whole. (Ongoing relationships with your PMs matter a LOT!)
B2 Tenant Turns
Turning properties between tenants is a big driver of cost in any rental portfolio. They’re costly in several different ways: not only do you have to pay for the work to get the property ready for the next tenant, you’re also not collecting any rent during that period. (To add insult to injury, you also have to pay for utilities and lawn care during the turn!)
Proper management of tenant turns can therefore be a critical way to ensure the success of rental property investments. There are three primary objectives when it comes to turns, and they’re all worth monitoring in my annual checkup. In a perfect world, I want turns to be:
Infrequent. By screening tenants properly upfront, providing them with a quality home, and responding professionally to any issues they’re having, my PM can make it more likely that tenants will stay longer, which decreases the number of turns I have to do in any given year.
Short. If turns must occur, I want them to be as short as possible. This is a measure of how efficiently my PM can complete the rent-ready work, and get a new tenant in place.
Inexpensive. If the home was maintained properly during the tenancy (by both the tenant and the PM), and if the property was up-to-standard beforehand, then turns should be relatively cheap; if not, they can get quite costly.
Let’s see how well I achieved those three turn objectives in 2023.
Frequency
How often should you expect to turn a property? The less the better, of course — but I want my tenants to stay at least 3 years, on average. This means that in any given year, I should expect to turn less than a third of my properties. We’re examining 24 properties in 2023, so turning 8 properties would have been an average year by this standard.
Instead, I only turned 4 properties — #4, #18, #20, and #22. This is lower than anticipated, and continues a trend that I observed in the last three years. This indicates that my tenant “churn” has been much slower so far than my baseline expectations, which is great news for my occupancy rates and overall performance of my portfolio.
Duration
Were those four turns performed efficiently? Let’s take a close look at them:

This is a mixed bag. In general, I’d say that any turn completed in less than 30 days is a huge win, and anything under 60 days is great. Only when the turn stretches into its third month would I start to become concerned.
Last year I called out that my PM’s took too long to delivery the SOWs to me — that was better this year, as the SOWs were all approved within a week of the tenant vacating.
This year, the issue with my longer turns was leasing. Ideally, you want a lease signed as early in the process as possible — this can even be done before the rehab work is complete. But with the turns at Properties #4, #18, and #20, it took many weeks after work was complete to get a tenant in place, which explains why those turns clocked in between 60 and 90 days; not disastrous, but not great. This suggests that perhaps I should price the rentals a bit more aggressively to ensure more interest from prospects — with any vacant home, time is money, so taking a little less in rent to get a tenant in faster may be a profitable trade.
Cost
I expect a typical turn to cost between $2,500 and $5,000 — any turn under $2,000 is cheap, and one that exceeds $5,000 is relatively expensive. Here’s a glance at the four turns I did in 2023, and their costs:

As we’ve already seen, turns were a major driver of my maintenance expenses in 2023, just as they were in previous years. This is normal.
But the pattern of “first turns” being more expensive continues to hold: the two High cost turns were both first turns, whereas the other two were “second turns”. First turns are more expensive because I have get them up to standard in certain areas, which is normal if the property was purchased occupied with tenants, or if it was not a full turnkey property when I bought it.
The good news is that I only have a handful of “first turns” left in my portfolio. Hopefully this means that my turn costs will moderate going forward, with more “Low” and “Medium” cost turns, and fewer of those expensive turns that put noticeable dents in my cash flow.
Conclusion
Finally, here is the dashboard for my portfolio in 2023, incorporating all the key areas and metrics we’ve reviewed in this article:
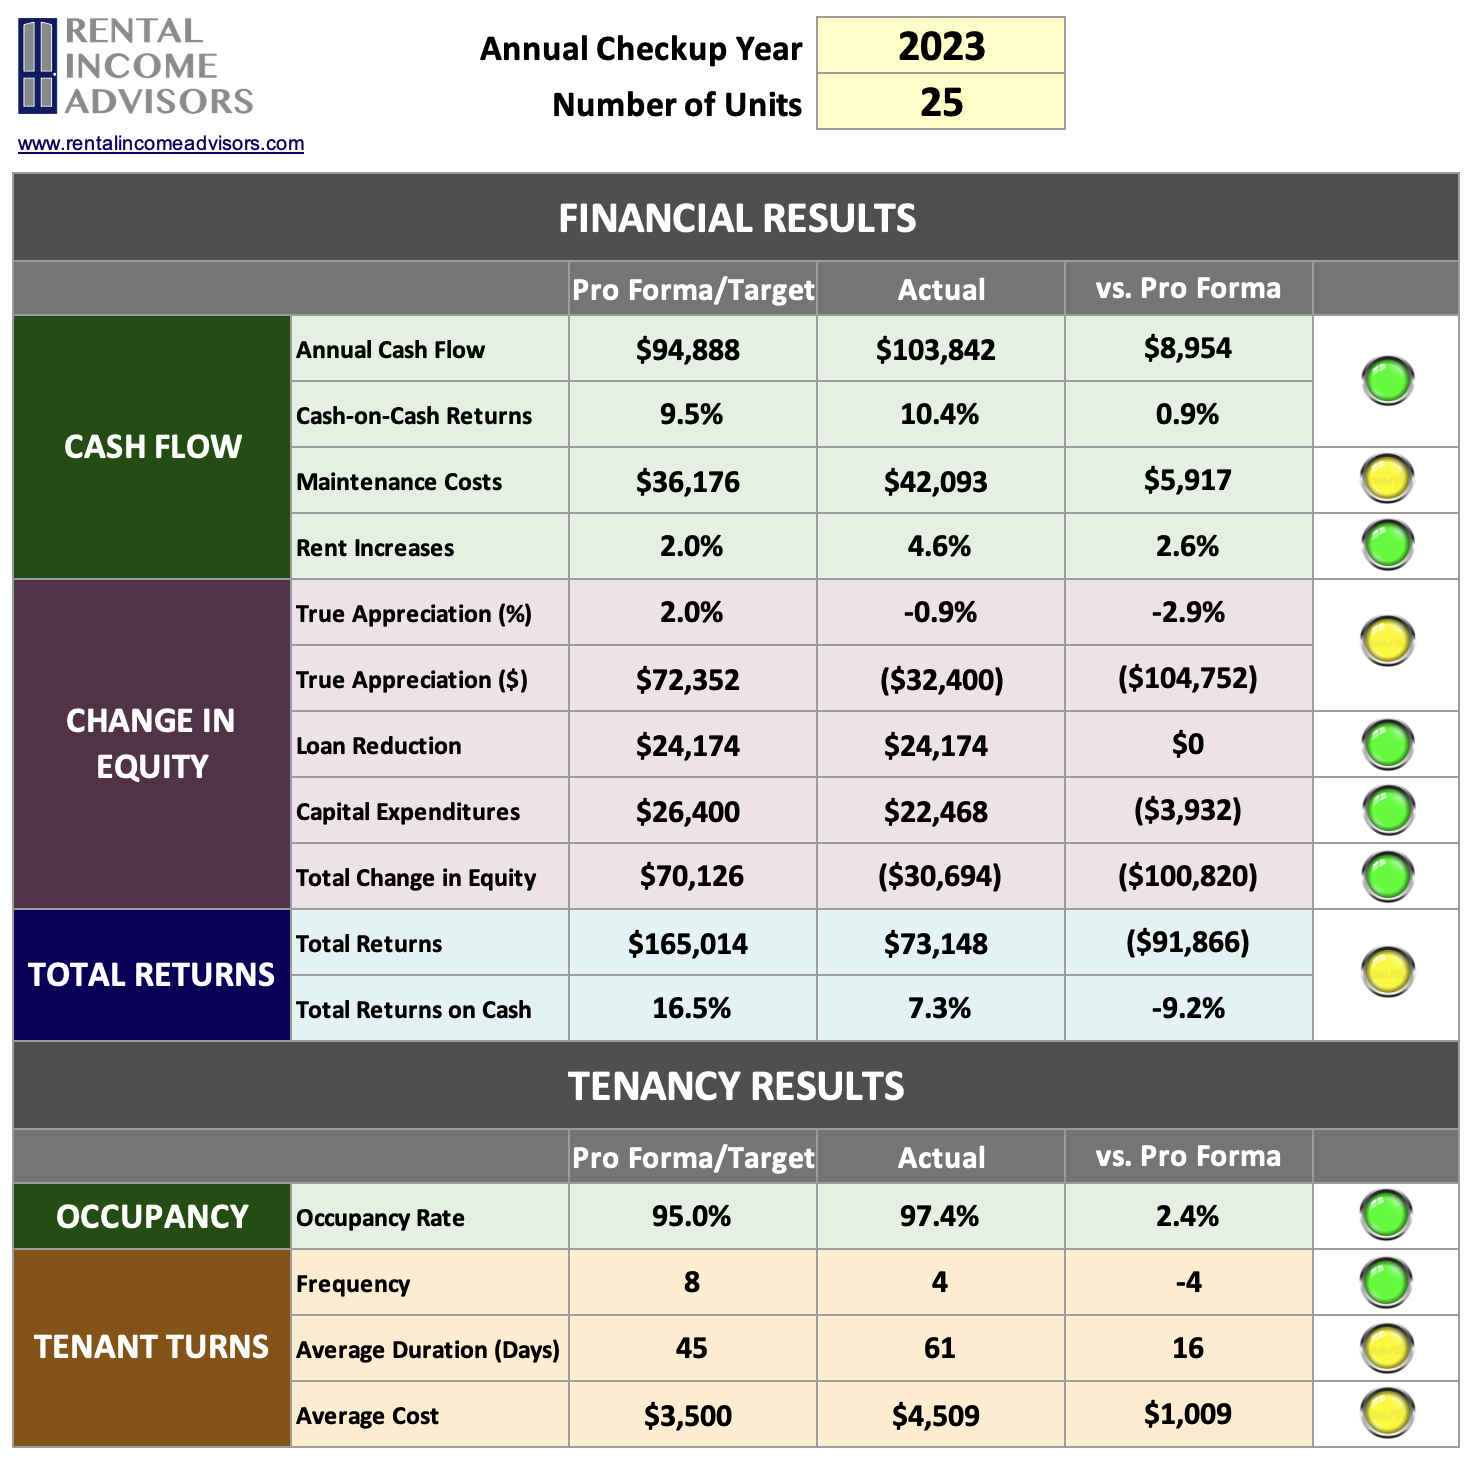
Here are my key takeaways from this annual checkup:
Overall, it was another good year. I exceeded my cash flow targets, which is the most important thing. I had expected price appreciation to cool off, which it did — and that may be the case for several more years, which is no bother.
My cash flow model is sound. The portfolio is producing the cash that it’s supposed to, which gives me confidence to continue to project my future returns using the same set of assumptions.
My property managers are getting the job done. From occupancy rate to rent increases to management of turns, my PMs have been reliable stewards of my portfolio. I’ll continue to work with them to tweak areas that need attention (i.e. leasing timelines to fill vacancies), and ask for accommodations when appropriate — but overall, they are delivering.
Maintenance expenses were a bit high, and costly first turns continue to be a driver of expense. My hope is that this will moderate somewhat in the years to come, as I get through the few remaining “first turns” in my portfolio.
CapEx was pretty low, and could be higher in future years. Given the current size of my portfolio, I wouldn’t be surprised to see about $30K in CapEx per year, rather than the ~$20K I’ve experienced the past two years.
About the Author
Hi, I’m Eric! I used cash-flowing rental properties to leave my corporate career at age 39. I started Rental Income Advisors in 2020 to help other people achieve their own goals through real estate investing.
My blog focuses on learning & education for new investors, and I make numerous tools & resources available for free, including my industry-leading Rental Property Analyzer.
I also now serve as a coach to dozens of private clients starting their own journeys investing in rental properties, and have helped my clients buy millions of dollars (and counting) in real estate. To chat with me about coaching, schedule a free initial consultation.