Memphis Rental Property #8

Last updated: 2026
NOTE: While this article was published in 2025, the house was bought six years earlier, in 2019. Check out the Annual Updates section at the end of the article to see how the property has performed since then.
Let’s move on to Property #8 in my Memphis portfolio! This one, like all my properties between #3 and #16, were purchased at a dead sprint in the months of May to September of 2019 shortly after I left my office job, sold my primary residence, and used the proceeds to invest in a portfolio of cash-flowing rental homes.
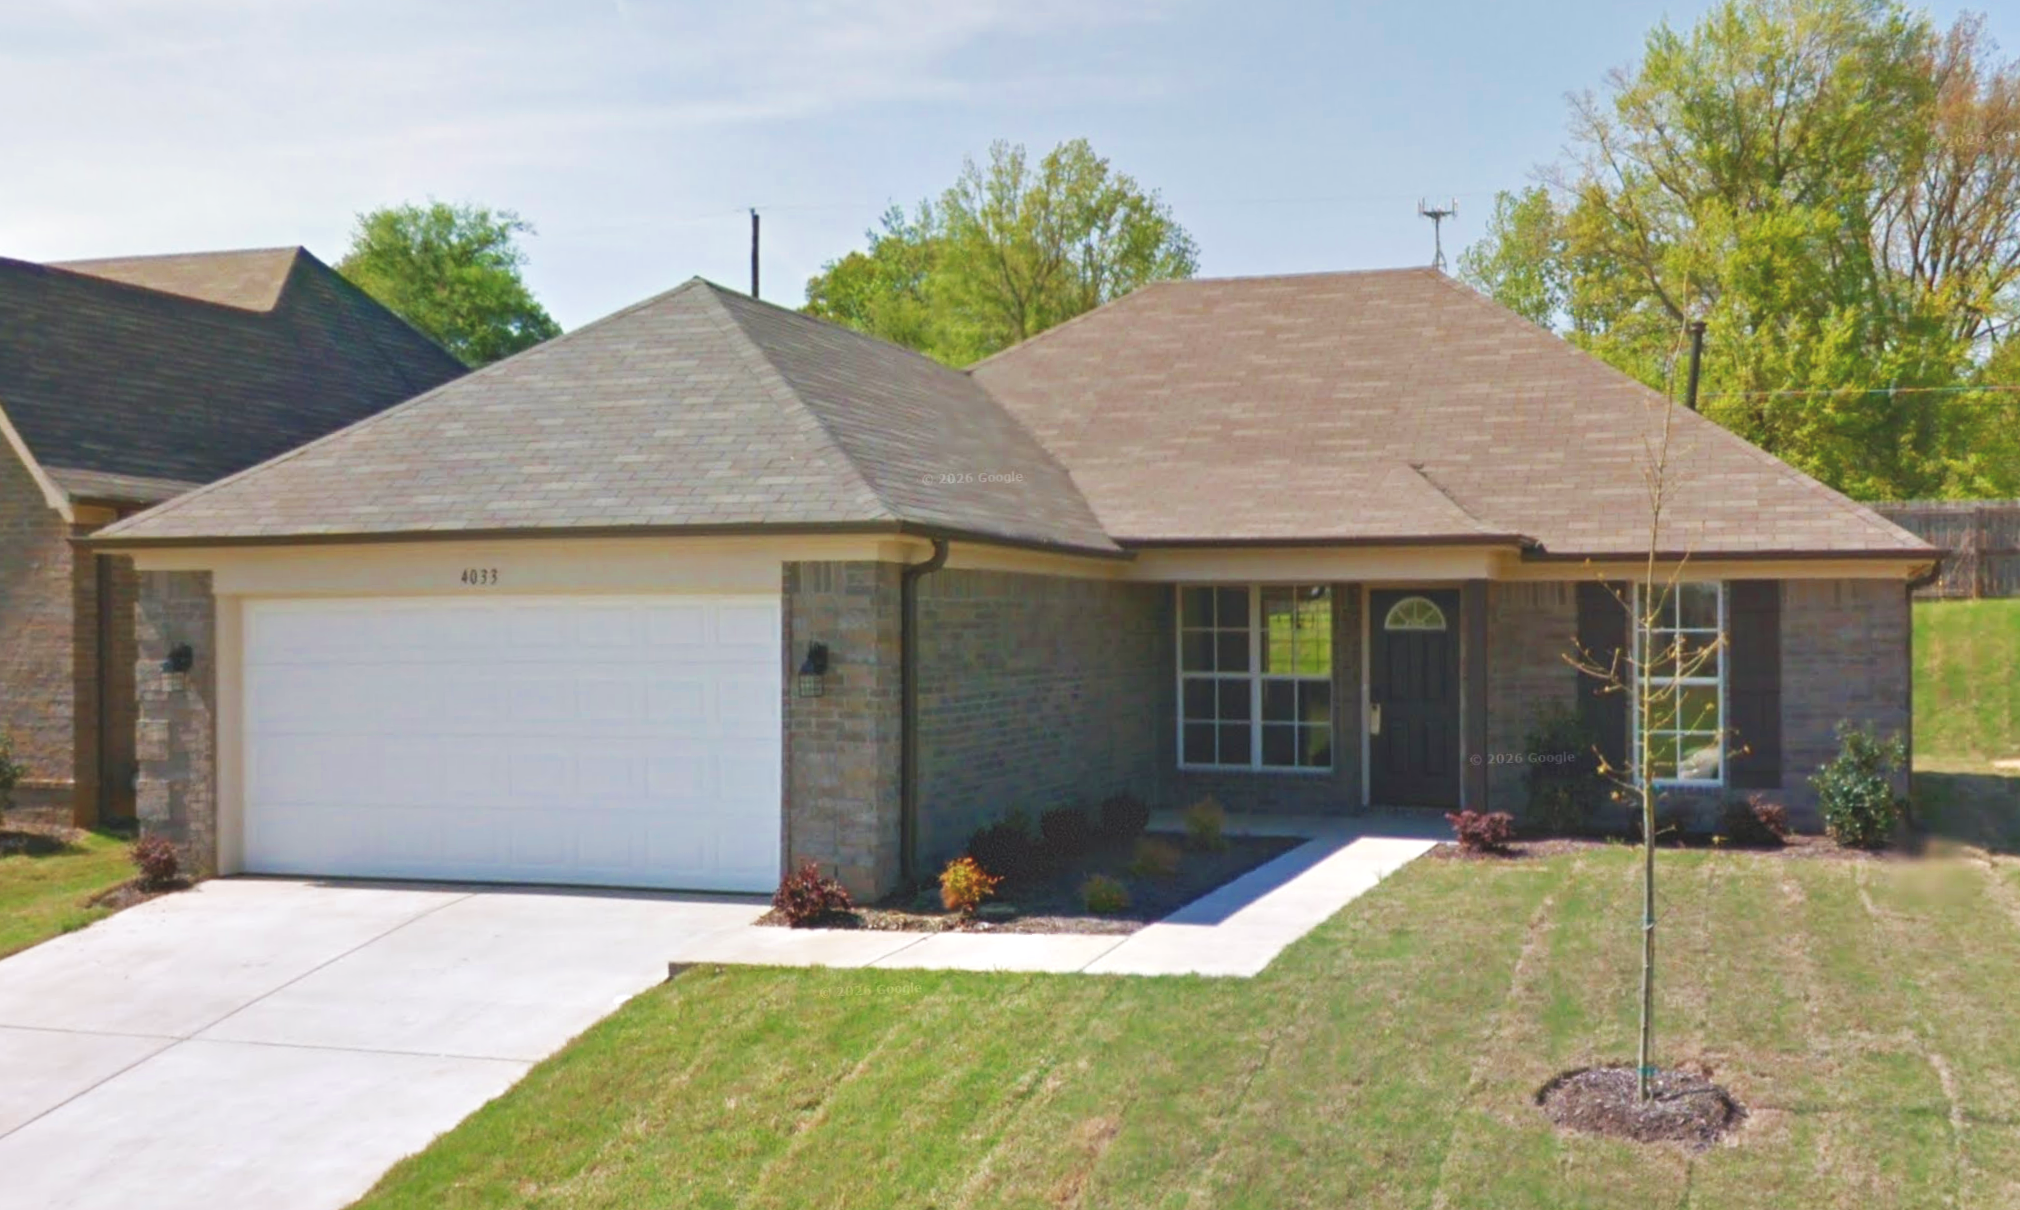
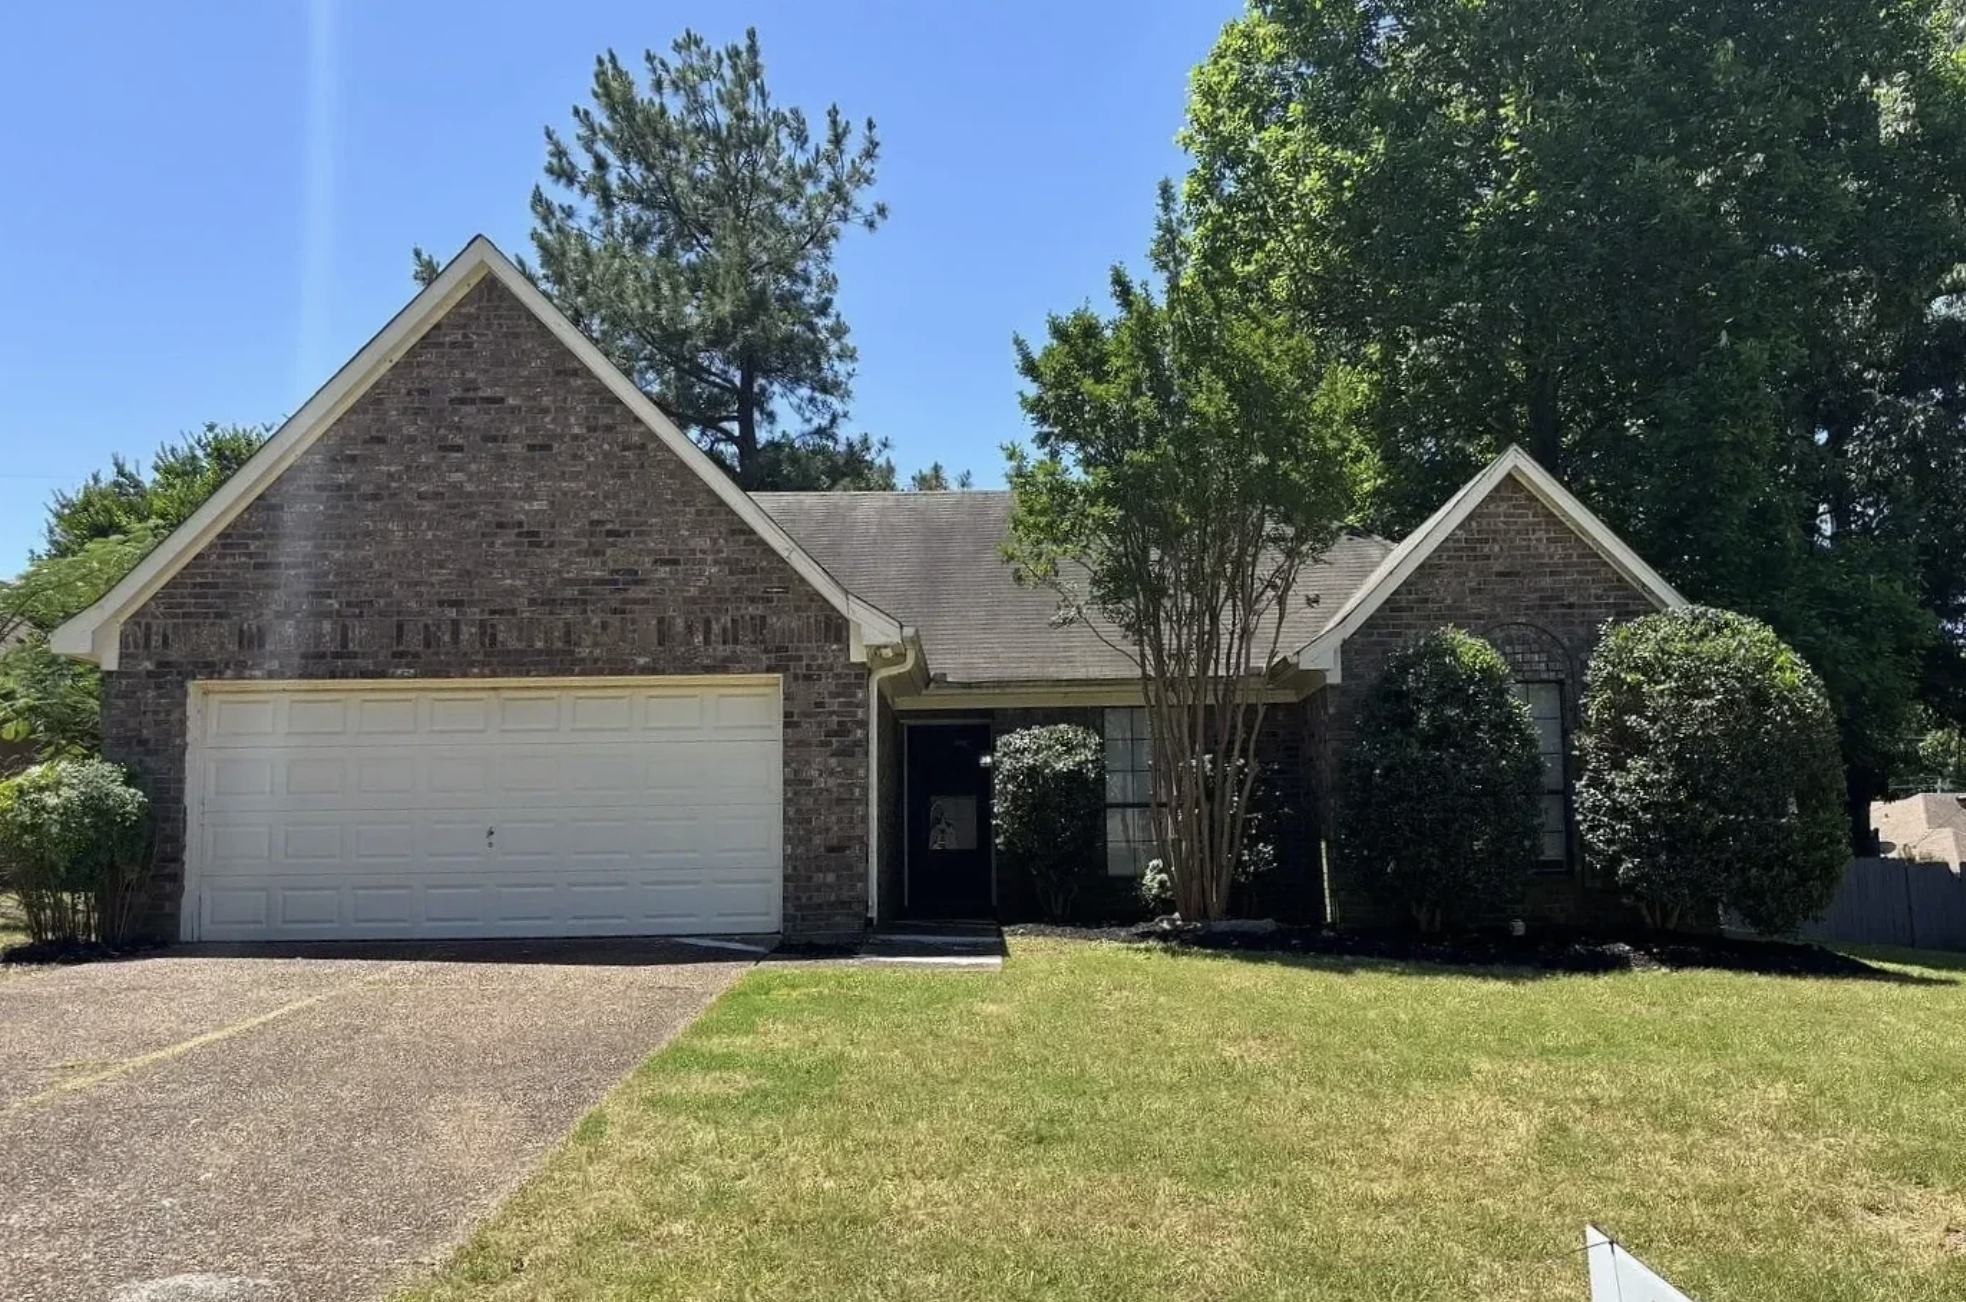
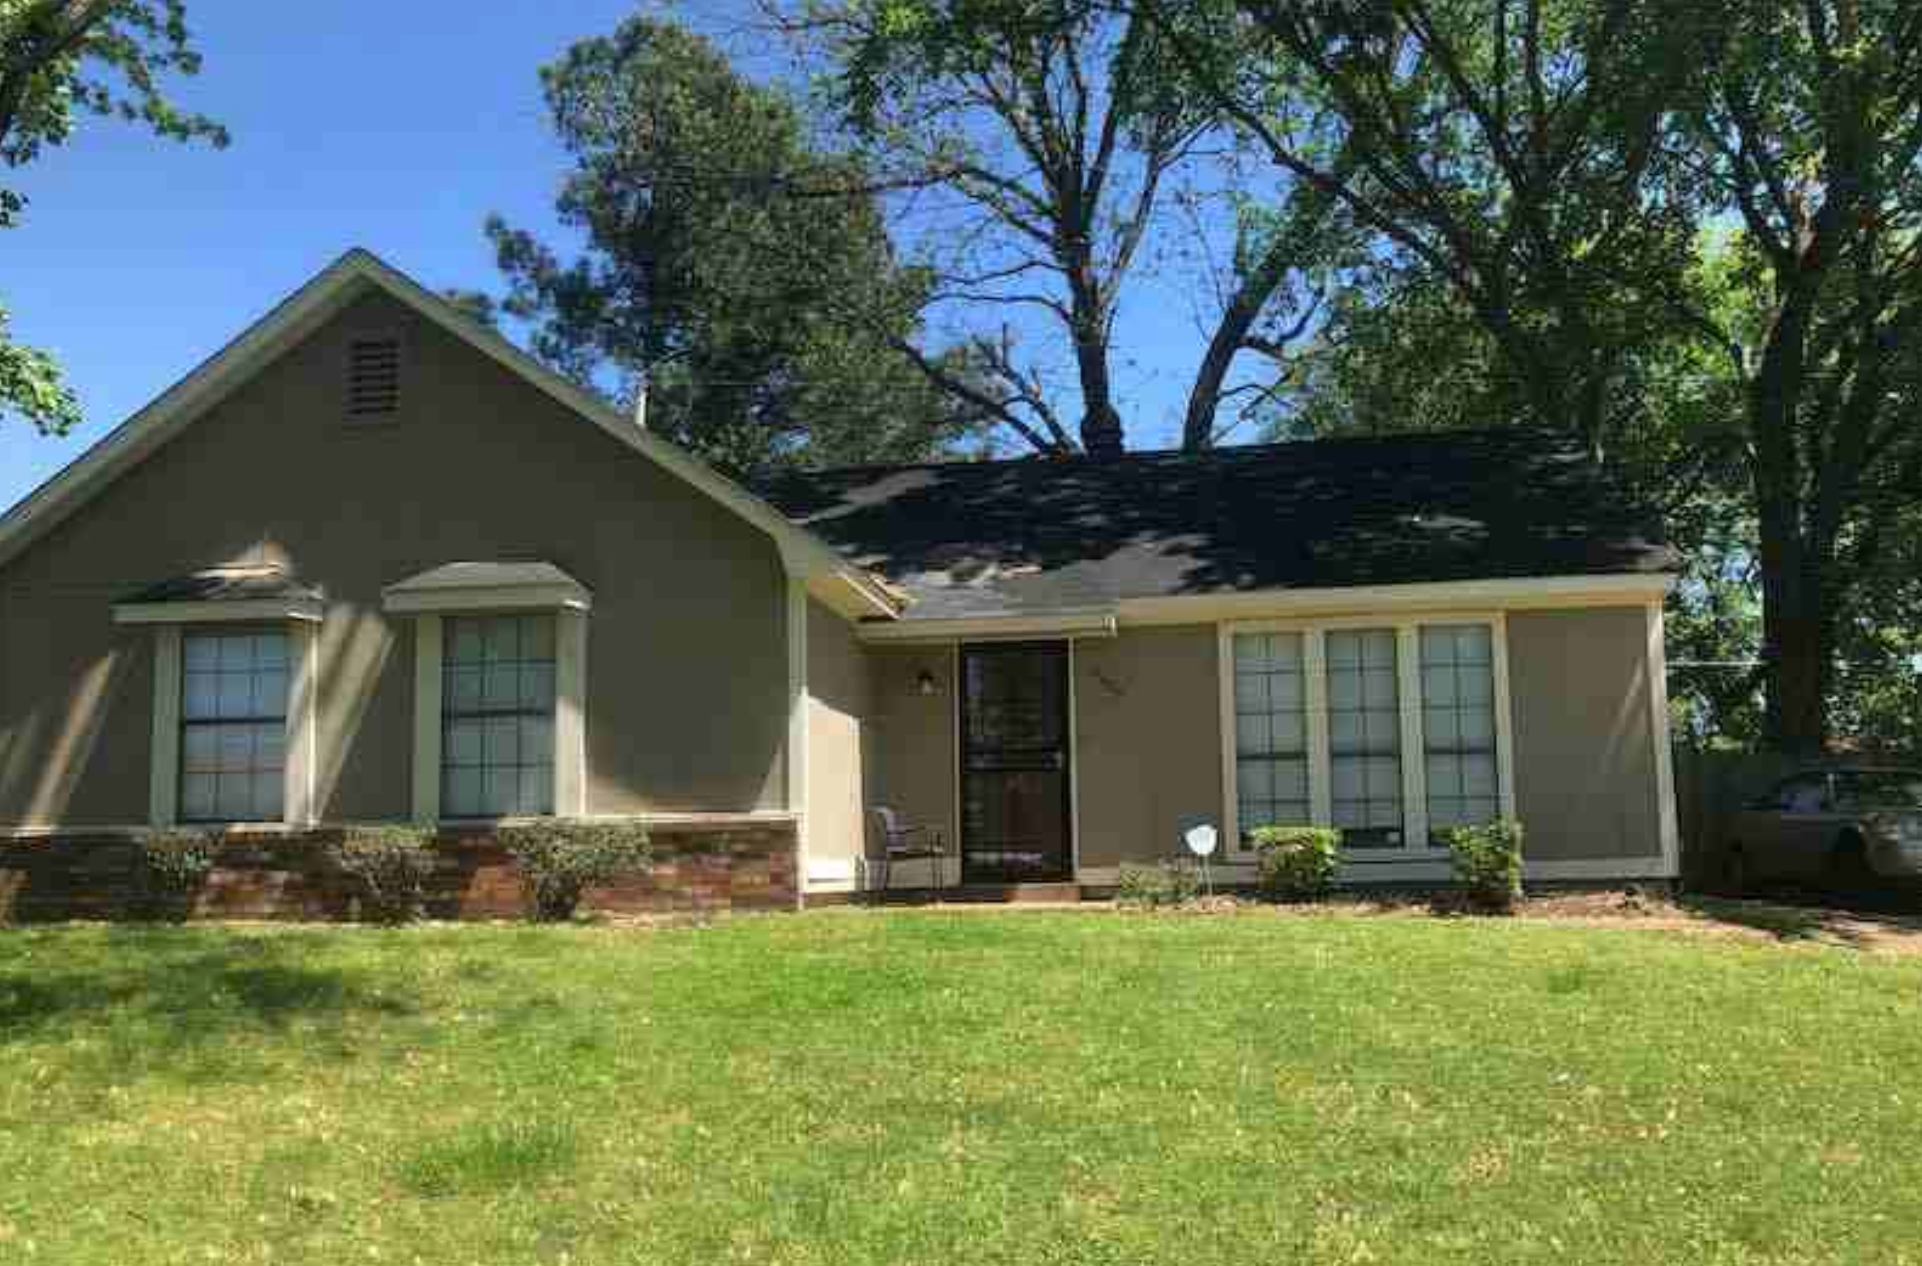
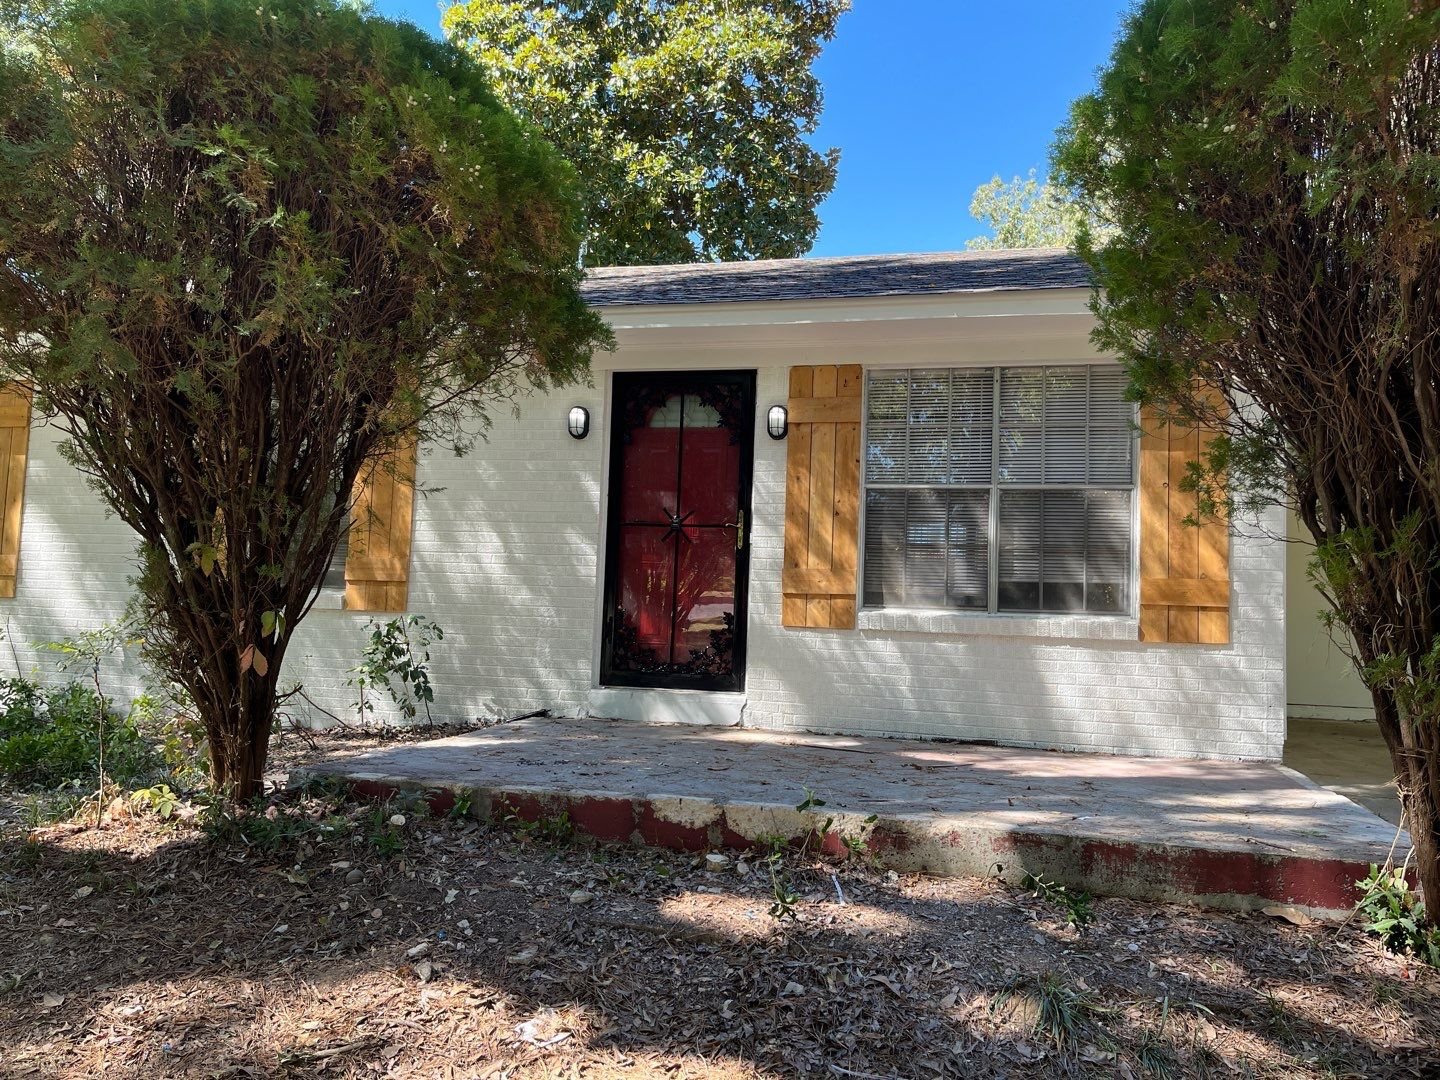
This is one of the newest and nicest homes in my portfolio, in a very desirable B/B+ neighborhood. It’s part of a small development of “half lot” single family homes — they’re not townhomes, but they’re much smaller homes and tighter lots than the surrounding neighborhoods, which I actually love for rentals because they’re simpler. These homes were all built between 2004 and 2015.
Despite it being one of my best homes, I still had an eviction right out of the gates, just a few months after I bought it! Just goes to show that there are no guarantees with rental properties, even in nicer areas.
Alright, let’s take a closer look at this house and deal!
Property #8: The Deal
This was another house that I found on Roofstock. As I’ve mentioned in previous Spotlights, Roofstock was a new platform at the time with some nice features, but they’ve gone in a different direction since I bought these homes, and not a good direction in my opinion — so much so that I don’t recommend Roofstock to my private coaching clients anymore, since these days it’s really no better or different than shopping for homes on Zillow.
The house was being offered at $153,000, and had a tenant in place at $1,150. This is a relatively poor price-to-rent ratio, but I calculated market was somewhat higher at ~$1,250, so I had some room for rent increases. Plus it’s a quality home in a good area, and I was willing to give up a little cash flow to get it — I think having a mix of neighborhoods and price points is a good idea in any portfolio.
Also, this house had a particular financial advantage: it sits in an “unincorporated” area of the Memphis market, meaning it is only subject to Shelby County taxes and is exempt from any city taxes. This saves me about 50% on the taxes I’d otherwise owe on this property.
Through the Roofstock platform, I initially offered $143,000. After a few back-and-forths with the seller, we settled on a final price of $147,000.
Because of the relatively high purchase price (at least compared to the other houses I was buying at the time) I chose to put the minimum 20% down in order to preserve my capital for other properties. The interest rate on my loan was 4.75%. (Those were the days!)
Here are some facts about this particular house:
3-beds, 2 full baths
In the 38125 zip code (the only house I own in that zip)
Built in 2005
Central air
1459 square feet of interior space
Tenant in place paying $1,150/mo.
Attached 2-car garage (in back of house)
Property #8: Due Diligence
One of the nice things about Roofstock at the time (which, like most of those nice things, is no longer the case) is that they performed an inspection report on each home they listed, so it was visible to everyone on the listing page BEFORE you made an offer. In this case, the inspection was quite clean, though some of the major cost centers were original to the 14-year-old home:
The roof was in good shape, but 14 years old (~25 year life expected)
HVAC and furnace were also 14 years old (~20 year life expected)
The water heater had been recently replaced
Carpets in bedrooms would have to replaced on the first turn
Everything else looked great, and the tenant kept a nice home based on the photos
The tenant had originally moved in at the end of 2016. Their last renewal was in November 2018, at a rate of $1,150/mo. The tenant ledger and payment history was perfect except for one returned payment in early 2019 — a bit of a caution flag, to be sure, but nothing that I considered a deal-breaker. (Spoiler alert: perhaps I should have thought about this differently, because the tenant ended up defaulting on their rent just a month after I bought the property, leading to an eviction. More on that in the Annual Updates below.)
The house appraised at $160K, $13K above the purchase price, and we proceeded to closing in July 2019.
Here are some photos of the property to give you an idea what it looked like — definitely one of the nicer ones I own!


Property #8: The Financials
As already mentioned, this was one of the newest, nicest, most expensive homes I purchased as I built out my portfolio — so we'd expect ROI to be a bit lower on a house like this. I used the RIA Property Analyzer to run the final numbers on this property, both for the current rent at the time of purchase ($1,150) and what I believed market rent to be ($1,250) – here are the key metrics that the analyzer calculated for me:

Purchase Price: $147,000
Monthly Rent: $1,150 / $1,250
Monthly Cash Flow: $72 / $160
Cap Rate: 5.60% / 6.32%
Cash on Cash Returns: 2.67% / 5.86%
Total ROI 2% Appreciation: 17.02% / 20.22%
(Want to use this calculator? You can!)
OR
Using the multi-year model in the RIA Property Analyzer, we can visualize some of the main long-term trends assuming a long-term inflation rate of 2%. Even with a somewhat lower initial rate of cash returns on this deal, the long-term numbers still look very good:

Cash flow increases over time. This is mostly because rent and expenses are expected to rise with inflation, but one major expense (my mortgage) is fixed.
Cash Flow Year 1: $875
Cash Flow Year 10: $2,482
Cash Flow Year 25: $5,887
Mortgage paydown accelerates over time. This is because of the way banks amortize loans – each month, a little bit more of your fixed payment is principal, and a little bit less is interest.
Mortgage Paydown Year 1: $1,815
Mortgage Paydown Year 10: $2,780
Mortgage Paydown Year 25: $5,661

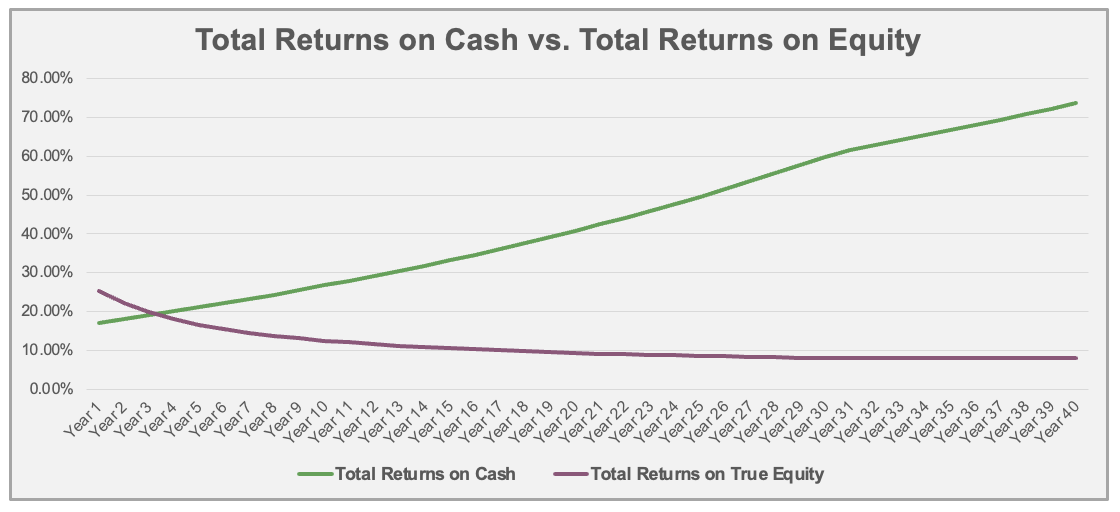
Total returns on cash increases over time. This is a consequence of the first two graphs – I will make greater total returns over time on the same initial investment of cash.
Total Returns on Cash Year 1: 17.1%
Total Returns on Cash Year 10: 26.7%
Total Returns on Cash Year 25: 49.6%
Overall, the numbers looked pretty good on this property. It was a newer home in a better neighborhood, which I figured would mean lower maintenance costs and more stable occupancy. Cash flow was definitely a little low out of the gates, but my higher leverage (80% LTV) meant that appreciation gains and mortgage paydown would drive my total long-term ROI more than in other deals.
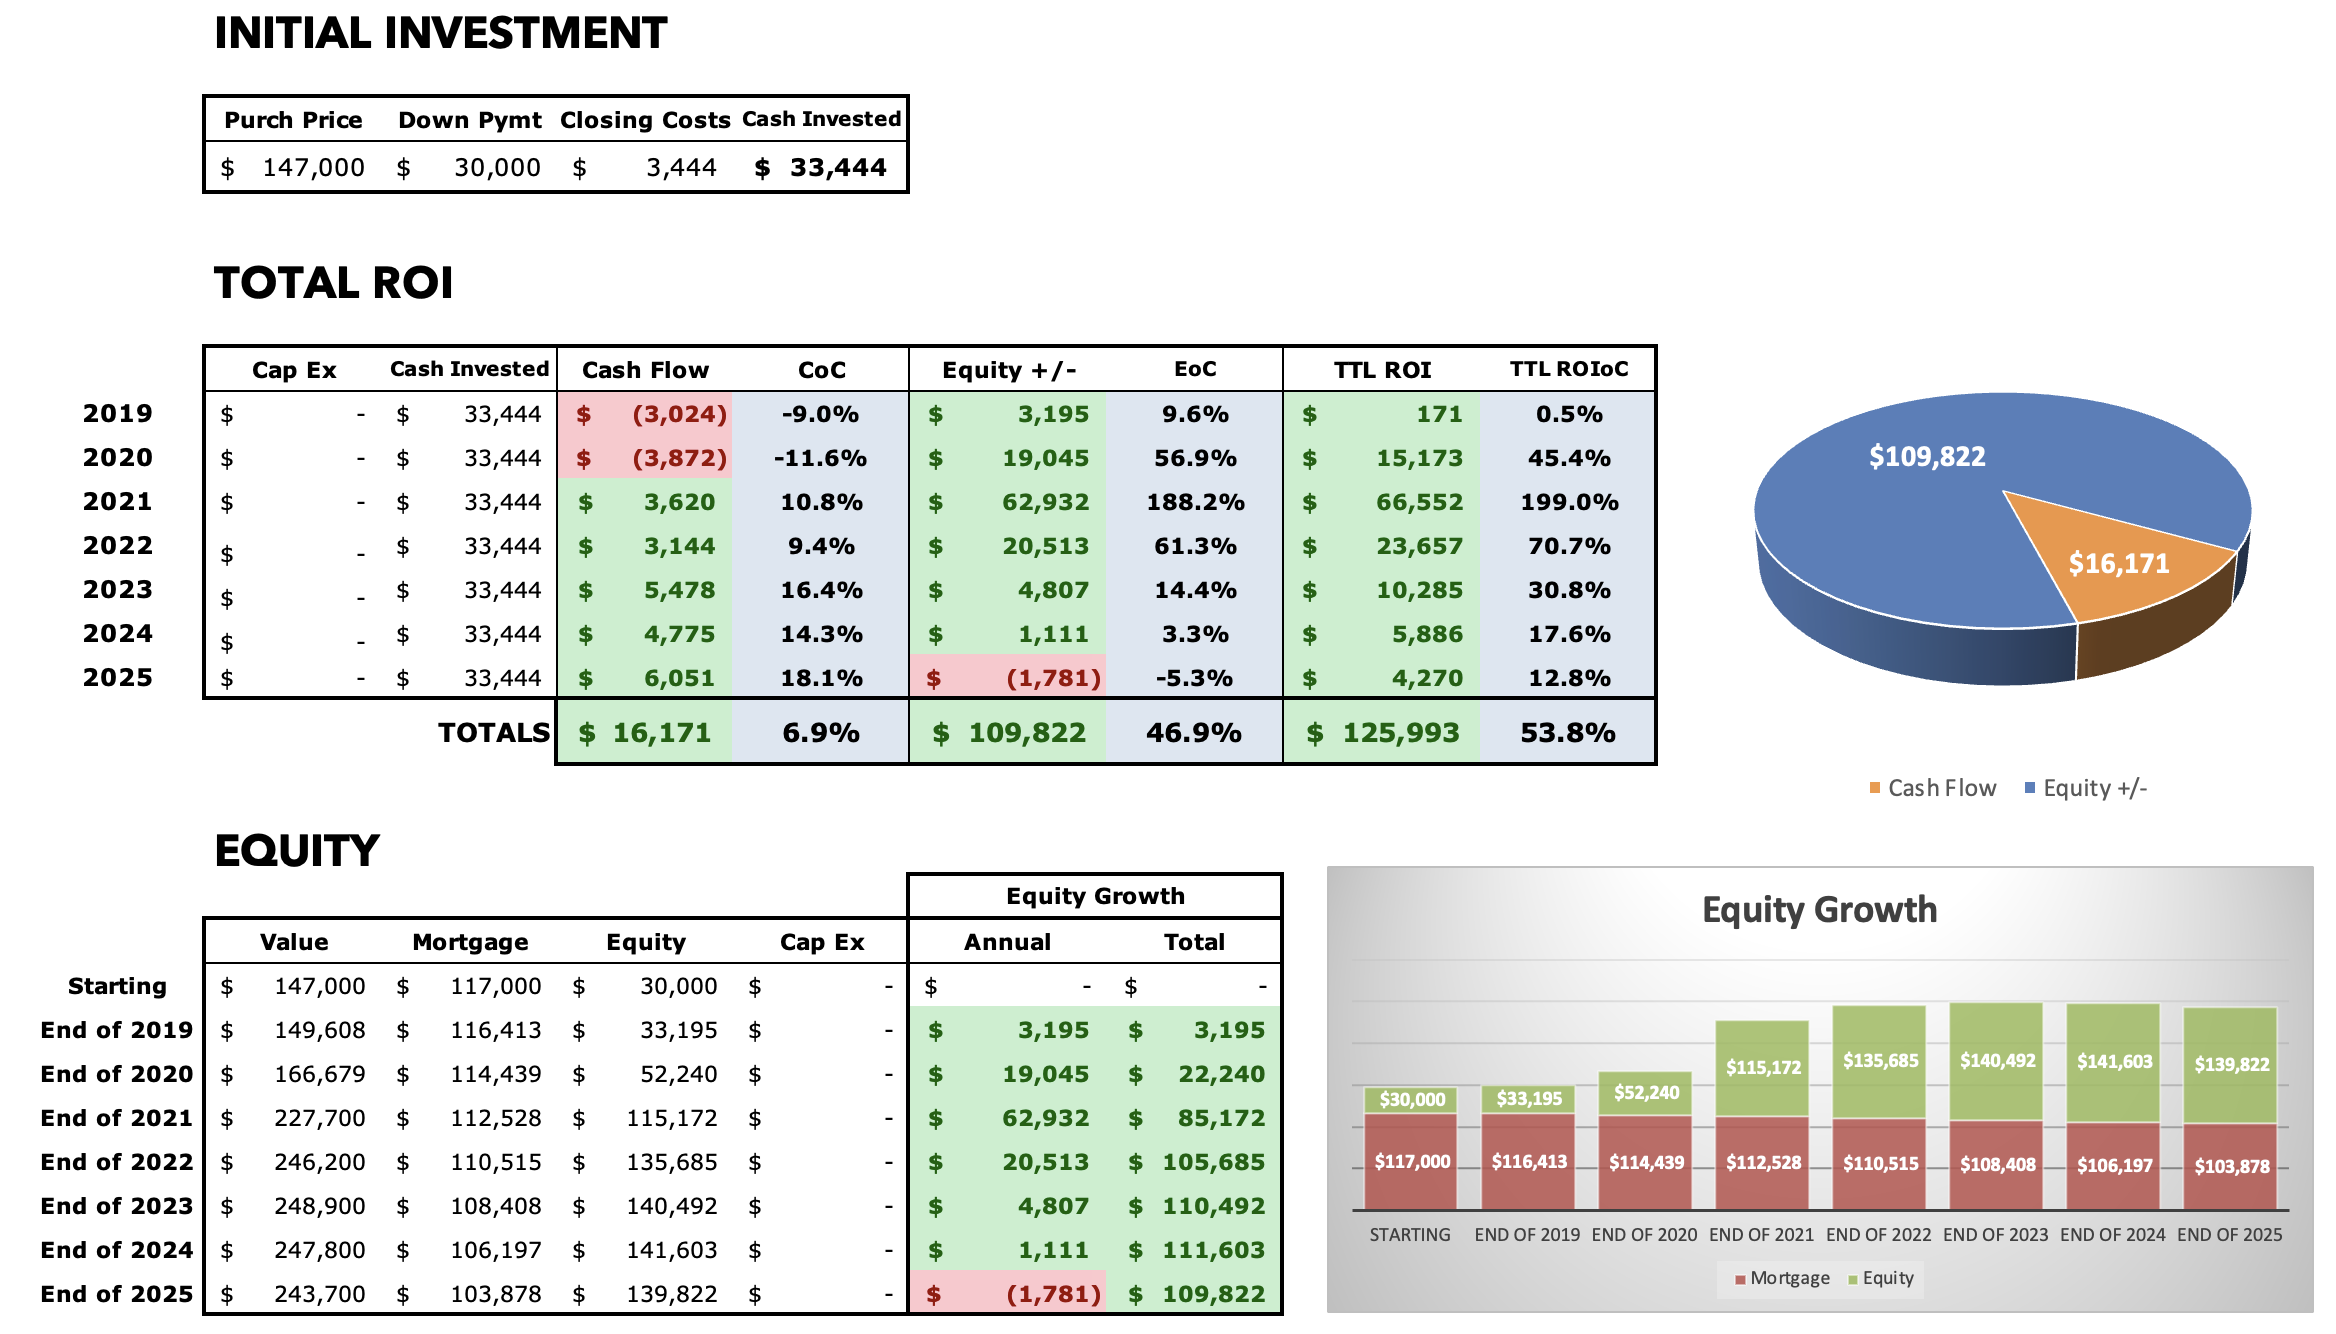
Property #8: The Deal Sheet
Finally, to sum up Property #8 and its financials, here’s the full “deal sheet”:

Looking for YOUR Next Property?
If you need help finding, analyzing, and purchasing YOUR next property — or your first one! — schedule a free initial consultation with me. I’ve helped dozens of private coaching clients invest with confidence and build cash-flowing rental portfolios of their own.
Annual Updates
For all Property Spotlights, I come back at the end of each year to provide a brief narrative of what happened at the property that year. I also update my annual and cumulative figures for the property, including cash flow, equity growth, and occupancy.
2019
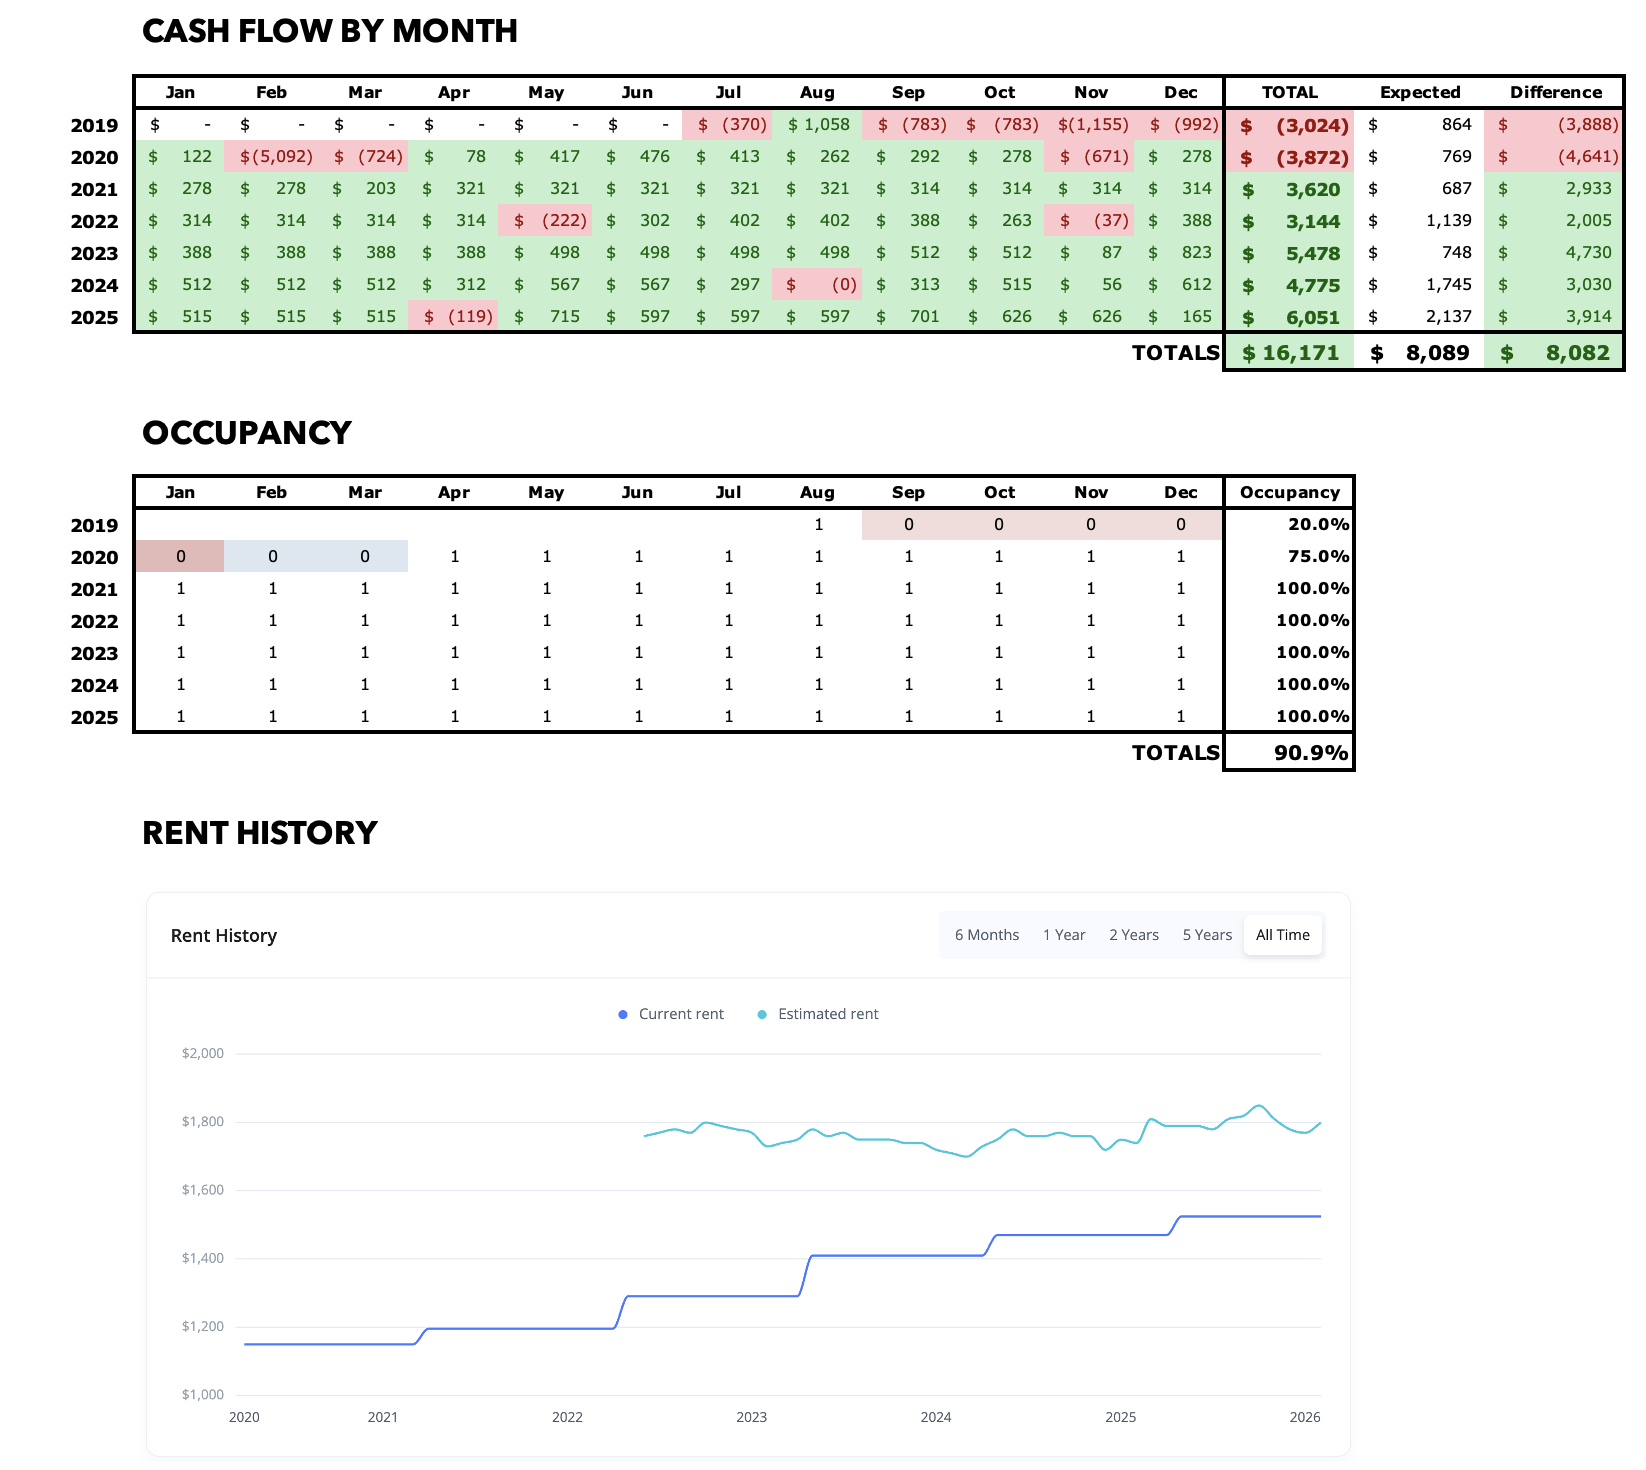
The single returned payment on the ledger of the inherited tenant turned out to be prophetic: the tenant stopped paying rent a month after I bought the house, and was ultimately evicted. In the end, I collected no rent for 7 months during the eviction and turn, which wasn’t complete until spring of 2020.
2020
I finally got possession of the house in January. The turn scope was mercifully small: just interior paint and some other minor stuff, though I also took the opportunity to put new LVP flooring in the kitchen and hallway.
The house rented quickly once it hit the market, at $1,150/mo. I chose not to go for more rent, though perhaps I could have gotten it — but I was more concerned about just getting a good tenant in there fast and stabilizing the property. The tenant moved in on April 1st, and the house was very quiet the rest of the year — but despite that my cash flow was still -$4K for the year, on top of -$3K in 2019. Not an auspicious start!
2021
Very smooth year: the tenant renewed with an increase to $1,196/mo., and maintenance expenses were essentially $0. This led to positive cash flow of $3,600, more than $3K better than my expected average.
Like most of my properties, 2021 is when I saw the biggest increases in home value estimates. This home jumped from $167K to $227K this year alone, at least according to the Zestimate (which is what I use to track home values over time.)
2022
Maintenance & repairs were again very low this year, with only one small plumbing expense. The tenant renewed again, but due to rising rents at the time, we asked for a larger increase to $1,291/mo. Cash flow was strong again at over $3K, which was $2K better than planned.
2023
Third quiet year in a row at this property. There were no maintenance calls, and we asked for another larger-than-normal rent increase to $1,410/mo, which the tenant agreed to. With rent increasing, cash flow continued to grow as well to over $5K for the year.
2024
This year, I finally incurred some material costs to maintain this home: over $1,200 of expenses to cover an HVAC call, mandatory gutter cleaning, and a costly issue with the garage door. (Those things break down quite a bit!) Still, the tenant continued into their 5th year of residency, with another renewal to $1,470/month. This is still probably ~10% below market rent, despite the annual increases.
Cash flow for the year was just under $5K, about $3K better than my pro forma.
2025
My tenant has now lived in the property since 2020, and renewed for another year at $1,525/mo. — and there is still room to raise this rent in the future, since market rent is likely $1,700-$,1800.
I spent another $600 on the garage door this year (I hate those things!) But that was the only maintenance issue, and cash flow was over $6K, my best year yet for this property.
About the Author
Hi, I’m Eric! I used cash-flowing rental properties to leave my corporate career at age 39. I started Rental Income Advisors in 2020 to help other people achieve their own goals through real estate investing.
My blog focuses on learning & education for new investors, and I make numerous tools & resources available for free, including my industry-leading Rental Property Analyzer.
I also now serve as a coach to dozens of private clients starting their own journeys investing in rental properties, and have helped my clients buy millions of dollars (and counting) in real estate. To chat with me about coaching, schedule a free initial consultation.