Memphis Rental Property #22

Last updated: 2026
NOTE: All figures and statements in this article were accurate as of the time of initial publication in 2022. Check out the Annual Updates section at the bottom of the post to see how the property has performed since then.
In December 2022, I closed on four (!) new rental properties in Memphis. This was directly on the heels of Property #20, which closed a month prior. This house, Property #22, is the second of those December closings, and the third property (out of four) that were part of the 1031 exchange I did when I sold my last remaining NYC rental condo this past summer.
This was something of an unusual deal, and full of contradictions: I bought it from a turnkey provider, but it’s not a turnkey property; I inherited a great tenant that might not be a great tenant; the numbers are bad, but the numbers are great.
What doest that all mean? Let’s get into the details of this deal!
Property #22: The Deal
As I was completing my 1031 exchange, I was working with a turnkey provider to help source properties that would meet my investing criteria, and reliably close without hassles or surprises. The turnkey model was perfect for completing the 1031, because of the timing restrictions inherent in that process.
During the time I was looking to lock down my exchange properties, this home came up for sale from that turnkey provider — but it wasn’t a home he had rehabbed. He had bought it in an opportunistic deal, but there was a tenant in place at the time so he hadn’t been able to flip the house yet. Maybe he got tired of waiting, but for whatever reason, he decided to go ahead and re-sell the property with that tenant still in place.
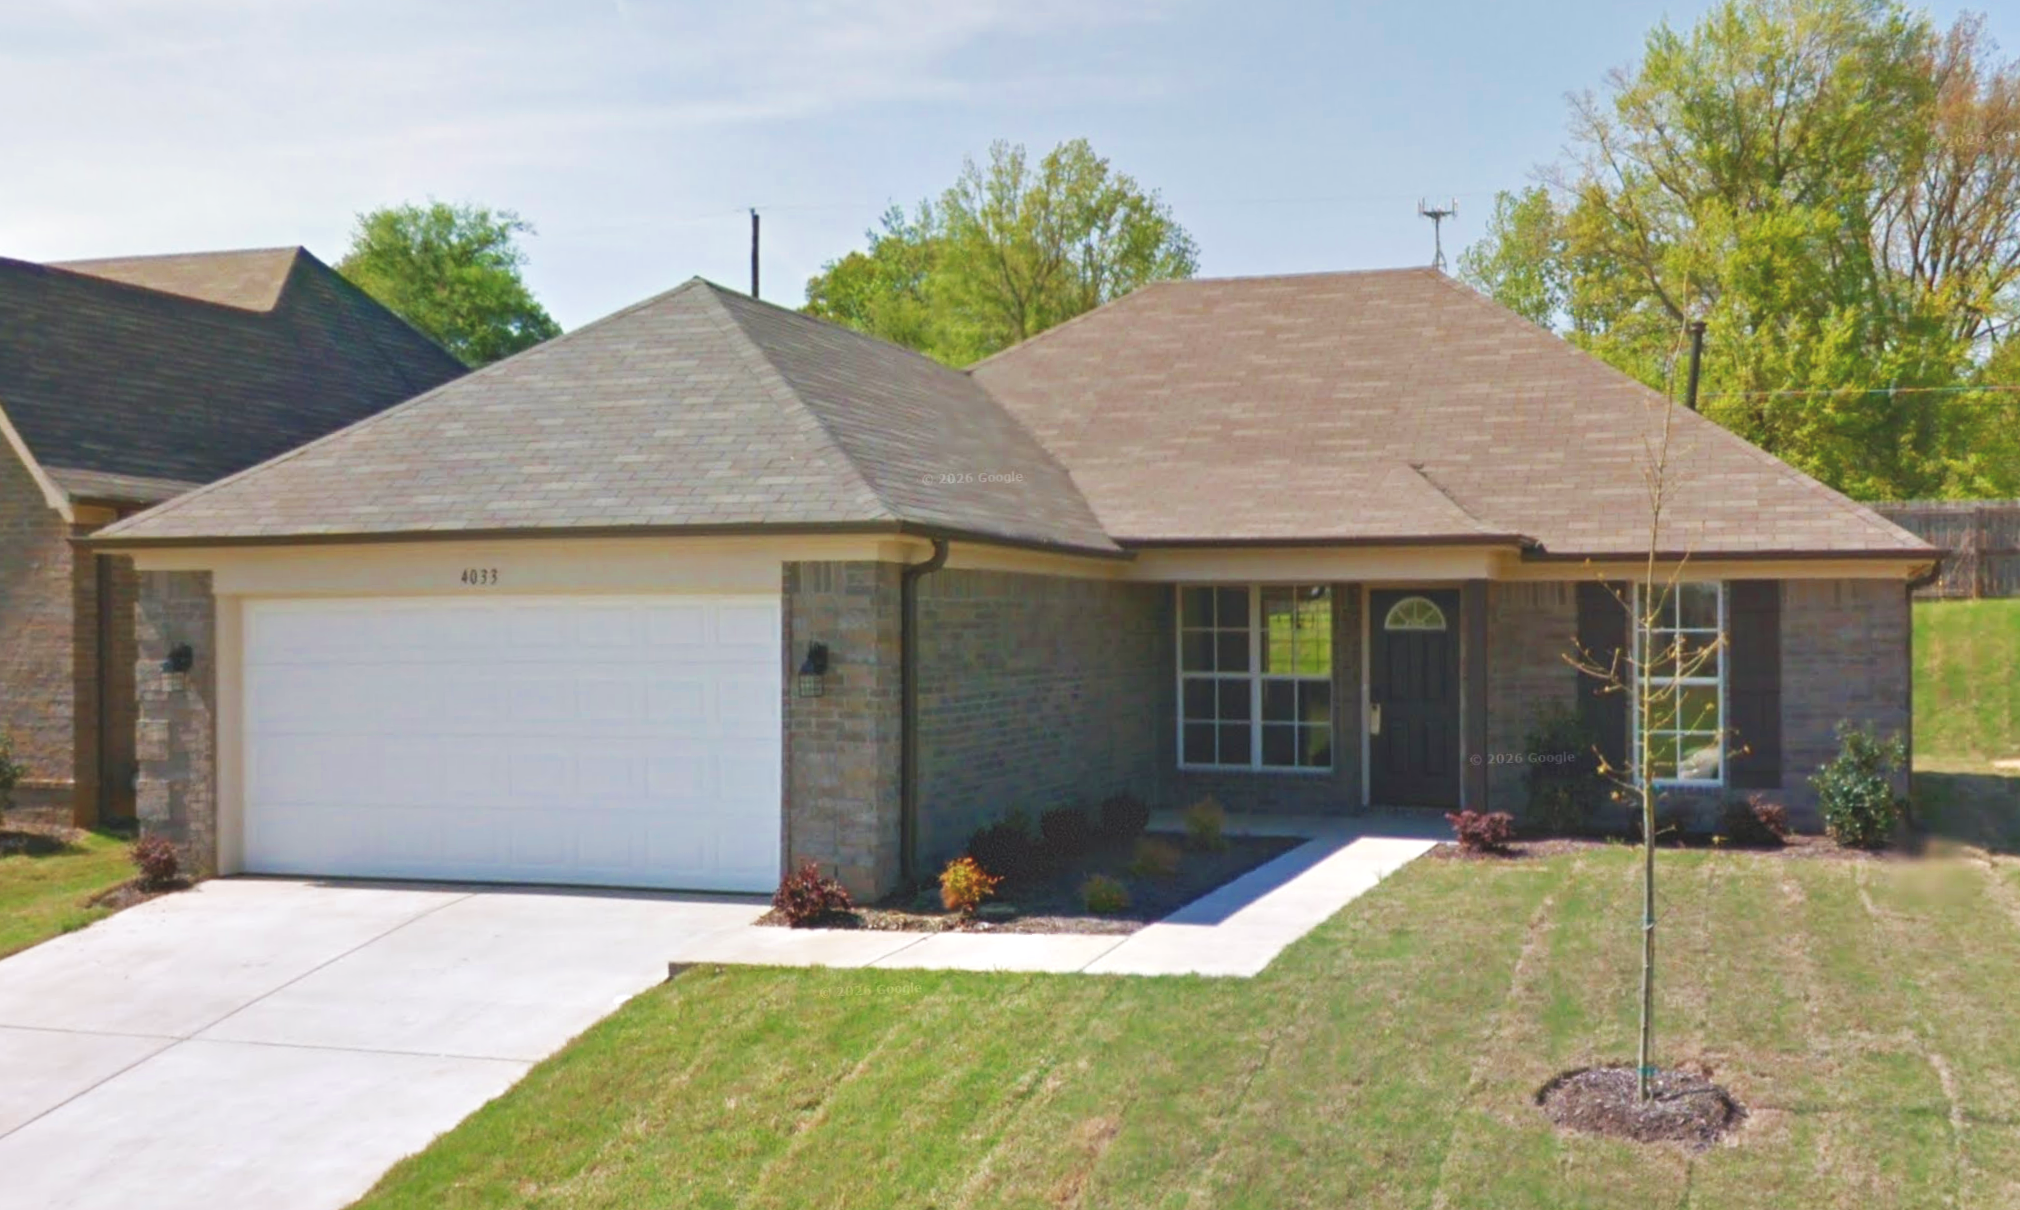
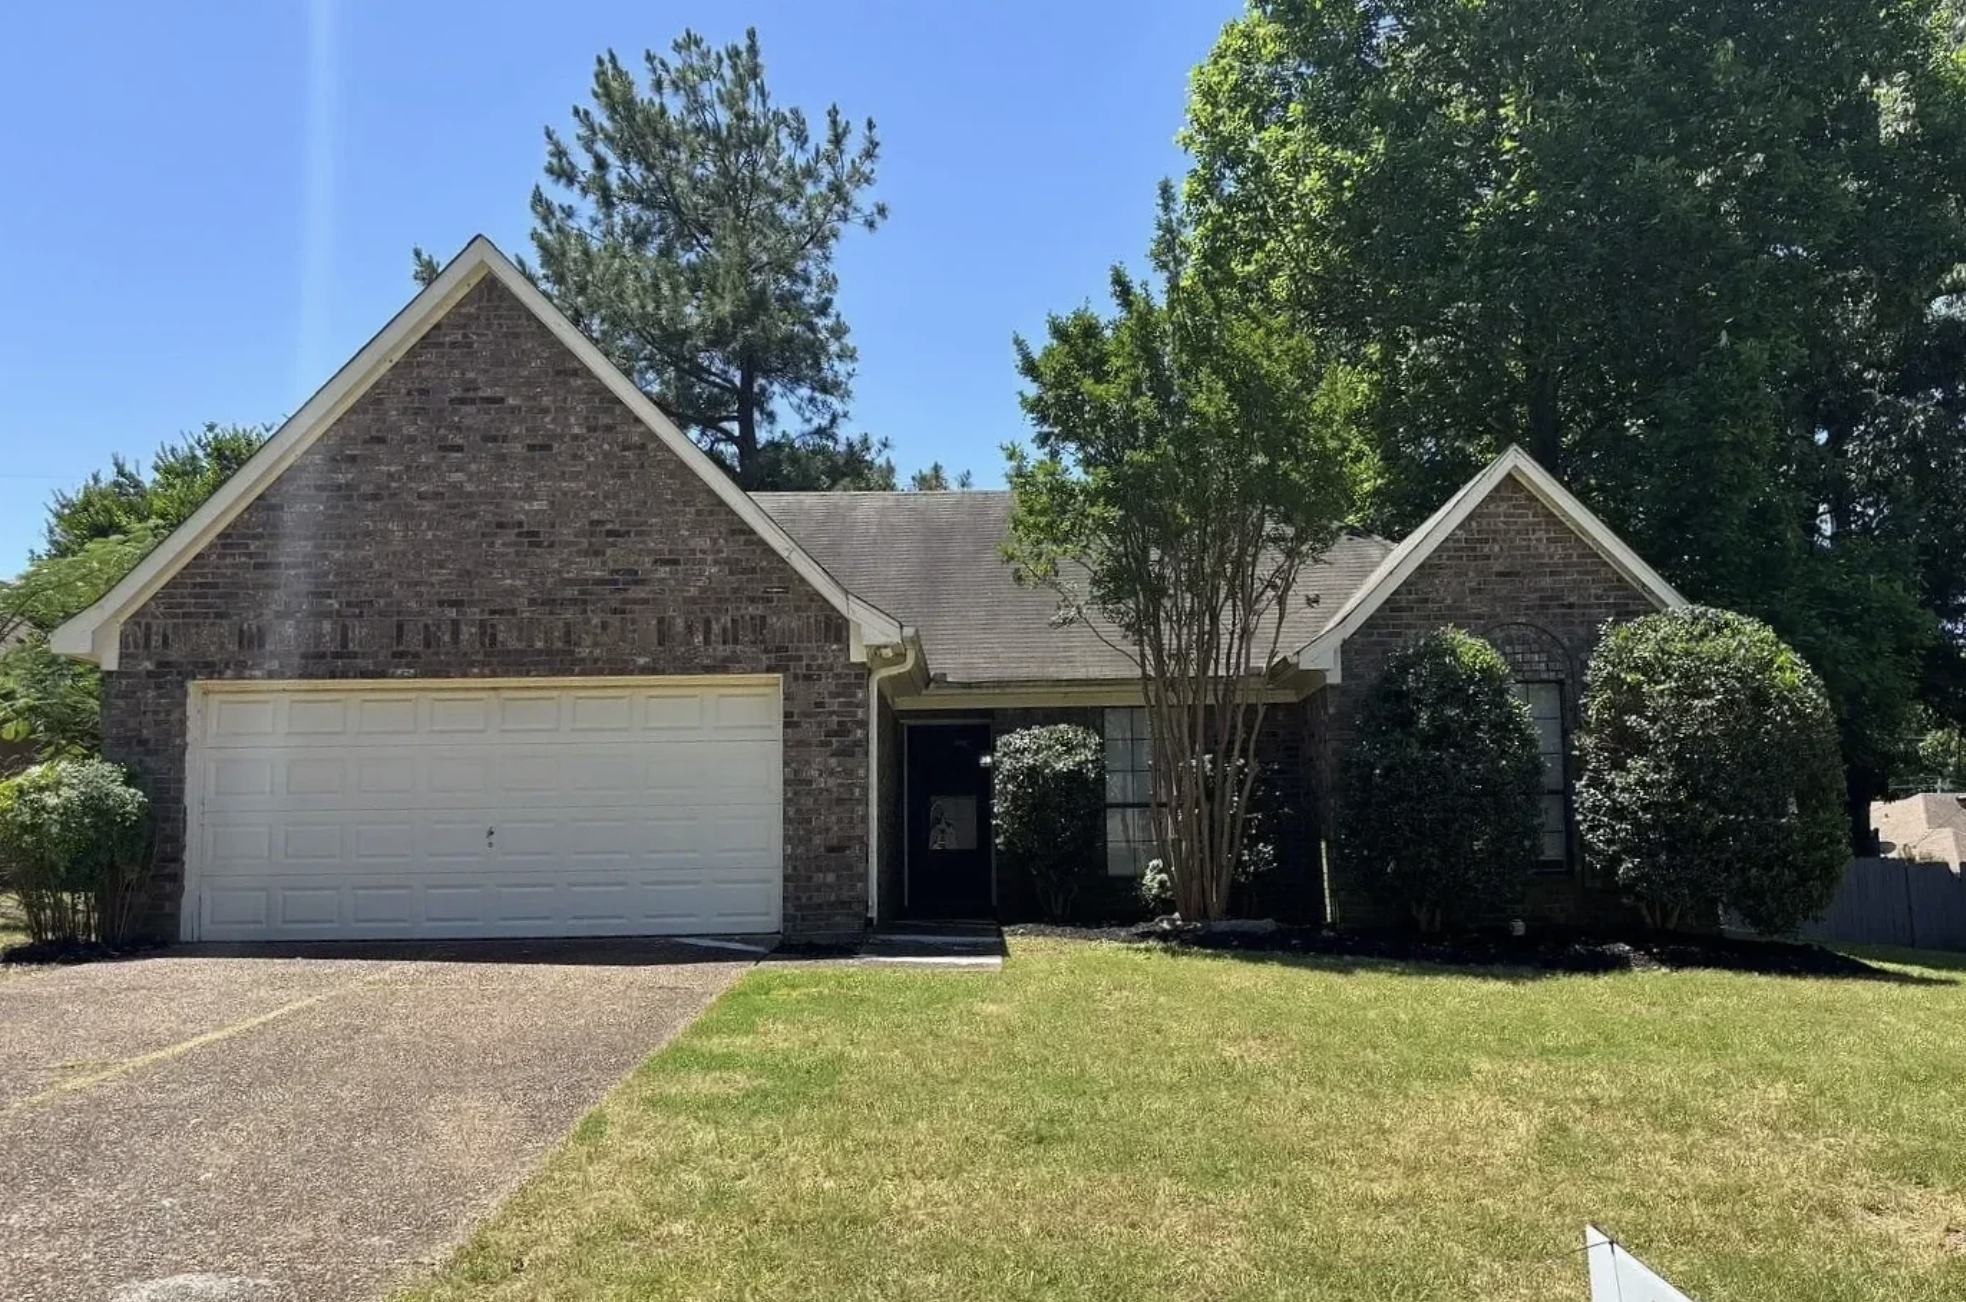
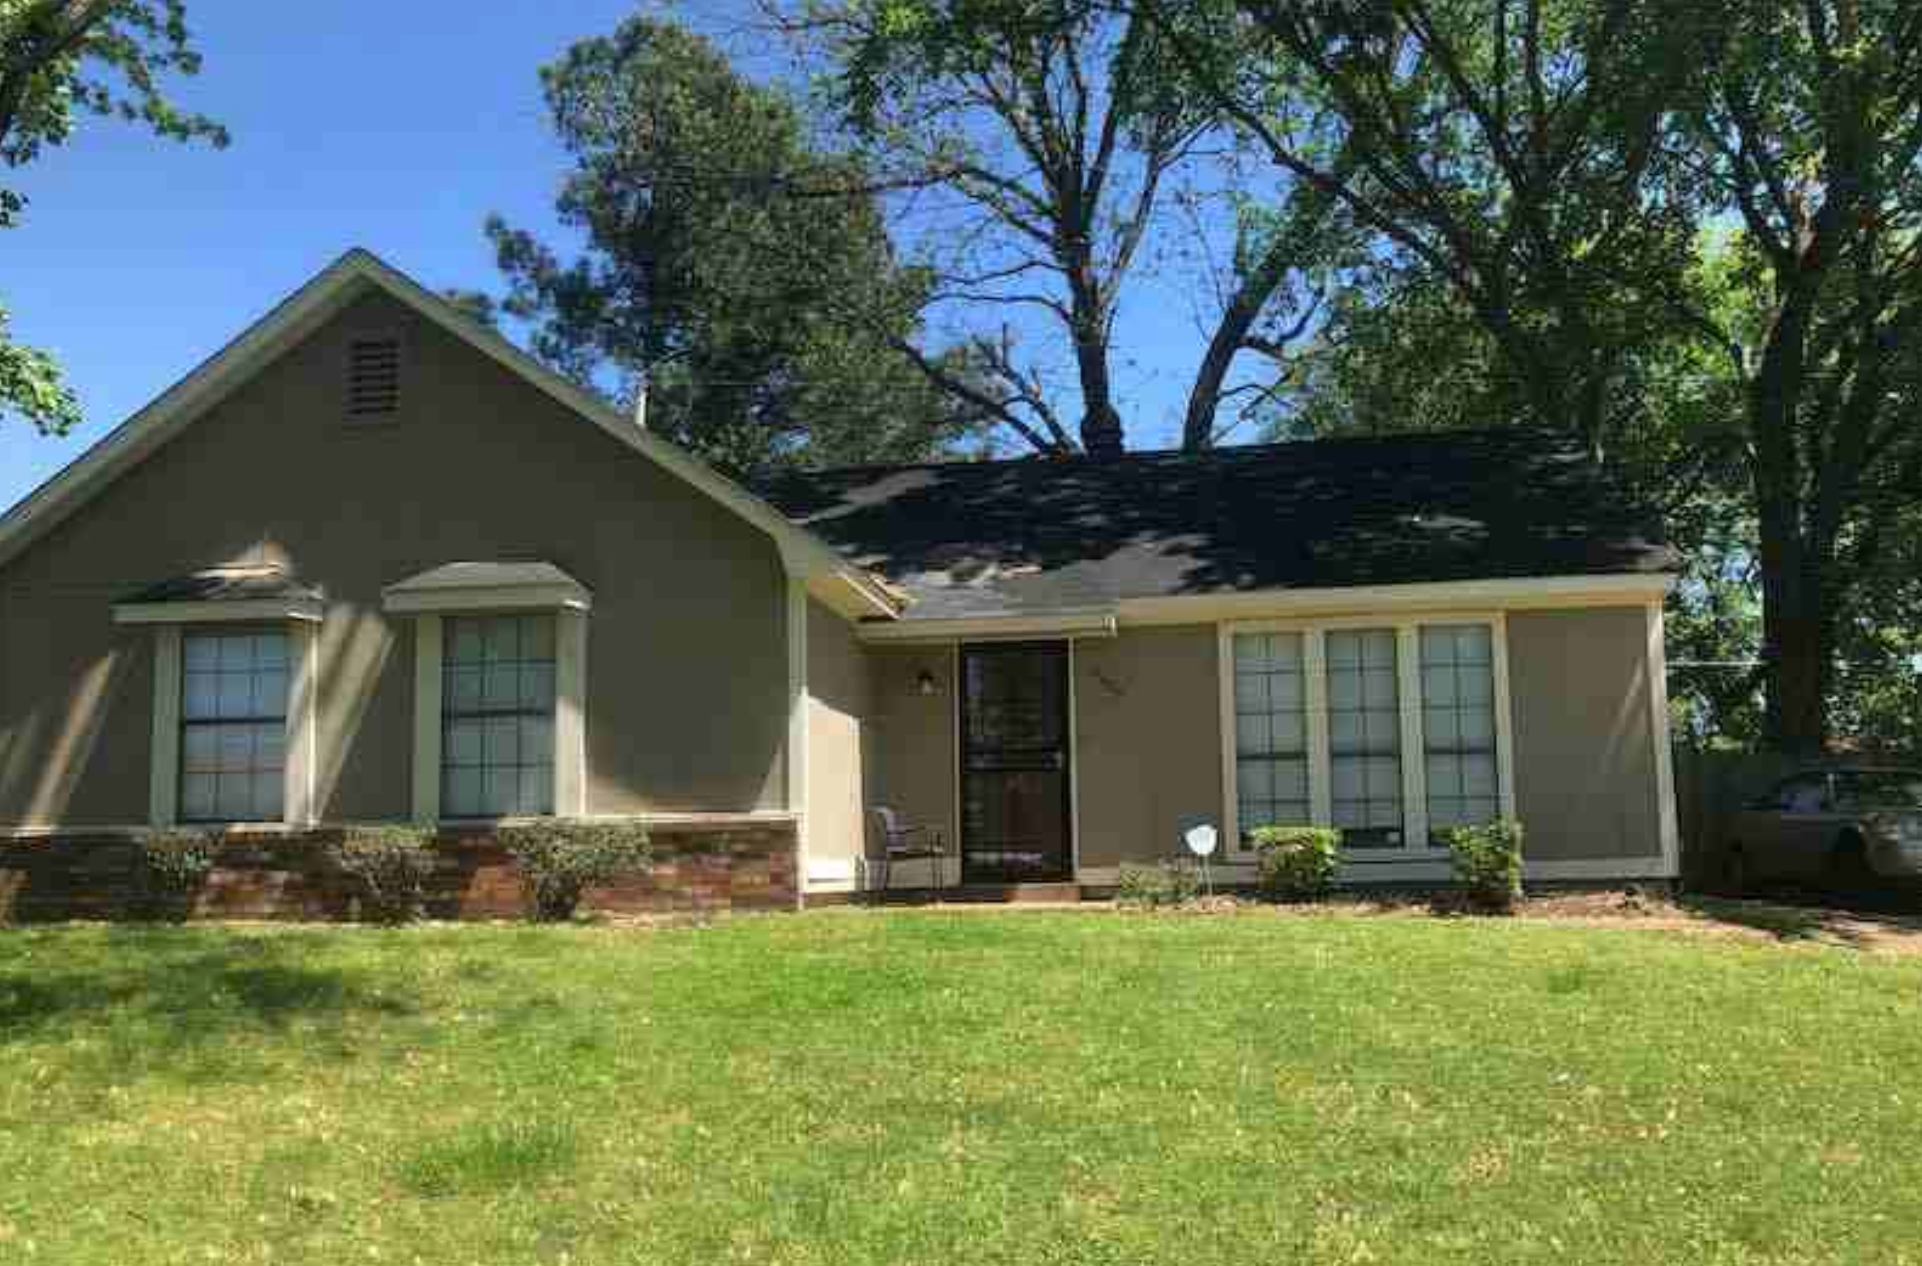
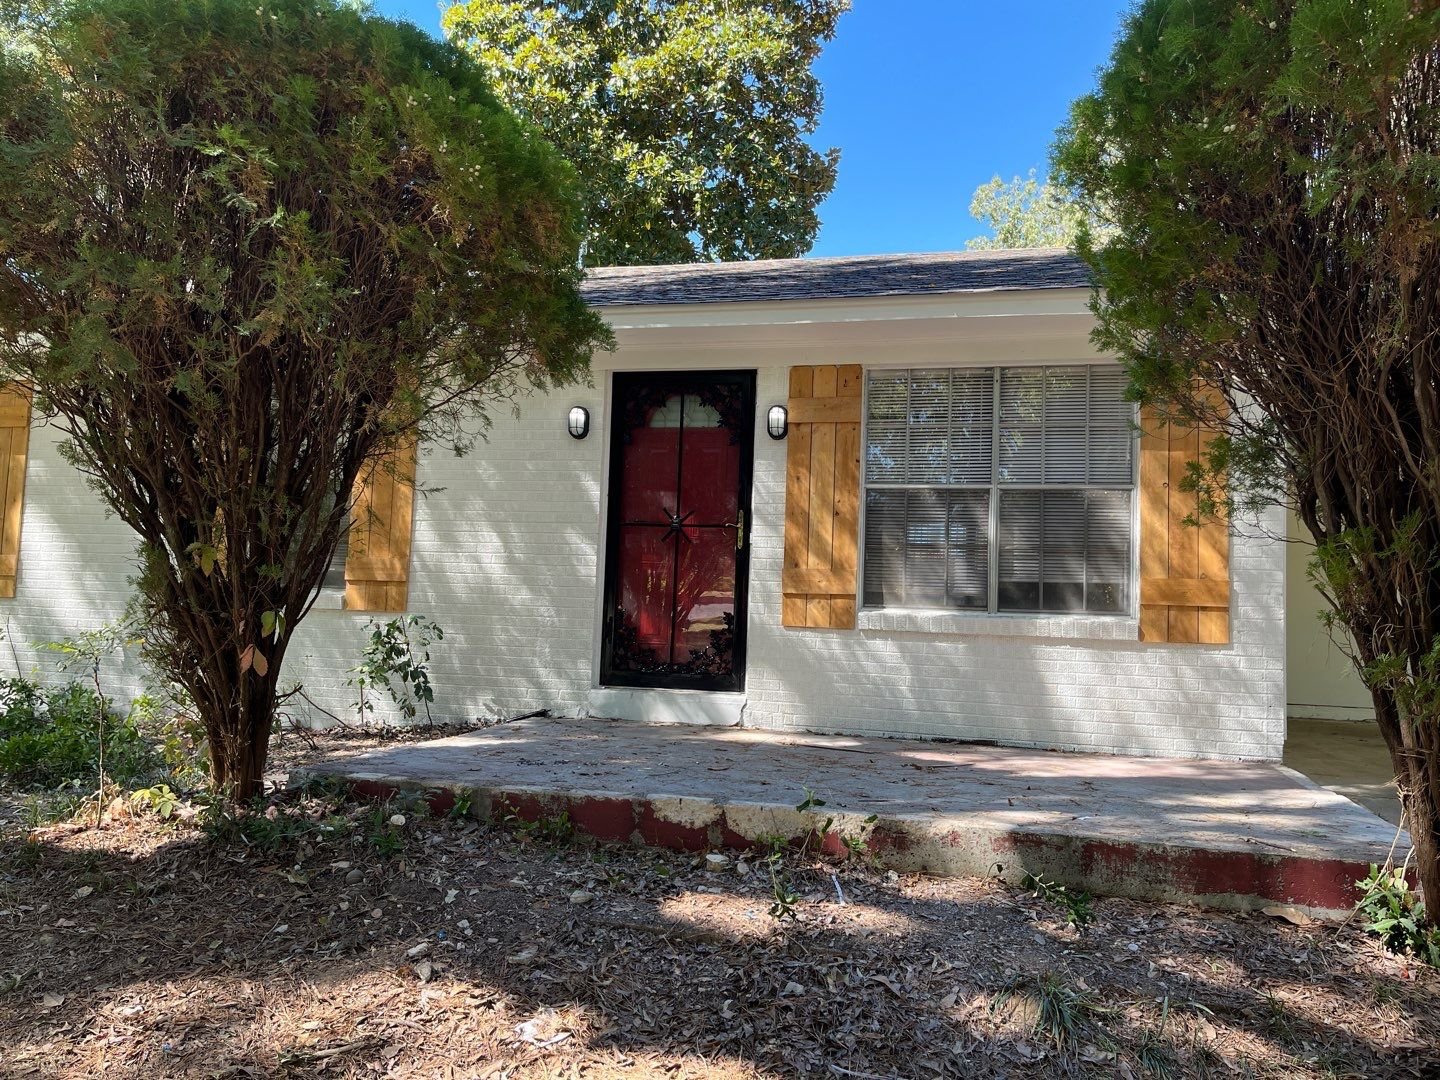
The property is a handsome 3 bed/2 bath home in an area of town that I really liked (Cherokee/Sherwood Forest). It’s a solid brick house with a carport built on one level in 1955. It is also nicely situated at the end of a dead-end cove, which is always desirable for both owners and tenants.
The purchase price being offered was $89,000, and the tenant in place was paying $825/month. But here’s the thing: neither of those numbers represented the market value — not even close. A conservative market price for the home was $125,000, and market rent was at least $1,100.
But the home wasn’t in modern rental condition, so I knew that as soon as the current tenant moved out, I would have to do a pretty large rehab to get it ready for the next tenant. And I knew that the main cost centers (roof, mechanicals, etc.) had not been recently replaced. Still, even considering all that, I thought I was getting a great deal on the price on the home, and would realize “instant equity”. And knowing that I could significantly raise rents in the future, I knew my eventual ROI would be outstanding, even if the numbers out of the gates weren’t impressive.
As for due diligence, the inspection turned up no major surprises. I also requested and reviewed the tenant ledger, to be sure that the tenant has a strong payment history. It was one of the best ledgers I’ve ever seen, with rent paid on our before the 1st of the month for over five consecutive years. So this was a great tenant to inherit — except that they were paying way below market rent. If the tenant were unable or unwilling to accept large rent increases over the next few years to being them up to market rent, then the tenant might just choose to vacate instead.
In the end, I decided the deal was too good to pass up, and it got me one property closer to completing my 1031 exchange. So I moved forward, closing on the same day I closed on Property #21.
Property #22: The Financials
I financed 70% of this purchase with a conventional loan at 6.75%, so my down payment was $26,700, and I incurred $4,971 in closing costs. I used the RIA Property Analyzer to run the final numbers on this property – here are the key metrics that the analyzer calculated for me:

Purchase Price: $89,000
Monthly Rent: $825
Monthly Cash Flow: $106
Cap Rate: 6.88%
Cash on Cash Returns: 4.03%
Total Returns w/ 2% Appreciation: 11.68%
(Want to use this calculator yourself? You can!)
OR
Obviously, these are not great numbers…at all. But I actually think this property will be financially excellent in the long run. To understand why I think that, let’s think through how this property will develop over time, and run a “worst case” scenario over the next several years.
Let’s imagine that the tenant is unwilling to pay a significant increase in rent when the lease comes up for renewal, and chooses to vacate. And then let’s imagine that I have a significant rent-ready rehab that costs me $15,000, and that I’m able to place a new tenant at $1,100/month (which I think is conservative).
If we run the numbers in the “after scenario” when that new tenant is in place, we’ll see a significant improvement in the ROI numbers — in fact, they would be among the best numbers in my portfolio. Here are both scenarios side by side for easy comparison:

So even if the tenant vacates at the first opportunity, and the rehab costs me $15K, I’d still be looking at nearly 10% cash-on-cash returns (and I think it’s quite possible the eventual outcome will be even better than this, either because the rehab will be cheaper, the new rent will be higher, or both.) On top of that, I’ll likely have at least $20K of “instant equity” in the property at that point, assuming a market value of $125K.
This illustrates a key point: if the price or rent (or both) of a target property is not reflective of market values, it’s important to run two sets of numbers: one for the current state of things, and one for what the numbers will be once the property is stabilized at market values.
Using the multi-year model in the RIA Property Analyzer, we can visualize some of the main long-term trends (assuming an inflation rate of 2%) — I’ll be using the second scenario for these numbers, as I think they are much more representative of the true long-term potential of the house:

Cash flow increases over time. This is because rent and expenses are expected to rise with inflation, but one major expense (my mortgage) is fixed.
Cash Flow Year 1: $4,505
Cash Flow Year 10: $6,330
Cash Flow Year 25: $10,196
Mortgage paydown accelerates over time. This is because of the way banks amortize loans – each month, a little bit more of your fixed payment is principal, and a little bit less is interest.
Mortgage Paydown Year 1: $664
Mortgage Paydown Year 10: $1,217
Mortgage Paydown Year 25: $3,340


Total returns on cash increases over time. This is a consequence of the first two points – I will make greater total returns over time on the same initial investment of cash.
Total Returns on Cash Year 1: 14.9%
Total Returns on Cash Year 10: 20.7%
Total Returns on Cash Year 25: 35.1%
Overall, I think this will be one of my best purchases ever, despite the poor initial numbers. It’s an ideal, well-situated rental house that I got at a great price. And it has another valuable asset: a tenant who always pays the rent on time. My hope is that the existing tenant is able and willing to stay, and we can slowly bring them up to market rent over the next several years.
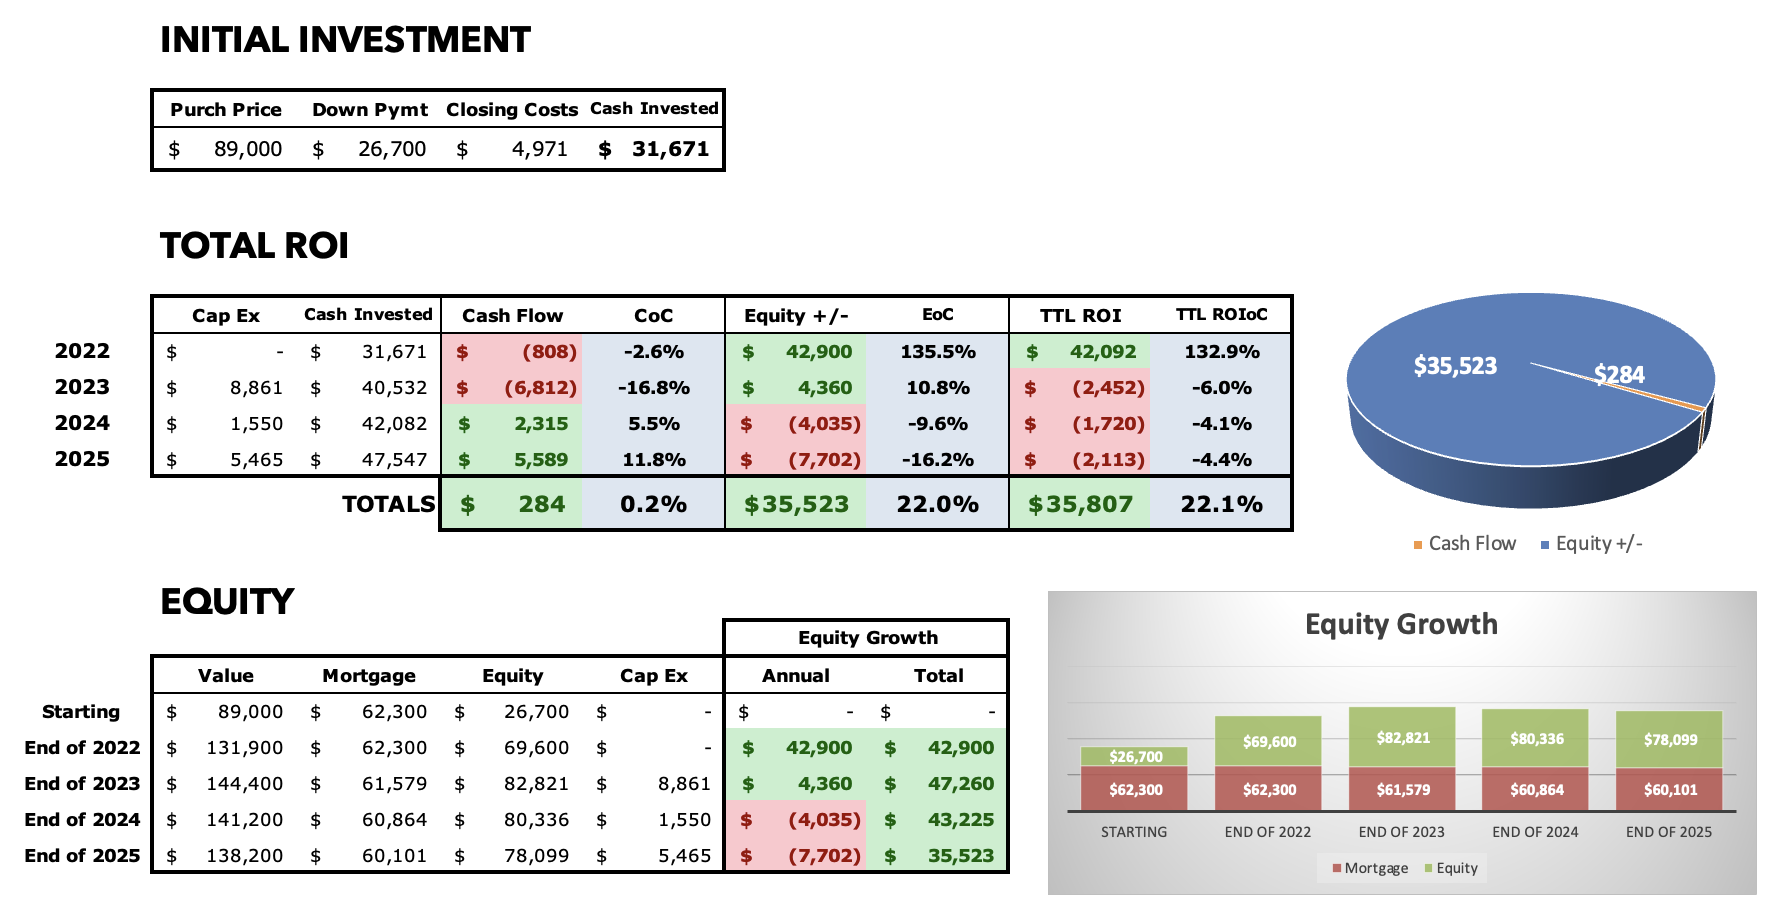
Property #22: The Deal Sheet
Finally, to sum up Property #22 and its financials, here’s the full “deal sheet”:

Looking for YOUR Next Property?
If you need help finding, analyzing, and purchasing YOUR next property — or your first one! — schedule a free initial consultation with me. I’ve helped dozens of private coaching clients invest with confidence and build cash-flowing rental portfolios of their own.
Annual Updates
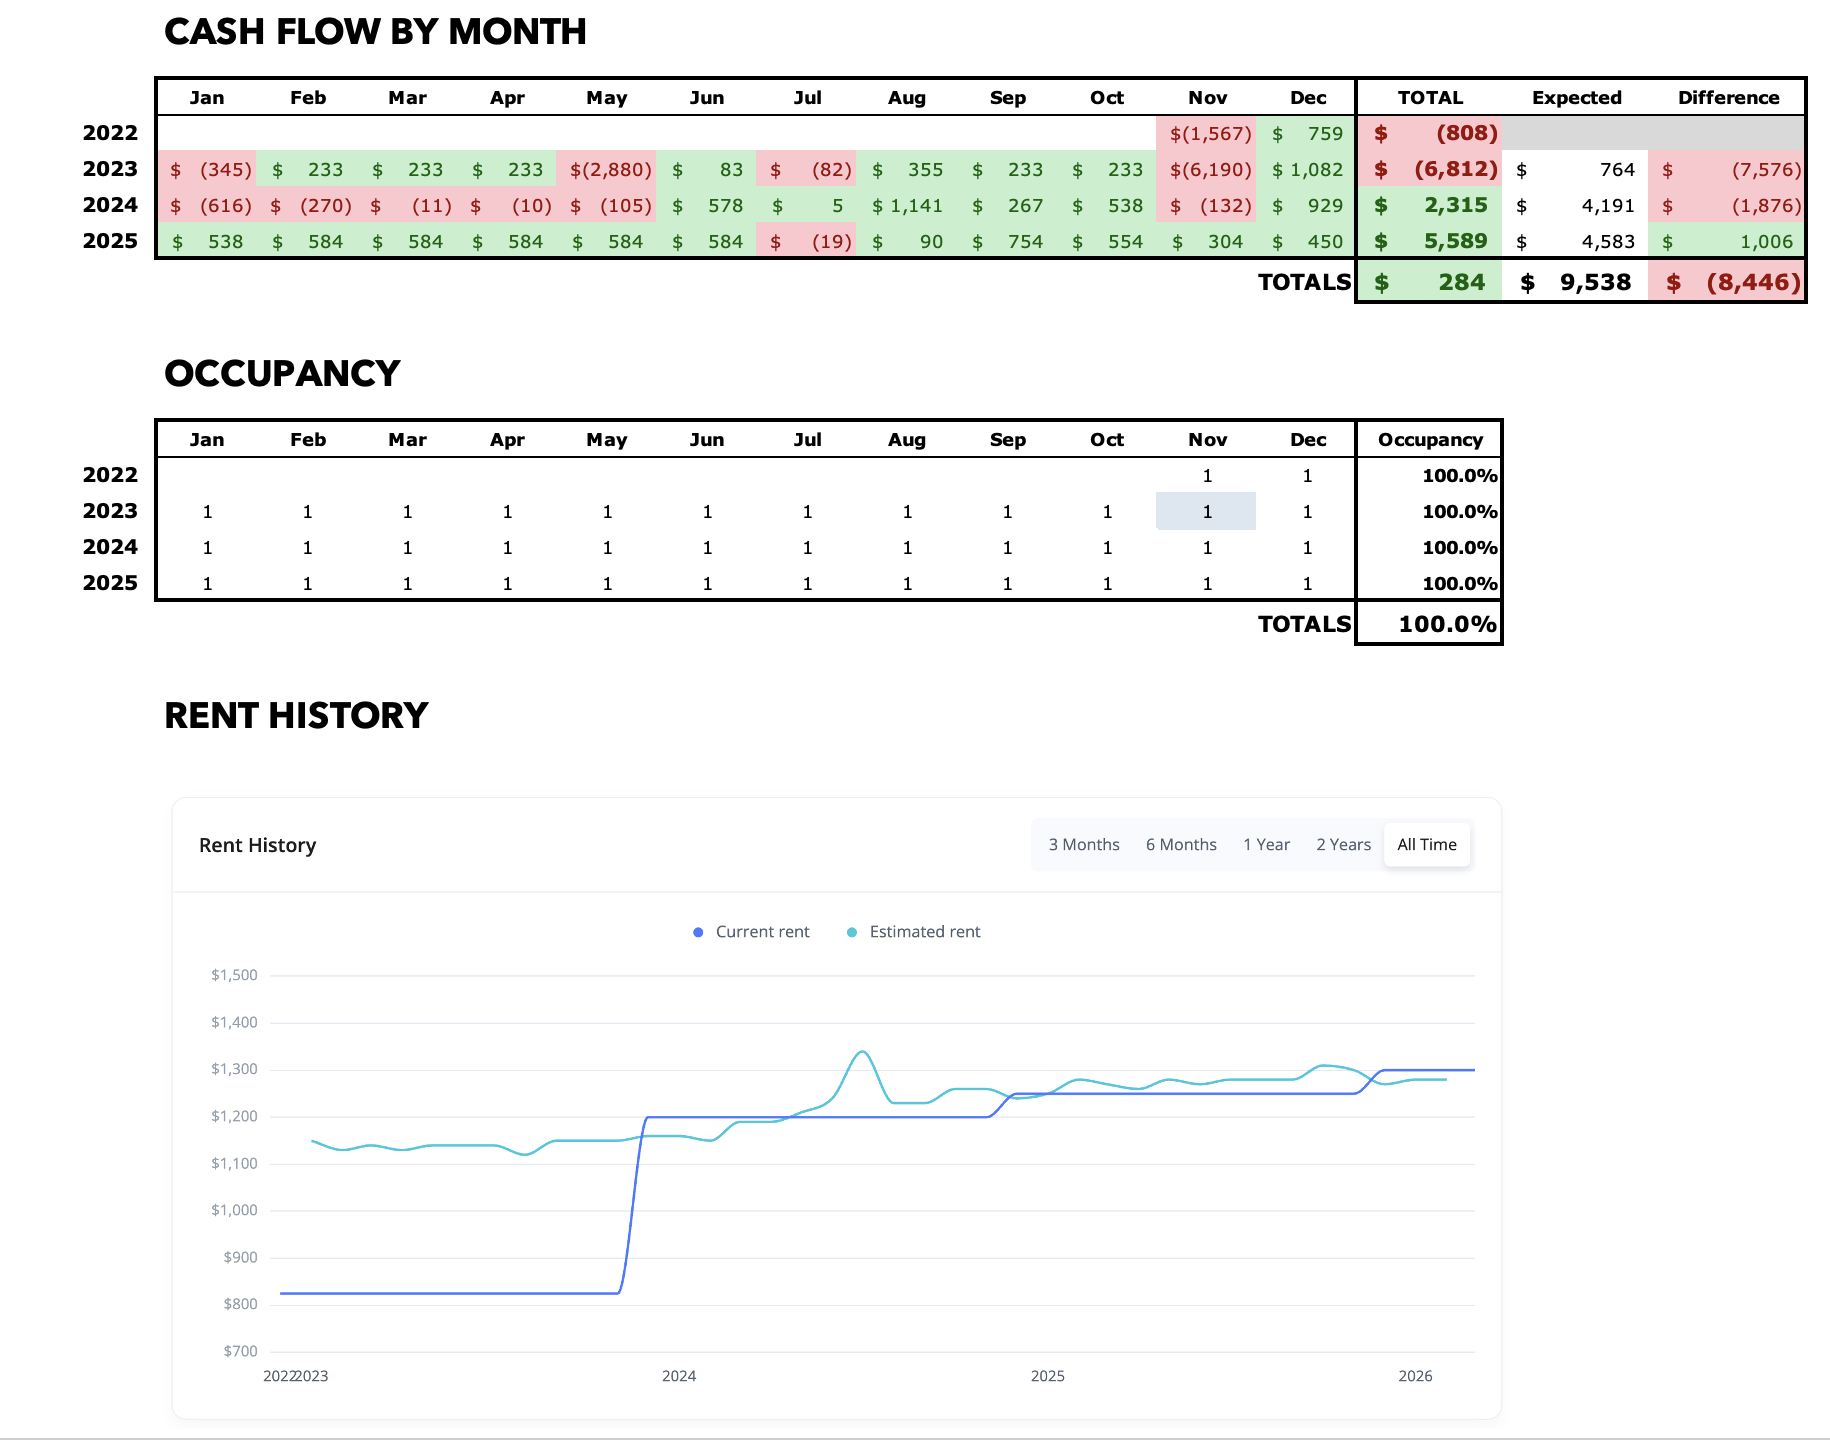
For all Property Spotlights, I come back at the end of each year to provide a brief narrative of what happened at the property that year. I also update my annual and cumulative figures for the property, including cash flow, equity growth, and occupancy.
2023
Remember that great tenant I inherited with this house? Well, they didn’t last long. When their lease came up for renewal, we proposed raising the rent $100 each year for three years, to get them closer to market rent. The tenant was having none of it, and — somewhat to my surprise — chose to vacate. So I had to do that expensive first turn right away. I also had to separately replace the furnace. Plus, I had a separate $3K repair when the home’s exterior electrical equipment was damaged, and had to be rebuilt to code. (This happened at two of my homes in 2023, which was very strange — had never experienced that issue before!) Overall, it was an ugly year financially for this house.
The good news is that it’s set up great for the future. The turn was less than the $15K I had budgeted, and the new tenant is paying $1200, more than I modeled in my initial analysis above, so I’m now looking at very strong returns of over 11% cash-on-cash. Despite the tough year, I still know this one will turn out great in the end.
2024
The new tenant has been great, paying on time each month. In December, they re-upped for another year with an increase to $1,250/mo.
But it wasn’t the smoothest year otherwise. The water heater had to be replaced in January, and then a pipe burst during a cold spell in February — luckily the damage was minimal, but it was still $1K worth of work. Then there were issues with the shower plumbing that had to be addressed once, then twice, then a third time (I requested and got a refund for the third invoice.) Finally, there were some unusual legal charges having to do with the previous tenant, who apparently threatened to sue my PM in order to get their security deposit back, which they felt was wrongfully withheld. I didn’t agree those were my charges to bear, and got a partial accommodation on that as well.
In the end, the property produced over $2K in cash flow, but that should be $4K+ given the new higher rent. I’m still confident this property will eventually be one of my best-performing investments, but I’ll have to wait to see those results. Big equity gains already, though, according to the Zestimate — as I knew in the original purchase, I knew I was getting an excellent price on the house, and that’s now being reflected.
2025
My tenant continues to pay on time each month, and renewed their lease in December for another year with another $50 increase to $1,300/mo.
I only had about $1K in maintenance expenses, including the installation of a bathroom vent fan, and some HVAC repairs. But those HVAC repairs ultimately led to a full HVAC replacement, at a cost of ~$5,500 in CapEx. That means that in the first three years, I’ve already fully replaced the furnace, water heater, HVAC, and flooring at this property, reflecting the amount of deferred maintenance & upgrades I inherited when I bought the house.
So while I had the best cash flow year yet, I still had to come out of pocket for CapEx. I still feel great about this house long-term; the “instant equity” has been realized (+$35K), even with $15K of CapEx upgrades, and cash flow should be very strong in the coming years.
About the Author
Hi, I’m Eric! I used cash-flowing rental properties to leave my corporate career at age 39. I started Rental Income Advisors in 2020 to help other people achieve their own goals through real estate investing.
My blog focuses on learning & education for new investors, and I make numerous tools & resources available for free, including my industry-leading Rental Property Analyzer.
I also now serve as a coach to dozens of private clients starting their own journeys investing in rental properties, and have helped my clients buy millions of dollars (and counting) in real estate. To chat with me about coaching, schedule a free initial consultation.