My First Memphis Rental Property
Last updated: 2026
NOTE: All figures and statements in this article were accurate as of the time of initial publication in 2020. Check out the Annual Updates section at the bottom of the post to see how the property has performed since then.
So much of what’s written about rental property investing avoids giving concrete examples, and relies on averages, generalities, and approximations. The problem with this is that it doesn’t paint a precise picture, and therefore fails to give new investors the confidence to take the leap into rental properties.
Let’s end that now, shall we?
I’m going to take you through the first remote rental property I purchased in the Memphis area. I purchased this property on Roofstock, an online platform for buying and selling rental properties. It’s a very nice platform, including for new investors — in fact, I’ve now purchased a total of seven properties on Roofstock — and I recommend it as a deal-sourcing channel to all my private coaching clients. (2024 update: a lot has changed over at Roofstock, and it’s a lot less useful than it used to be; I no longer recommend it to my clients.)
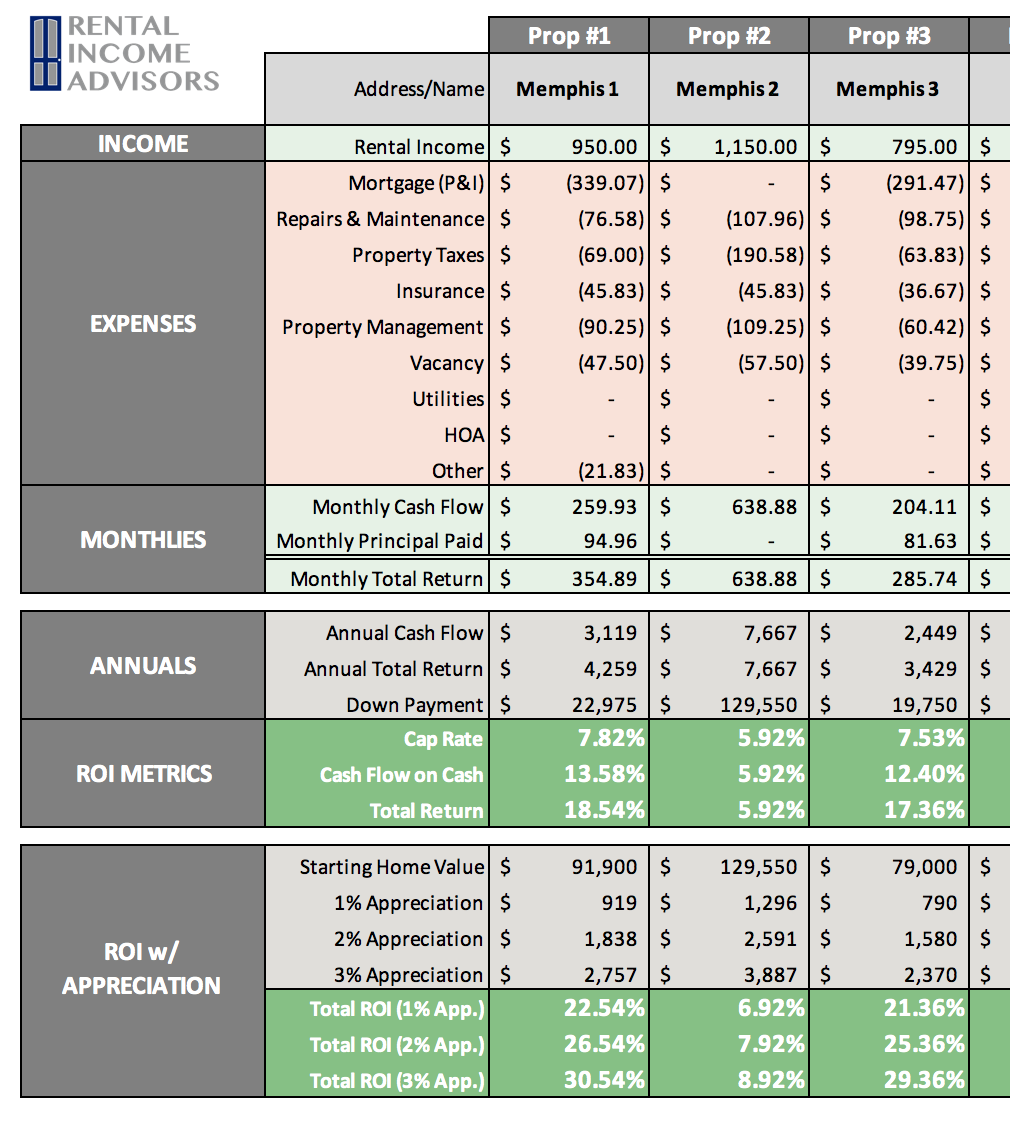
I didn’t choose to focus on this property because it’s the first one I bought – though of course it will always have a special place in my heart. I chose it because it’s a fair, representative “midpoint” of my overall portfolio in Memphis, and of the kinds of homes in markets all over the US that make great investments. To prove that point, here’s how this house fits into my Memphis portfolio of 16 properties::

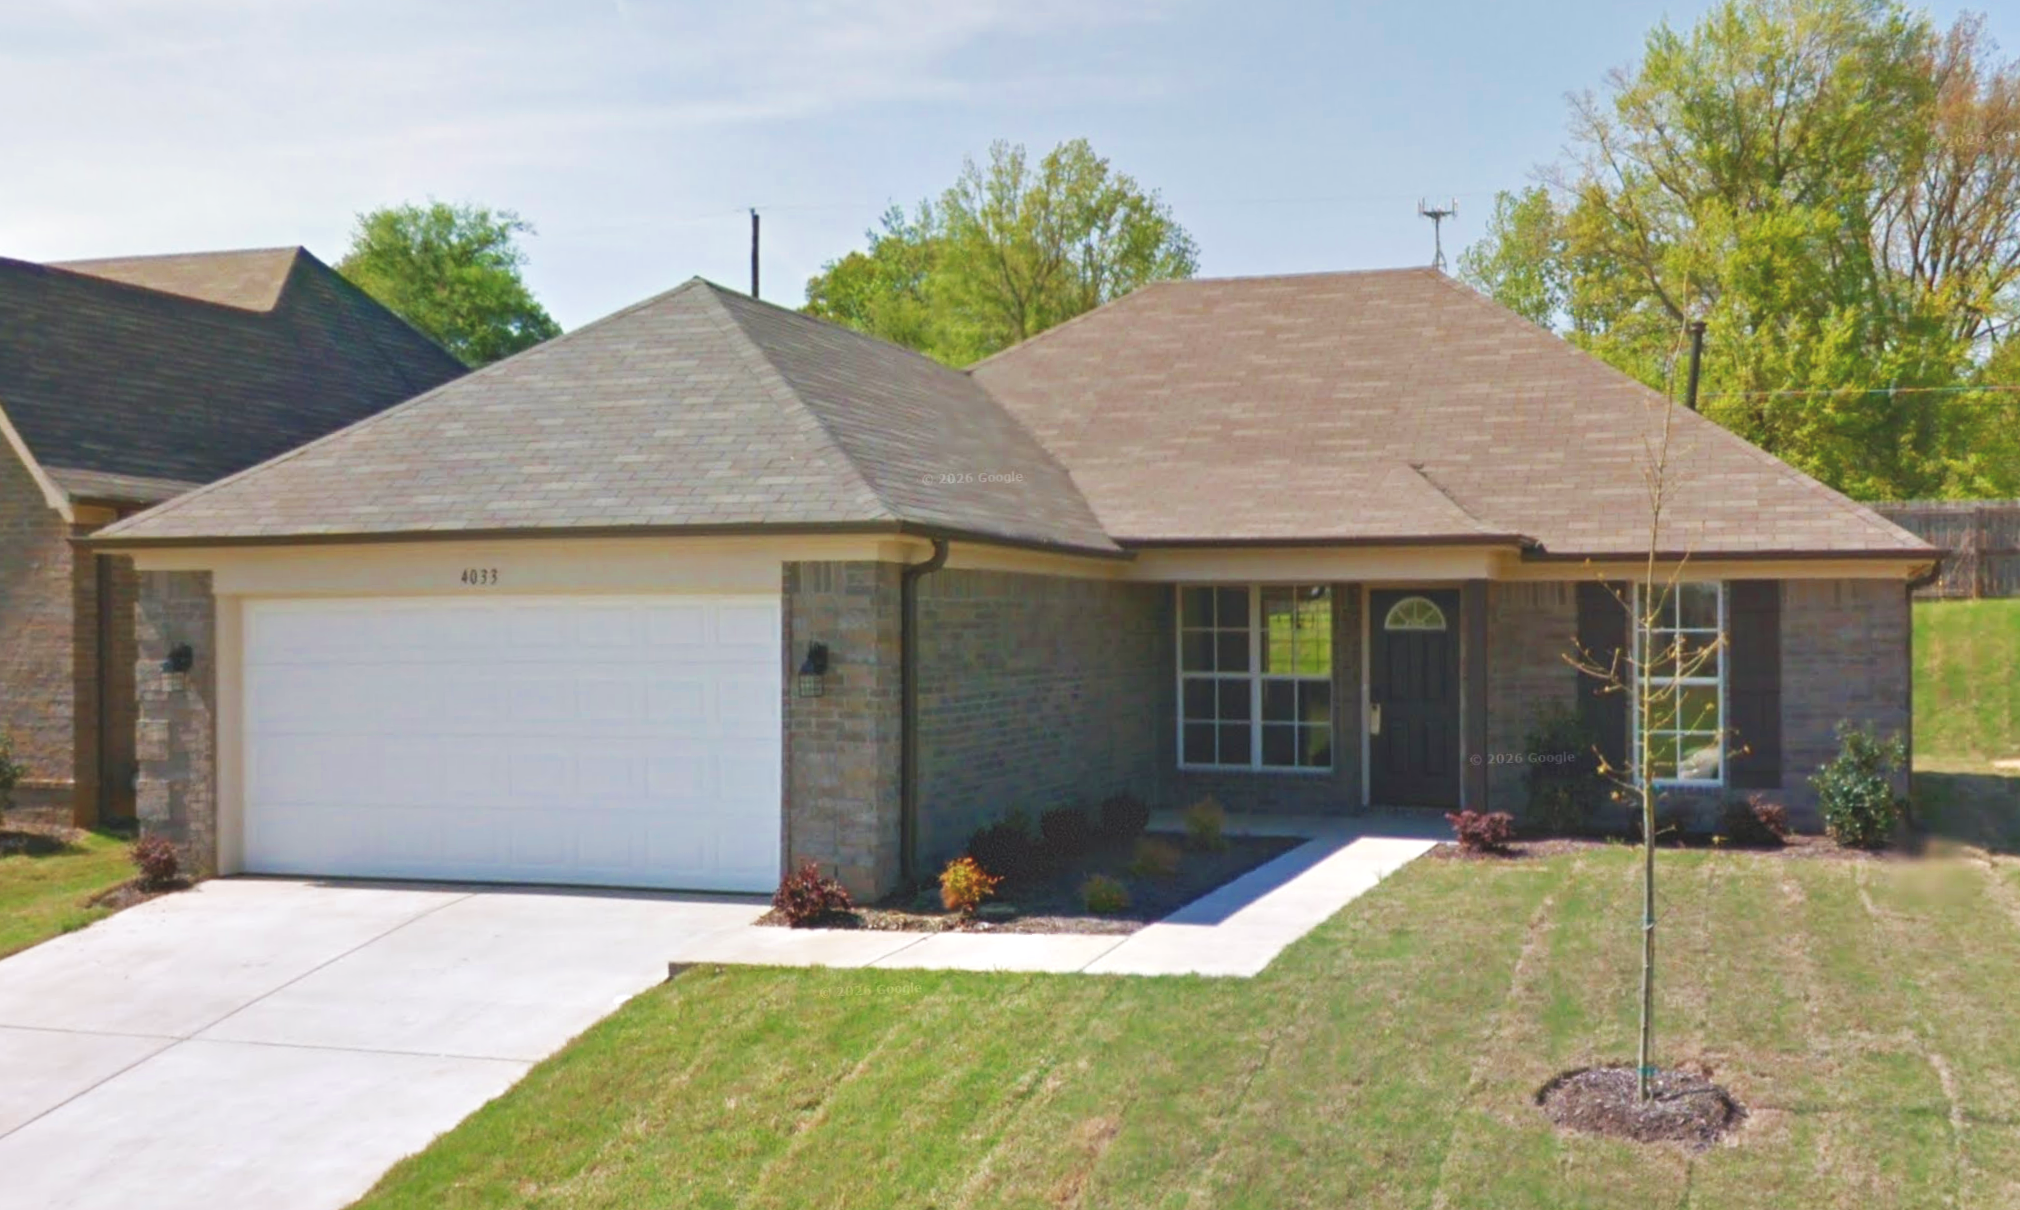
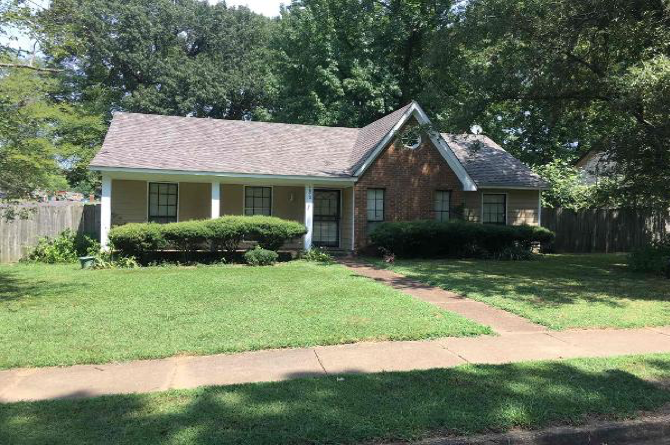
The house is a 3-bed, 2-bath in a B/B- neighborhood, and I purchased it in October 2018. At the time of purchase, it was occupied with a long-term tenant who is still in place. And look how cute it is!
So let’s dig into the numbers on this house. First I’ll go through the projections and modeling, and then I’ll share the actual performance of the house so far. The big question will be: did it actually live up to expectations?
Note: another advantage of talking about this house is that I purchased it in cash, so there’s no mortgage expenses to consider in the equation – there’s just revenue and direct expenses, the things that go into the calculation of cap rate. (I bought this house before I realized how powerful mortgages could be! Read all about that topic here.)
I’ll also be leaving closing costs out of this discussion, which were minimal in any case on this house, because I bought in cash.
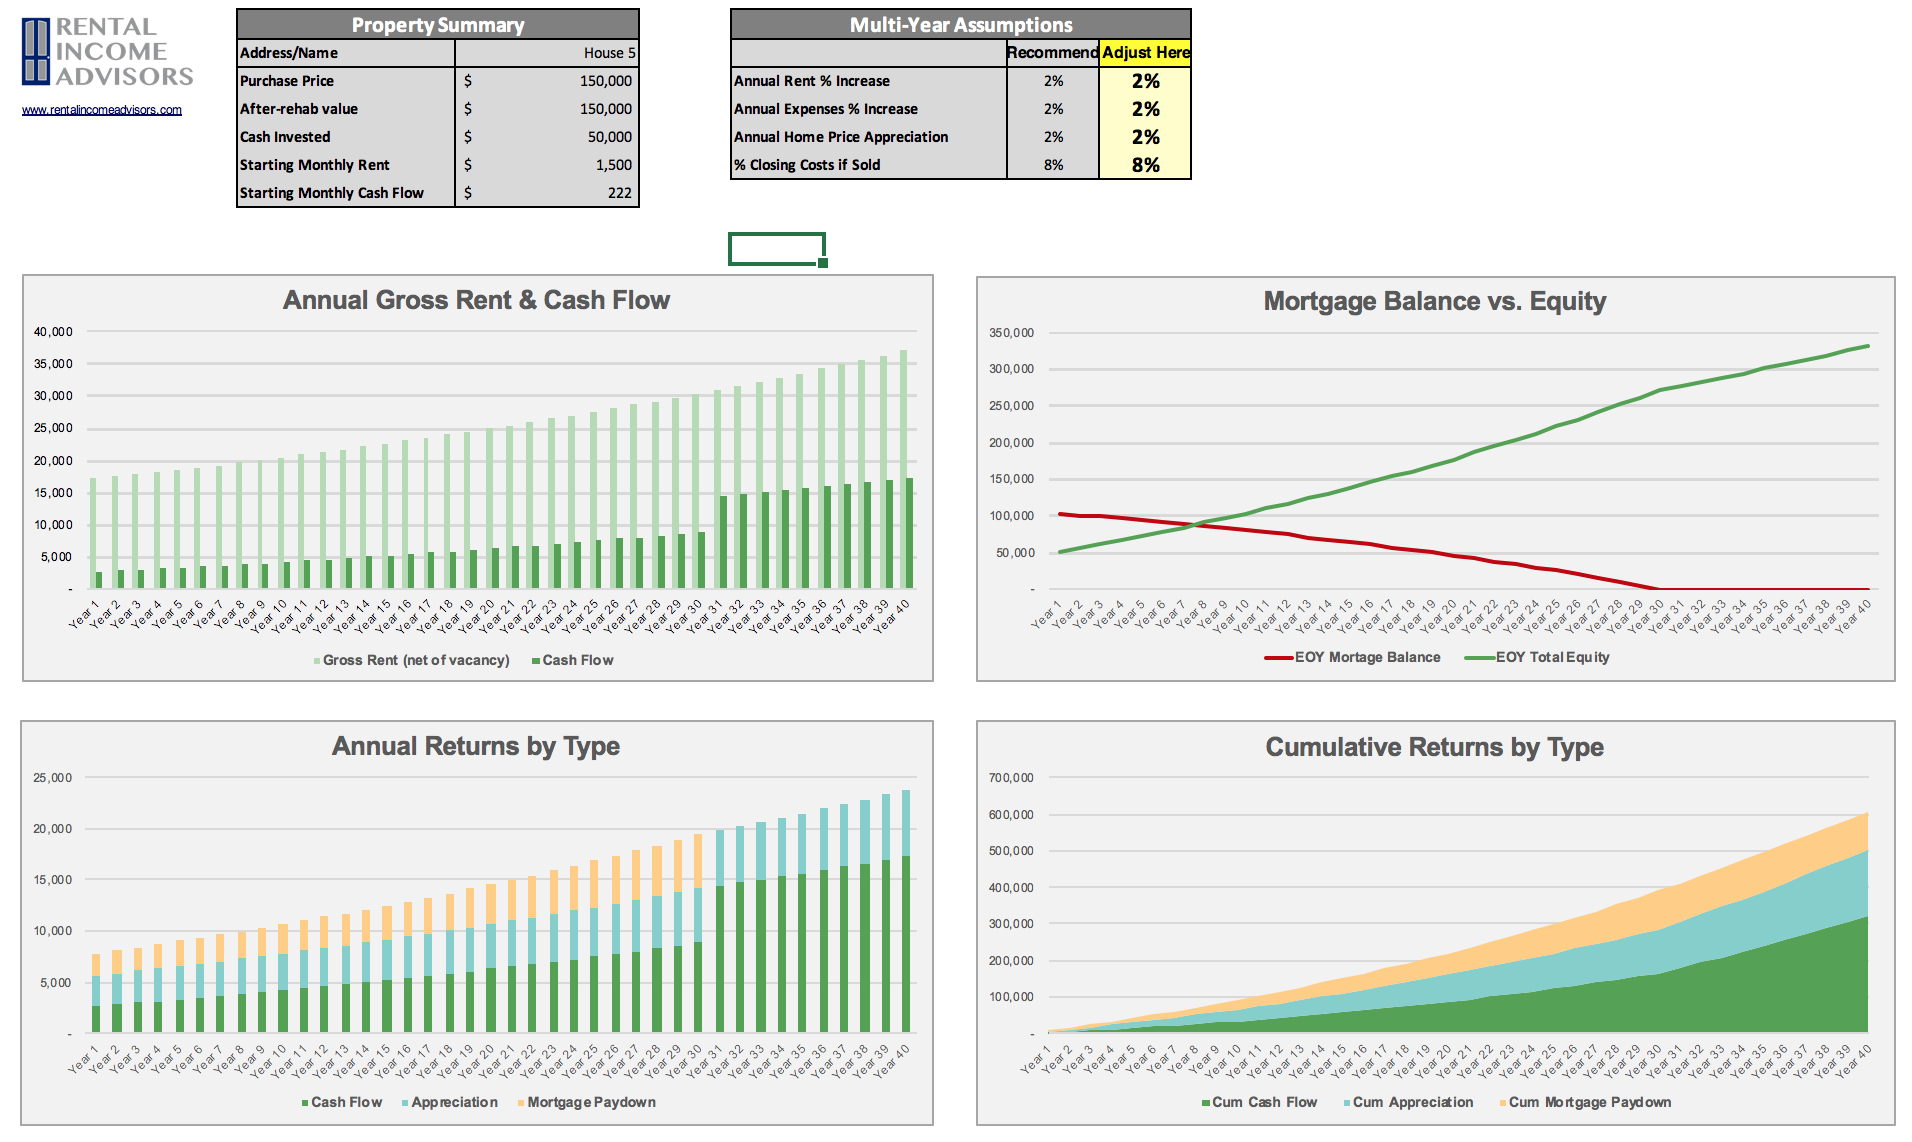
The Initial Financial Projections
Here’s the summary of how I modeled the monthly financials of this property going into it. I’ll go into a more detailed discussion of each line item below.

Rental Income: As I mentioned, this property was tenant-occupied when I bought it. The tenant had lived there 8 years, and had a sterling payment history. Since you can’t screen inherited tenants in the same way you would new tenants, their payment history is the most critical thing to look at – and a tenant with this kind of payment history gave me a lot of confidence. I could also tell by the condition of the home (which I could examine in the inspection report photos) that the tenant took good care of the house. So I was happy with the tenant, confident they would pay on time, and therefore confident in my revenue projections.
If you’re wondering how to estimate the rent on a vacant property, check out Part 1 of my Running the Numbers series. I also offer free Rental Comp Analyses powered by Rentometer.
(Note: the tenant was paying $925/mo. at the time, but their rent has since been raised to $950, so for the sake of simplicity I’m going to use that amount here.)
Mortgage and HOA: These are regular parts of my model, but as I mentioned, there was no mortgage on this property. There is also no HOA (Home Owners Association) fee on this property – this is rare in Memphis, and in most rental markets.
Repairs & Maintenance: I assume that Repairs & Maintenance costs will be equal to 1% of the property price each year. So for this property, which I purchased for $94,500, that comes to $945/year, or $78.75/month.
Obviously, these expenses don’t come in smooth monthly increments – many months have $0 in R&M expenses, and other months have much more than $78.75. But because I model my financials on a monthly basis, I need to use an average monthly amount.
The 1% assumption isn’t perfect: cheaper properties will tend to be higher than that, and more expensive properties lower. But I use 1% for simplicity, and it’s still a reasonably good assumption for any property under ~$150K.
Taxes: It’s easy to go online to find the annual property taxes for any house, which are typically set by county and/or city governments. For this property, annual taxes are $726.98, which comes to $60.58/month. Again, these are paid in a lump sum, not evenly each month, but I split it into even monthly increments for the purposes of modeling and calculating Cap Rate and other ROI metrics.
The prevailing property tax rates in a given area is an important consideration as you evaluate different investment markets. (Here is my full article on how to choose a rental market.) Compared to other top rental markets, property taxes in the Memphis area are not especially low, but also not especially high. Most properties in the area will pay county taxes (to Shelby County) AND city taxes (to Memphis for most of the area, or to other incorporated towns, such as Germantown, Bartlett, etc.) However, this particular house is in an “unincorporated” pocket, which means that there are no city taxes, only county taxes. Without this benefit, total property taxes would be 50-80% higher on this property. Clearly, it pays to understand taxation rates between markets, and also WITHIN markets.
Insurance: Annual insurance on this property is $470.40, which comes to $39.20/month. If you buy with a mortgage, the lender will make sure you have insurance before you close; but even if you’re buying cash, you want to have your insurance in place right away. Rates from different providers in a given market tend to be pretty competitive with each other, but it’s worth getting a few quotes. You’ll also have to decide if you want/need additional coverage categories, as well as what deductible you want. I opt for a relatively high deductible ($5K) in order to reduce insurance costs – basically, I’m only going to file a claim if there is a MAJOR incident such as a fire, tree downing, damaging windstorm, or the like.
By the way, another consideration when evaluating markets is the likelihood of major natural disasters. On this front, Memphis is attractive because it does not experience hurricanes, earthquakes, or floods – and therefore, additional insurance for these things is not required. The only natural disaster that is at all likely to impact a house in Memphis is a tornado, but the chances of a tornado hitting any particular house is extremely low.
Property Management: My Memphis property manager charges 8% of rent collected, which comes to $76/month on this house. Fees can range from 6-10% depending on the market, but 8% is very common, and is the rate used by all the large property managers in Memphis. In exchange for this, my property manager handles pretty much everything for me: collecting rent; communicating with the tenant; arranging and supervising repairs; performing an annual inspection; finding and screening new tenants when there is a vacancy; signing leases; negotiating lease renewals; and providing me real-time information on all this through an online owner portal. (Here’s my full article on everything a property manager does, with more detail on all of this.)
With all those responsibilities, your property manager is your most important partner in your rental property business. Remember, they do pretty much EVERYTHING. To be clear about this, since many new investors don’t fully grasp it: my tenants in Memphis don’t know who I am, I don’t know who they are, and I never talk to them. Ever. That is why I pay my property manager 8% – and if you get a good PM, it’s SO worth it.
Vacancy: I assume a 5% vacancy factor. In other words, I assume that the property will be vacant 5% of the time, on average, or about 5 weeks every 2 years. For this property, that equates to $47.50/month in rent NOT collected during those periods of vacancy.
So far, my portfolio has performed slightly better than this (3.5% vacancy), but I still assume 5% for my financial modeling to be conservative. But you MUST build some vacancy into your model. Tenants will not stay forever, and when they leave, it takes time to turn the property and get it rent-ready, find a new tenant, and get them moved in.
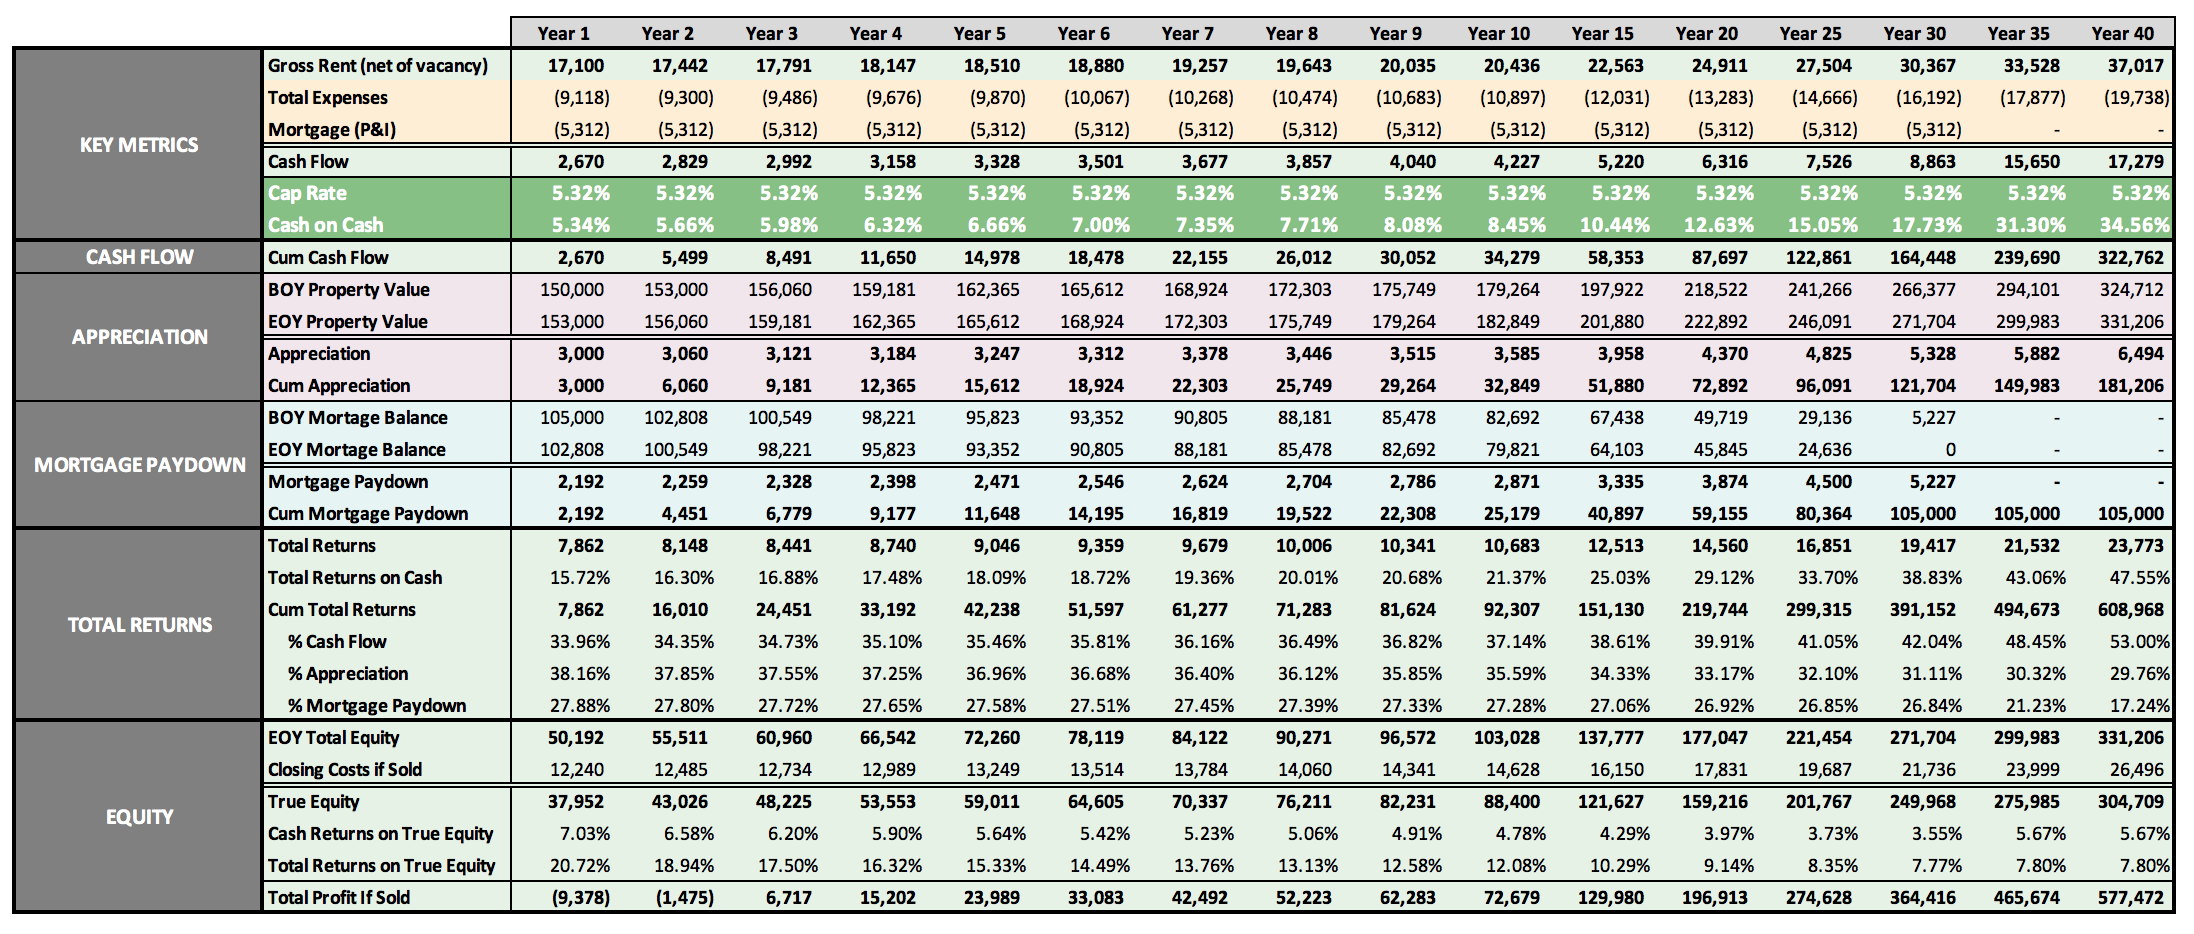
Monthly Profit: Based on all the above, my projected monthly profit was $647.97.
But How Did It ACTUALLY Perform?
Short answer: it has performed very nicely.
The tenant is still in place, and has continued to pay rent on time every month without issue. This also means that the vacancy I built into the model has not been a factor (yet) – eventually it will, but for now this benefits my performance calculations vs. the model.
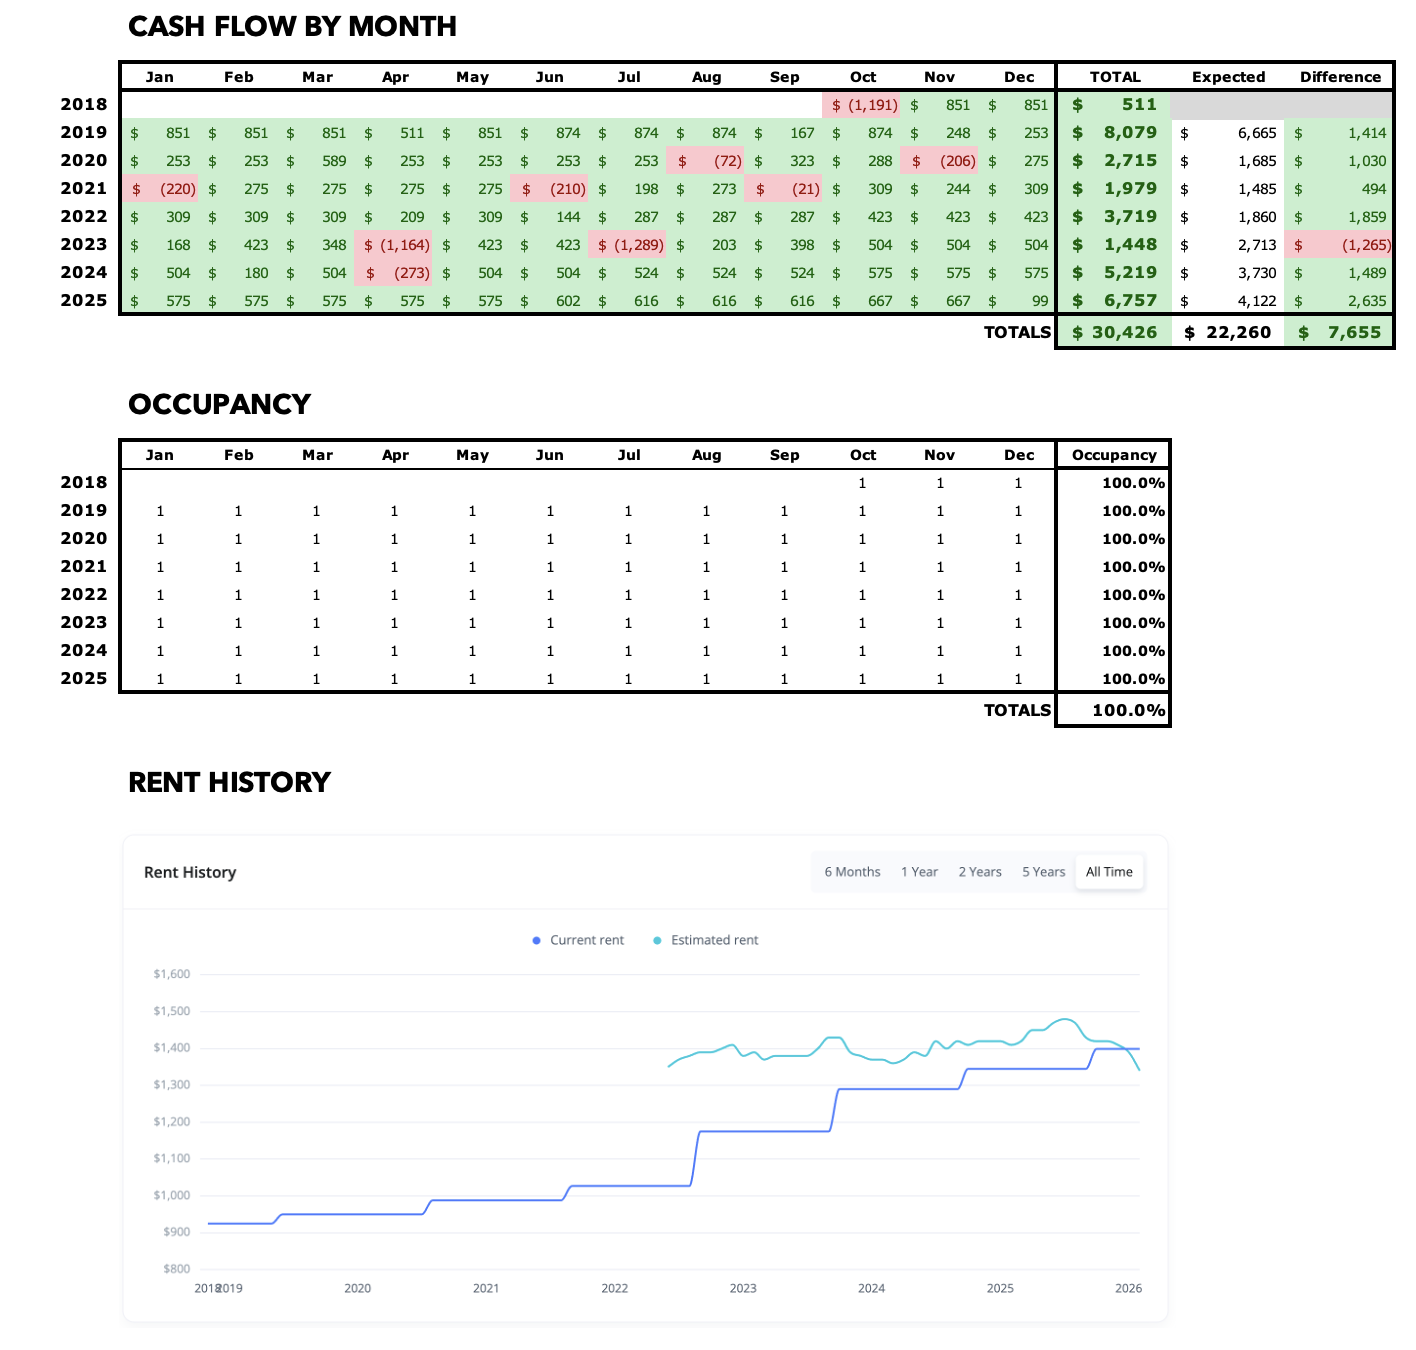
On the expense side, here is the list of expenses incurred on the property since I bought it, through April 2020, excluding the monthly property management fee:

You may have noticed earlier that Repairs & Maintenance is the only piece of the expense puzzle that COULD differ from the model – Insurance, Taxes, and Property Management fees are all fixed costs. So have my assumptions on R&M costs held up?
They have. There were four maintenance issues at the property during these 19 months: I had to replace a toilet; I had to fix an issue with the air-conditioning; I had to adjust and remount the front door; and I had to repair a leaky faucet. Altogether, that cost me $935. That’s an average of $49.21 per month, well under the $78.75 I budgeted. Now, if (or actually, WHEN) I have a major expense – say, replacing a water heater or an HVAC unit – that might bring me back in line with my budget. But so far, so good.
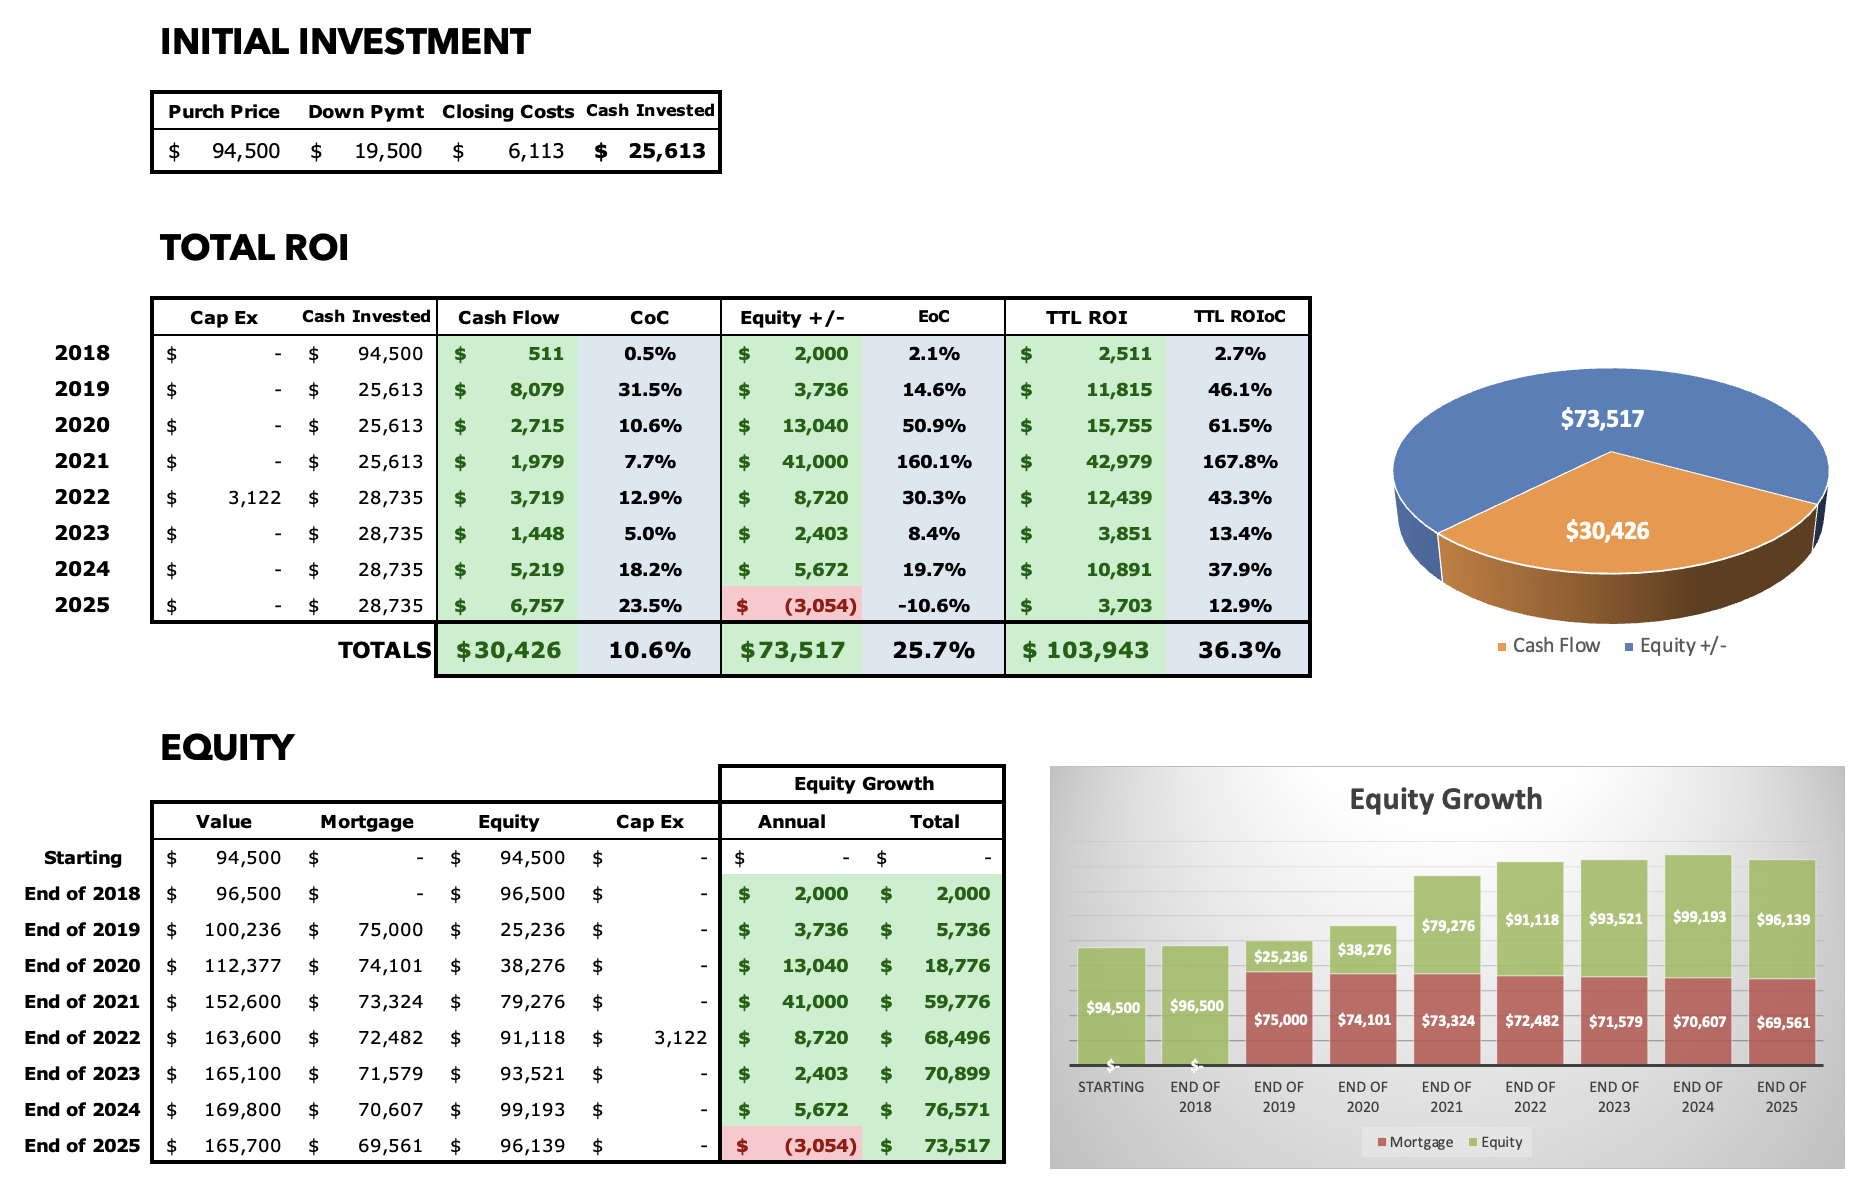
Here’s the final picture of how this property has performed so far:


So there it is: a full deep dive into the numbers on a single property! Needless to say, I’m very pleased with this house so far. To date, the actual cap rate has been over 9%, vs. the 8% I assumed. That isn’t likely to hold up in the long run, however – eventually I’ll have tenant turnover, or a major maintenance issue, which will push the cap rate down toward the target.
Full disclosure: not every single property in my portfolio is outperforming expectations. Some have had more persistent maintenance challenges (particularly the older homes) that have hurt cash flow; my worst-performing house had an eviction 2 months after I bought it (oof!) But despite that, looking at my portfolio in total, it is still slightly exceeding the modeled expectations, proving that the assumptions I make in my model are fair and reasonable.
Annual Updates
For all Property Spotlights, I come back at the end of each year to provide a brief narrative of what happened at the property that year. I also update my annual and cumulative figures for the property, including cash flow, equity growth, and occupancy.
2019
Very little to report at the property this year; very few issues, and I exceeded my cash flow target.
I did decide to do a cash-out refinance in November. This was a non-conforming loan, and due to a communications snafu with my loan officer, the rate ended up being a whopping 7.35%, rather than the 6.35% I was expecting. I decided to move forward anyway, since I wanted to redeploy the capital into new properties — and I was able to pull out $75K, leaving just $25K of cash invested in the property, including my closing costs. The loan does eat up more of my cash flow than ideally I would have liked, but I still expect a reasonable 6-7% cash-on-cash return here, since my dollars invested are quite low.
2020
Very solid year — exceeded my cash flow target by $1K. The original tenant continues to renew, with small increases each year.
2021
A bit more expense this year, including a pipe repair in the front yard, but still exceeded the annual cash flow goal by ~$500. Tenant renewed again, and is now at $1027/mo., but this is far below market rate due to rents increasing rapidly, so I’ll look to do a larger increase next year.
2022
The tenant renewed with a large increase to $1,175/mo., which is great news for 2023 cash flow. But this still leaves the tenant ~$200 short of current market rent, so I’m planning to ask for another $100 increase in Fall 2023. There was hardly any maintenance costs at this property this year, but I did have to replace the HVAC unit for $3,122. (Note that this counts against Equity Growth, not directly against Cash Flow, which is my normal accounting method across my portfolio and the blog.) So far, this house is a story about the value of a stable, long-term tenant.
2023
The tenant renewed again with another sizable increase to $1,290/mo. This continues to be one of the best tenants in my portfolio — they have lived in the property well over a decade, care for it nicely, and are never late on rent. They are much closer to market rent now, so they’ll get a much smaller increase in 2024, probably to ~$1,350.
I did have two large maintenance issues at the house this year which sapped most of my cash flow: first a tree removal for $1,600; and then a bathtub/surround replacement, also for $1,600.
2024
Another excellent, boring year at my first Memphis house. The tenant renewed once again, to $1,345/mo. This is still slightly below market rent for this house, but not by much. We will likely slow down on increases starting next year.
Just $1,100 in total maintenance this year, including a small pipe leak and subsequent repairs.
All told, I exceeded my cash flow target by $1,500, and I’m now over $5K in the green over the life of this property.
2025
Continues smooth sailing. The tenant renewed once again, to $1,399/mo. This brings them very close to market rent. And only a single maintenance issue all year, a $600 furnace motor replacement.
Thanks to full occupancy and very low maintenance, I beat my cash flow target by over $2,500. This property has now produced over $30,000 in cash flow for me. I hope this tenant stays forever!
RIA Property Analyzer
Want the tool that I used to generate all these financial projections? Need help running the numbers on your own properties? Get the FREE RIA Property Analyzer. I guarantee this is the most intuitive, elegant, and powerful free tool you’ll find to run the financials on rental properties.
About the Author
Hi, I’m Eric! I used cash-flowing rental properties to leave my corporate career at age 39. I started Rental Income Advisors in 2020 to help other people achieve their own goals through real estate investing.
My blog focuses on learning & education for new investors, and I make numerous tools & resources available for free, including my industry-leading Rental Property Analyzer.
I also now serve as a coach to dozens of private clients starting their own journeys investing in rental properties, and have helped my clients buy millions of dollars (and counting) in real estate. To chat with me about coaching, schedule a free initial consultation.