2022 Annual Portfolio Checkup

As the odometer flips over from one year to the next, it’s a natural time to take stock — of where you are, where you’re going, and whether you need to change course. That’s true in our personal lives, which is why the famously fickle New Year’s Resolution is still (stubbornly) a thing. But it’s also true with your investments.
That’s why each January I set myself the task of compiling and reviewing my rental portfolio’s annual numbers. I want to stay connected to my key metrics, and distill learnings that might otherwise be obscured by the day to day. And you, lucky reader, get to look over my shoulder as I do it, and laugh at all my mistakes benefit from my experience.
This will be the third installment of my Annual Checkup, covering my cumulative numbers for 2022. (You can check out the previous years here.) It will follow a similar format as in previous years, including the following elements split into two large sections:
A Financial Results
A1 Cash Flow vs. Projected Cash Flow
Review of Maintenance & Repair Costs
Rate of Rent Increase
A2 Change in Equity
True Appreciation
Mortgage Paydown
Capital Expenditures
Total Change in Equity
A3 Total Returns (Cash Flow + Change in Equity)
B Tenancy Results
B1 Occupancy Rate
B2 Tenant Turns
Frequency
Duration
Cost
Also according to past precedent, I will only include in this analysis those properties that I owned for the full calendar year — so the numbers will include Property #19 for the first time, but exclude Property #20 and later.
Alright, let’s get into it and see what worked and what didn’t work in my portfolio in 2022!
A Financial Results
Evaluating the annual financial performance of my properties is the first (and most important) part of the Annual Checkup. It will help me answer questions like these:
Did my cash flow meet expectations?
Were maintenance & repair costs in line?
Was I successful in raising rents?
How much did my total home equity increase (or decrease)?
What were my Total Returns on the cash I’ve invested?
The answers to these key questions will provide insights into my property manager, the state of the real estate market, and of course my properties themselves.
A1 Cash Flow vs. Expected Cash Flow
When it comes to my rental properties, cash is king. The goal with my investments was always to maximize my cash-on-cash returns, because that’s what created more freedom and flexibility in my life, including the freedom to quit my lucrative but soul-smushing corporate job. Many investors who are chasing financial freedom have the same goal — appreciation of home prices is nice, but you can’t buy groceries with home equity. So it’s critical for me to understand if my portfolio is producing the cash I’m expecting it to.
I model my expected returns ahead of time, so that I know how much cash my properties SHOULD produce. This kind of model is frequently called a pro forma. For my modeling, I use the RIA Property Analyzer (and you can, too, because I make it available as a free download!) This tool quickly calculates an expected average monthly cash flow, after all expenses are accounted for; it also calculates an expected rate of cash-on-cash returns.
When I put together the numbers for my portfolio in 2022, and compare them to the pro forma model, here’s what it looks like:
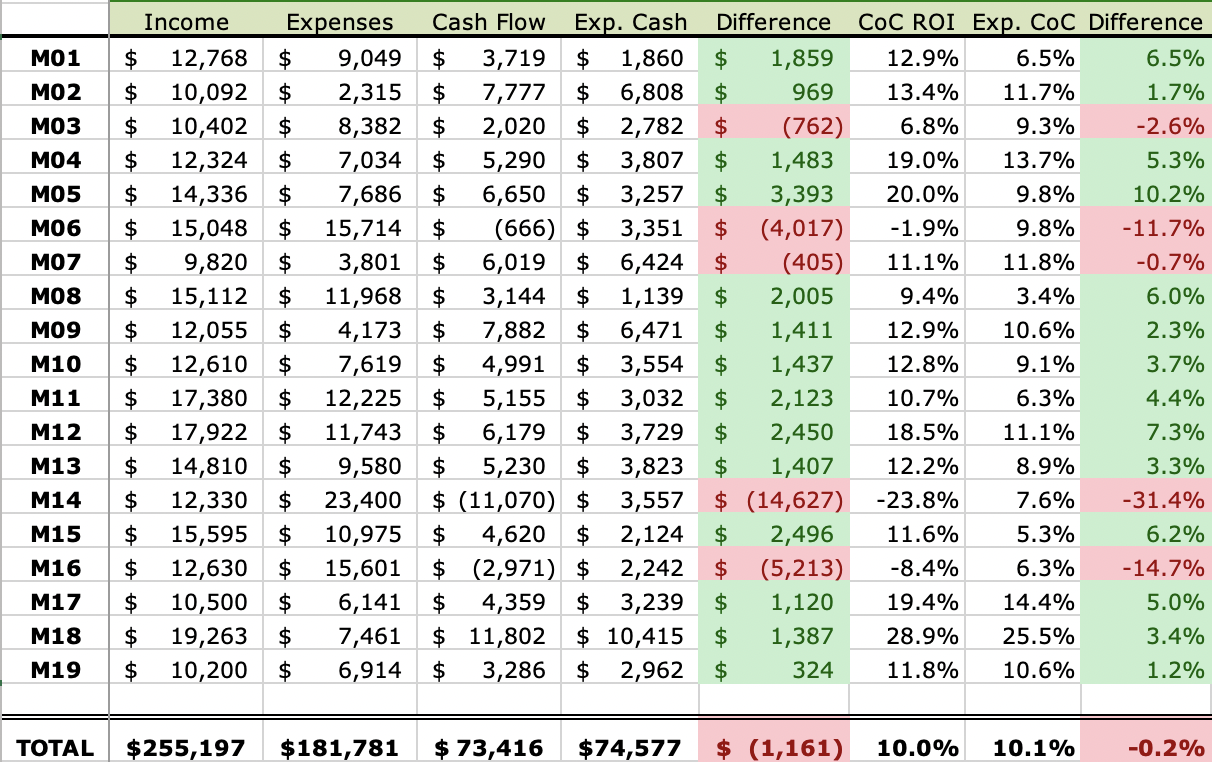
Overall, my properties generated $73K in cash flow, which was about $1K worse than expected. This translates into a cash-on-cash return of 10.0%, slightly worse than the 10.1% pro forma.
As I did last year, I need to pause for a moment here to explain why these numbers do not perfectly align with my December monthly update, which showed I fell ~$9K short of my cumulative cash flow expectations for the year. So how does negative $9K turn into negative 1K? The $8K didn’t just go missing — this discrepancy is caused by two factors:
Most of this difference is due to mid-year rent increases. When I calculate the “expected cash flow” for each property in the table above, I’m using the rents as they were in January 2022. So when a property’s rent increases during the year, this results in a small “bonus” vs. the expected annual cash flow. Conversely, in my monthly updates, rent increases are immediately incorporated into my expected monthly cash flow. Therefore, the sum of those monthly pro formas exceeds the annual pro forma for any property where the rent increased mid-year. I don’t store the pro forma cash flow values by month by property, so this isn’t something I can solve for. (And in fact, I think it’s just as reasonable to do it this way.) As we’ll see later, there were several properties that had significant rent increases this year, so this accounts for ~$7K of the difference between the two measures.
A smaller portion of this difference is due to new properties that get included in the monthly updates, but are excluded from this annual summary. I purchased Properties #20 through #24 in the last few months of 2022, and the first few months of any property can look bad due to one-time costs (i.e. first year of insurance paid at closing). As a result, excluding these newer properties from the Annual Checkup accounts for ~$1K of the difference, making the annual numbers look slightly better than the sum of the monthlies.
Another question that observant readers might have: why did my cash-on-cash expectations go up this year versus last year? In 2022, I was modeling a 9.2% CoC return, whereas in 2022 I was expecting 10.1% CoC. This increase is a naturally-occurring feature of rental properties, whereby the expected cash flow increases over time due to 1) increasing rents that outpace increasing costs (which will happen on a dollar-for-dollar basis even if they increase at the same rate) and 2) on leveraged properties, the fact that mortgage payments stay fixed relative to increasing rents.
Following the pattern from previous years, most individual properties exceeded their pro formas. If a property does not experience a turn or vacancy during the year, this is a bonus vs. the model, which plans for a 5% vacancy rate — so unless there are significant maintenance expenses, that property is likely to end up in the green. This was true for 14 out of my 19 properties last year.
The biggest problem houses this year were Properties #6, 14, and 16, which all missed their targets. Inevitably, these tend to be properties where I had turns/vacancy. I’ll discuss the costs of those turns in more detail later, but the worst offender was Property #14, where I had a massive (but somewhat expected) rent-ready rehab. I also turned Property #16, resulting in red numbers this year. Property #6 simply had a slew of maintenance issues, including a roof repair and an expensive tub re-tiling. (I talk through the details of these turns in the monthly updates throughout 2022, if you want to take a deep dive, or take a trip down memory lane.)
Review of Maintenance Costs
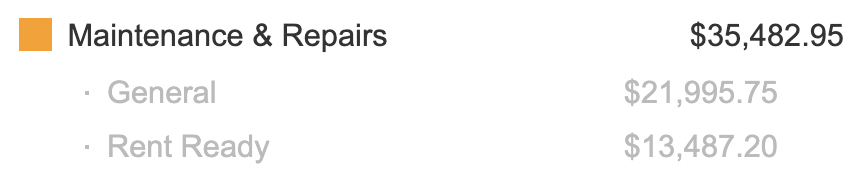
The biggest variable component of a rental portfolio’s expense structure is maintenance & repair costs. Across all 19 properties, my model budgeted for $19,200 in maintenance & repairs. The actual number came much higher, at over $35K — ouch!. Turns (aka Rent Ready expenses) were a big driver of those costs, but general costs were very high as well:
This is the third year in a row that my M&R costs exceeded my expectations — and the last two years have been large misses. This suggests that my pro forma assumptions are too low. I’m making up for these losses with rent increases and occupancy rates that exceed my pro forma — as well see later — but it’s time to make a change and try to budget for these maintenance costs more accurately.
I previously assumed that maintenance & repair costs would be equal to 1% of the purchase price of the home. Similar logic is built into the RIA Property Analyzer. I don’t think this method is fundamentally flawed — but I realized that I hadn’t built in any mechanism to deal with the divergence between the original purchase price and the current value of the homes. That gap has gown quite large in the last few years as home prices have increased, and the inflationary pressures impacting homes are also pushing up the prices of maintenance, both labor and materials.
If I use the 1% of the current value of the homes, instead of 1% of the purchase price, my estimated maintenance costs would be $31K instead of $19K. I would still have exceeded that budget by $4K this year, but it was a crazy year with several unusually expensive turns, and it’s still a lot closer.
So I’ve made the decision to increase my expectations for maintenance & repair costs going forward. I will update the current value of the homes at the beginning of each year, and set my repair budget at 1% of that amount.
This will decrease my expected rate of cash returns in 2023 by ~13%. This is painful, of course, but I’d much rather err on the conservative side with my pro forma estimates. I don’t like repeatedly missing my numbers the bad side; three years in a row means it’s time for a change.
Importantly, this doesn’t impact the way I evaluate new properties, nor the way the RIA Property Analyzer works — because in the first year, the purchase price is the current value. But this new mechanism will provide a way for me to update my cost estimates over time so that they keep up with inflation.
Rate of Rent Increase
I also like to look at how much I was able to increase rents in the course of the year. Rents must increase to make properties profitable in the long run. Why? Because all costs other than my mortgage — such as property taxes, insurance, and repairs — are certain to go up over time, so rents need to (at least) keep pace with those increasing costs.
In my portfolio, my property manager is responsible for leasing vacant properties, and renewing existing tenant leases. Therefore, the rate of rent increase is really a way to measure how well my PM has managed rents across my portfolio.
With inflation increasing significantly of late, rent increases are even more important. I’d normally want to see rents increasing by at least 2%, and that was the target I measured against in 2020. But in 2021, I doubled that target to 4% to account for higher inflation, and I’m going to do the same thing for 2022. So — did I meet that target last year? Here’s a look at where my rents were in January 2023, as compared to January 2022:

Overall, rents across these properties increased at 10.2%, which exceeds the 4% inflationary target, and also far exceeds the what I saw in 2020 and 2021 (3.4% and 4.6%, respectively). In most cases, my property manager attempted to raise the rent by 4-6% at the time of renewal. This is a bit higher than their typical approach, but to be fair, market rents were rising much faster than that. A couple of properties did not increase at all, due to multi-year leases.
Several properties achieved a double-digit percentage increase in their rent. Those were cases where my PM felt a larger increase was justified based on the market rent of that particular property. Properties #14 and #16 had the largest increases, due to newly placed tenants paying much more than the previous tenant who vacated.
A2 Change in Equity
While cash is king in rental property investing, appreciation is still part of the equation. Particularly when using leverage, small increases in home prices can mean big returns — you capture all the appreciation, even if you’ve only put 20% or 25% down on the house. You also get the paydown of mortgage principal on those properties, yet another way to create positive returns.
On the flip side, capital expenses must be considered in this section as well. As I’ve argued before, capital expenditures are not true expenses, and are better understood as increases in the cost basis of the home; therefore, capex reduces your appreciation, not your cash flow. Here is where that reduction in appreciation will come into play.
Let’s look at each of these pieces that are part of the equity calculation — true appreciation, mortgage paydown, and capex — and see where those numbers landed in my portfolio last year.
True Appreciation
This one is pretty simple: how much did the value of each home increase in the last year? I track home values using the Zillow Zestimate, which has its flaws but it is nonetheless a straightforward way to see changes over time, and takes my own personal bias out of the equation.
This year, home prices experienced another significant pop, which marks the third consecutive year of strong home price appreciation. Let’s compare my home values in January 2023 vs. January 2022:

Overall, my home values increased by about 11% last year, on top of a 33% increase the previous year and 13% the year before that. These increases have been historic, but as I’ve written about recently (here and here), the market has clearly shifted in response to rising interest rates and other factors, and we’re already seeing both home prices and rents flatten or even begin falling. So I would not be surprised at all to see negative numbers in this section of next year’s annual report.
The increase in the value of Property #18 is notable. This is my only duplex, and the increase seems to be the result of Zillow’s algorithm better understanding the value of duplexes vs. single family homes in the same neighborhoods. But true appreciation — i.e. investors being willing to pay more for duplexes than they used to — may also be a contributing factor.
Mortgage Paydown
Home equity also increases each month on leveraged properties due to the loan principal slowly being paid off. This is the portion of rental property returns that is pretty much guaranteed — and as a bonus, it accelerates over the life of the loan.
Here’s a picture of the reduction in loan balances I experienced in 2022, which added another $19K to my annual returns (you’ll notice that three of the properties have no mortgages):

It sure is nice to see your loans melt away over time! This is one of the numerous reasons why conventional mortgages are your precious “golden tickets”!
The percent reduction of each loan is a function of the loan’s interest rate: the higher the interest, the lower the percent paid off. The maturity of the loan also matters; the percent reduction will increase over time, but all these loans were originated within a few years of each other.
The reduction for Property #18 was less because the loan originated mid-year (which completed my first BRRRR!)
Capital Expenditures
While I have MORE equity due to appreciation and mortgage paydown, I have LESS equity due to capital expenditures, which increase the cost basis of the property — in other words, they increase my cash invested into the house.
My capital expenditures have gone up each year I’ve been tracking, as you can see:
2020: $10,882
2021: $16,915
2022: $21,772
Here’s how the 2022 capital spend breaks down:
Property #1: $3,122 for a new HVAC unit
Property #11: $745 for a new stove (I rarely own the appliances in my homes — and this is why!)
Property #14: $11,899 for a portion of the large turn scope of work (including lots of new flooring); and separately, a new HVAC unit
Property #16: $4,011 for new flooring
Property #18: $1,995 for a new HVAC condenser
While my CapEx was up this year, it’s still in a reasonable range. Investors use various methods to estimate and budget for capital expenditures. Some assume a percentage of the value of the properties each year, typically 1%. Others prefer to use a percentage of rent, usually 8% or 10%. Some prefer a fixed dollar amount per month per unit, such as $100.
Using each of these three methods yields slightly different values, but all of them are in line with my spend over the last three years:
1% of home value: $3.06M x 1% = $30,600 (this seems quite high now, thanks to the run-up in home prices)
8% of rent: $255K x 8% = $20,400
$100 per unit per month: 19 x 12 x $100 = $22,800
Total Change in Equity
Now let’s put all of these pieces together — appreciation, mortgage paydown, and capex — and calculate the total change in equity for the year:
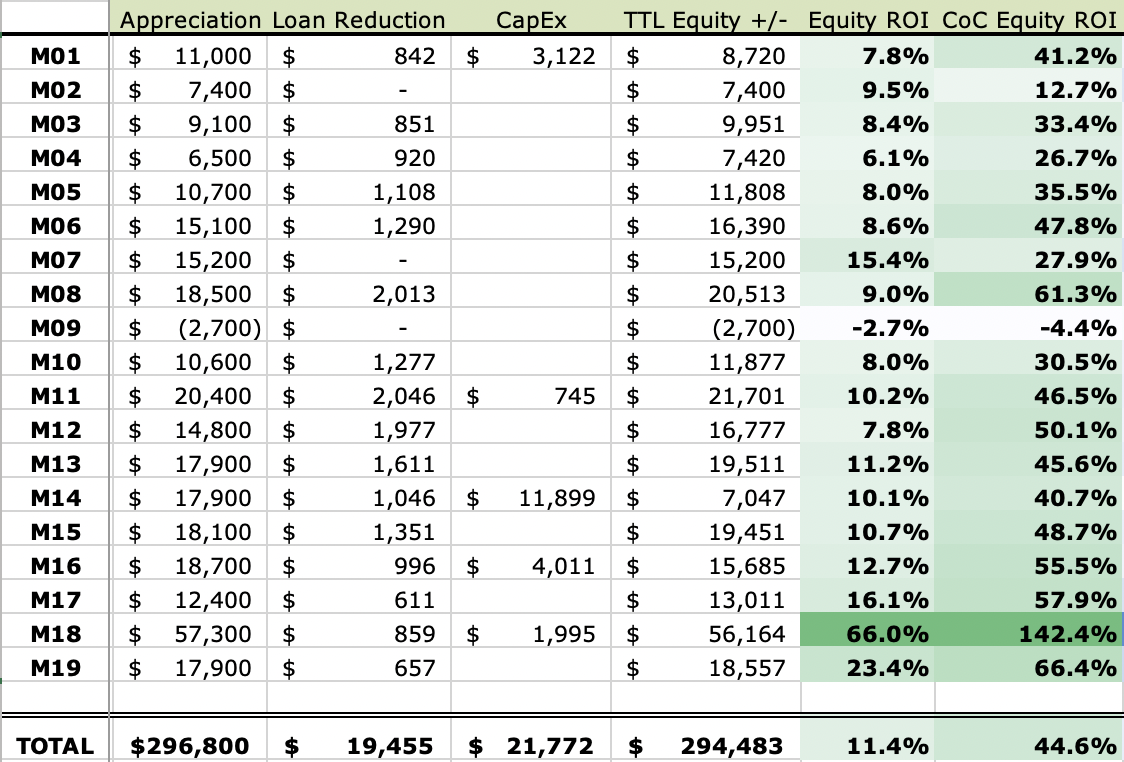
Let me explain the two ROI numbers I calculated here:
TTL Equity ROI: Compares the total change in equity to the value of the property at the beginning of the year.
CoC Equity ROI: Compares the total change in equity to the total cash invested into the property.
Said a different way, my total equity across these 18 properties grew at a rate of 11.4% relative to their value at the start of the year, and at a rate of 44.6% relative to the amount of cash I have invested in the properties.
For the third year in a row, these are truly excellent numbers. Ironically, increasing equity in my properties isn’t my main focus or goal — rather, it’s cash flow — and I therefore treat these long-term equity-building effects of rental property investing as “icing on the cake”. Needless to say, the last three years have had plenty of icing. That is almost certain to change in 2023, since home price appreciation has already ground to a halt. (I’ll still be paying off those mortgages, though!)
A3 Total Returns
To calculate total returns, we’re simply going to add together the cash flow and equity portions that we’ve already calculated. Total returns is an important number — particularly your rate of total returns on cash invested — because that’s what you would mentally compare against other types of investments. For example, the stock market has historically returned ~10% total returns (before adjusting for inflation); if your rental properties are yielding total returns on cash of 10% or more, then you can assume that you’re beating the stock market. (Yes, I know that doesn’t include real estate transaction costs, taxes, and other factors — but my epic Stocks vs. Rental Properties article contemplates ALL those factors, if you want to dive deep into that perennial debate.)
Anyway, here’s what my Total Returns look like for 2022, putting together all the numbers that we’ve looked at so far:

Here’s how I calculated the three rate-of-return metrics above:
Total ROI: Compares Total Returns to the value of the property at the beginning of the year.
Total RoE (Return on Equity): Compares Total Returns to my total equity in the property at the end of the year.
Total RoC (Return on Cash): Compares Total Returns to the total cash invested into the property.
Or said a different way, my Total Returns across these 18 properties were equal to 14.1% of their value at the start of the year, 20.8% of my current equity in the properties, and 54.9% of the amount of cash I have invested in the properties.
Despite having a good cash flow year, it’s obvious how much of these numbers were driven by price appreciation. In fact, the gains in equity were about 10x the gains achieved through cash flow. In that sense, the numbers are a bit deceptive, and I certainly don’t expect this rate of appreciation to continue. More important to me is that the portfolio continues to meet its expected rate of CASH returns, which I DO expect to continue, and which provides the foundation for the financial and work freedom that I currently enjoy. In other words, the huge jump in equity is nice, but I can’t buy groceries with home equity — instead, it’s the cash flow that was my ticket out of the office, and continues to provide me tremendous freedom & flexibility in my life.
B Tenancy Results
The second large section of the Annual Checkup will be a close look at tenancy. While these factors influence the financial results that we’ve already reviewed, it’s important to break them out separately to understand them — just as variable costs of maintenance & repairs can make or break a property’s financial results, so can your ability to keep your properties occupied with quality tenants.
Or, actually — your property manager’s ability to do so. Because my PM is fully responsible for keeping my properties occupied with strong tenants, this entire section is largely a reflection of their degree of success with this critical task.
B1 Occupancy Rate
This key metric is simply a measure of the percent of the time that your properties are occupied. (Just as often, the inverse metric, Vacancy Rate, is used — but I like Occupancy Rate better, simply for psychological reasons. It just seems more positive, right?) In my expense modeling, I always use a 5% vacancy factor (assuming 95% occupancy), because I know that some percentage of the time I won’t be collecting rent on properties, such as when they are being turned between tenants.
So the question here will be: did my portfolio exceed the 95% occupancy threshold that I budgeted for?
Calculating vacancy rate is pretty simple. Each combination of a month and property (i.e. April at Property #3) is a slot to be potentially filled — this serves as the denominator of the fraction. The number of slots that were, in fact, occupied, is the numerator. For example, if you owned two properties for the full year, that’s 24 “tenant month” slots; if the first property had no vacancy, and the second property was vacant for 1 month, that’s 23 out of 24 tenant months that were actually occupied. So your occupancy rate would be 23 divided by 24, or 95.8%.
One quick caveat: I count a property as occupied if I’m collecting rent on it, whether or not a tenant is actually living there. For example, in a lease break situation where I retain a 1-month security deposit after the tenant moves out, I count the property as occupied for that additional month. Conversely, if a tenant IS in place but I’m never able to collect rent for that month, then I count the property as vacant. This aligns with my pro forma modeling, which does not budget for vacancy in the strict sense of the word, but instead for months where rent is not collected.
Using this math across my 2022 portfolio, here’s what I found:

In total, these 19 properties maintained nearly 99% occupancy in 2021. This is a great result that is much better than my modeled expectations.
Blue highlights indicate periods of a tenant turnover. As you can see, I had only two turns in 2022, which I’ll discuss in more detail in the section below.
Red highlights indicate evictions. As you can see, they cam take a long time to resolve — the eviction at Property #9 went on for over 10 months (!). But the good news is that I ended up receiving ALL the back-rent owed thanks to some local rental assistance agencies. This caused occupancy to exceed 100% for the year at this property, which drove up my overall occupancy rate as well.
B2 Tenant Turns
Turning properties between tenants is a big driver of cost in any rental portfolio. It’s the dreaded “double whammy”: not only do you have to pay for the work to get the property ready for the next tenant, you’re also not collecting any rent during that period. (To add insult to injury, you also have to pay for utilities and lawn care during the turn — so it’s nearly a triple whammy!)
Proper management of tenant turns can therefore be a critical way to ensure the success of rental property investments. There are three primary objectives when it comes to turns, and they’re all worth monitoring in my annual checkup. In a perfect world, I want turns to be:
Infrequent. By screening tenants properly upfront, providing them with a quality home, and responding professionally to any issues they’re having, my PM can make it more likely that tenants will stay longer, which decreases the number of turns I have to do in any given year.
Short. If turns must occur, I want them to be as short as possible. This is a measure of how efficiently my PM can complete the rent-ready work, and get a new tenant in place.
Inexpensive. If the home was maintained properly during the tenancy (by both the tenant and the PM), and if the property was up-to-standard beforehand, then turns should be relatively cheap; if not, they can get quite costly.
Let’s see how well I achieved those three turn objectives in 2022.
Frequency
How often should you expect to turn a property? The less the better, of course — but I want my tenants to stay at least 3 years, on average. This means that in any given year, I should expect to turn about a third of my properties. We’re examining 19 properties in 2021, so turning 6 properties would have been an average year by this standard.
Instead, I only turned 2 properties — #14 and #16. This is much lower than anticipated, and continues a trend that I observed in the last two years. Across those three years, in fact, I’ve only turned a total of 8 properties. This indicates that my tenant “churn” has been much slower so far than my baseline expectations, which is great news for my occupancy rates and overall performance of my portfolio.
Duration
Were those two turns performed efficiently? Let’s take a close look at them:

This is a mixed bag. In general, I’d say that any turn completed in less than 30 days is a huge win, and anything under 60 days is acceptable. Only when the turn stretches into its third month would I become concerned and disappointed. The turn at Property #16 came in at exactly 2 months, which I’m happy with given that the scope of work was relatively large. The scope at Property #14 was enormous, which is part of the reason it clocked in at 89 days — the work itself took 6 weeks to complete.
While these durations aren’t disastrous by any means, the most disappointing part is that in both cases, my PM took two weeks to deliver the SOW to me. (I approved both very quickly; the delay was in receiving it from my PM.) Their own standard is 3-5 days to deliver the SOW to me, so the 2-week interval here is quite slow — and when it comes to turns, time is money. I’ll be sure to keep a close watch on this for my turns this coming year, and press my PM to avoid these costly delays.
Cost
As we’ve already seen, turns were a major driver of my maintenance expenses in 2022, just as they were last year. A year ago I noted that my initial turns (the first ones I perform after buying the properties) may be a little more expensive as I get them up to standard in certain areas, and that costly turns may therefore be a fact of life for me for several years to come, since I chose to buy many of my properties when they were occupied with tenants, and only a handful of my houses were full turnkey properties when I bought them.
That prediction was right on the mark. Both my turns this year were “first turns” on properties that I bought occupied, and one of them I knew was not in good condition. And both were quite expensive, including large maintenance & repair costs (summarized below), as well as significant CapEx on top of that.
I expect a typical turn to cost between $2,000 and $4,000 — any turn under $2,000 is cheap, and one that exceeds $4,000 is relatively expensive. Here’s a glance at the two turns I did in 2022, and their costs:

Conclusion
Finally, here is the dashboard for my portfolio in 2022, incorporating all the key areas and metrics we’ve reviewed in this article:

Here are my key takeaways from this annual checkup:
Overall, it was a very good year. I hit my cash flow targets, and continued price appreciation fueled high rates of return on my invested dollars. I expect price appreciation in the next few years will be much lower.
My cash flow model is (basically) sound. The portfolio is producing the cash that it’s supposed to, which gives me confidence to continue to acquire properties using the same assumptions that are built into the RIA Property Analyzer. But maintenance cost assumptions need a tweak (see below).
My property managers are getting the job done. From occupancy rate to rent increases to management of turns, my PMs have been reliable stewards of my portfolio. I can always nitpick here and there, but in the big picture, they are delivering.
Maintenance expenses were very high, and costly first turns continue to be a driver of expense. Because this is the third consecutive year that I’ve observed this pattern, I will increase my maintenance cost assumptions going forward — an adjustment that will take effect in my January 2023 monthly report.
About the Author
Hi, I’m Eric! I used cash-flowing rental properties to leave my corporate career at age 39. I started Rental Income Advisors in 2020 to help other people achieve their own goals through real estate investing.
My blog focuses on learning & education for new investors, and I make numerous tools & resources available for free, including my industry-leading Rental Property Analyzer.
I also now serve as a coach to dozens of private clients starting their own journeys investing in rental properties, and have helped my clients buy millions of dollars (and counting) in real estate. To chat with me about coaching, schedule a free initial consultation.