Memphis Rental Property #11

Last updated: 2026
NOTE: This post was published in 2026, but the property was bought in 2019. Refer to the Annual Updates section at the end of the article to see how the property has fared since the time of purchase.
Say hello to Property #11 in my Memphis rental portfolio! This was one of the 14 I houses I purchased very quickly from May to September of 2019 — my opening acquisition sprint after I left my “first career” in retail, sold my NYC condo to become a renter, and used the proceeds to start building a portfolio that would generate real cash.
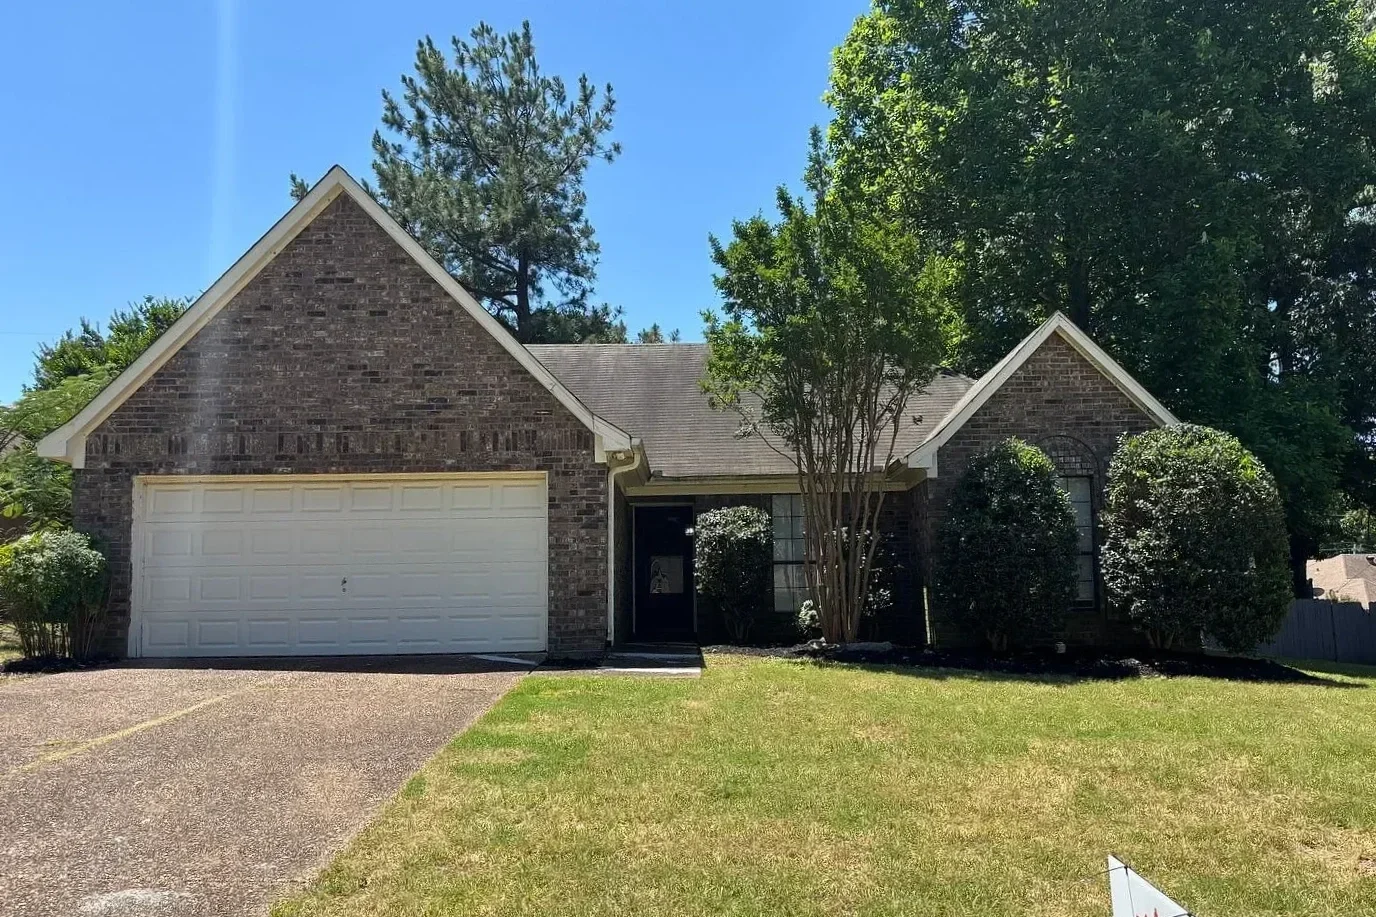
This is one of the nicer houses in my portfolio — in fact, it’s arguably THE nicest. It sits within a very nice B/B+ neighborhood in the 38135 zip code that was developed in the mid-1990’s. By that time, we were building homes a bit more familiar to modern sensibilities, with more space, higher ceilings, and more. It also holds the record for the highest purchase price I ever paid for a property, at $159,000.
This one stretched into a higher price lane, and didn’t have great price-to-rent ratio out of the gates. But as you’ll see, it has still turned into a very solid investment over time.
Alright, let’s take a closer look at this house and deal!
Property #11: The Deal
This one was sourced from a turnkey provider, but not in the traditional way: the provider had purchased the property 9 months prior, but because it was in very good shape, he only did a light rehab and placed a tenant. I bought the property with that tenant in place — so while the home was in good condition, it wasn’t a TRUE turnkey, and did not have new roof, HVAC, etc.
As I mentioned, I bought the house for $159,000, and there was a tenant in place at $1,350. Not the strongest price-to-rent ratio, falling way short of the 1% rule…but we’ll see the full numbers below.
Here are some additional facts about this particular house:
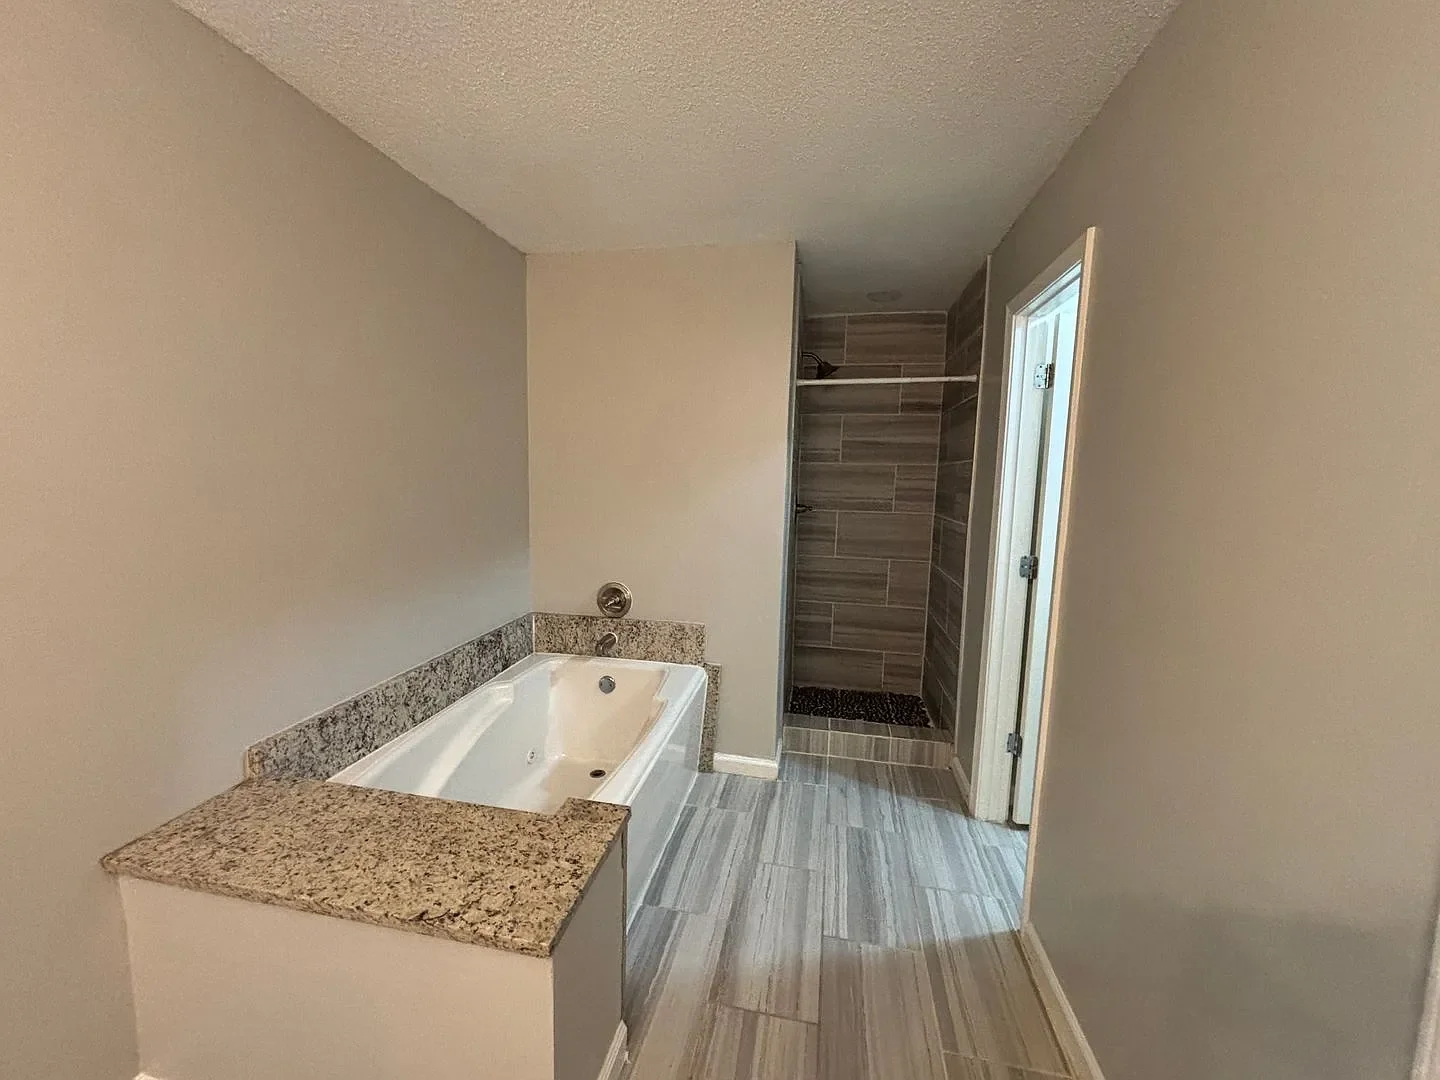
3-beds, 2 full bath
In the 38135 zip code, great neighborhood
Built in 1996
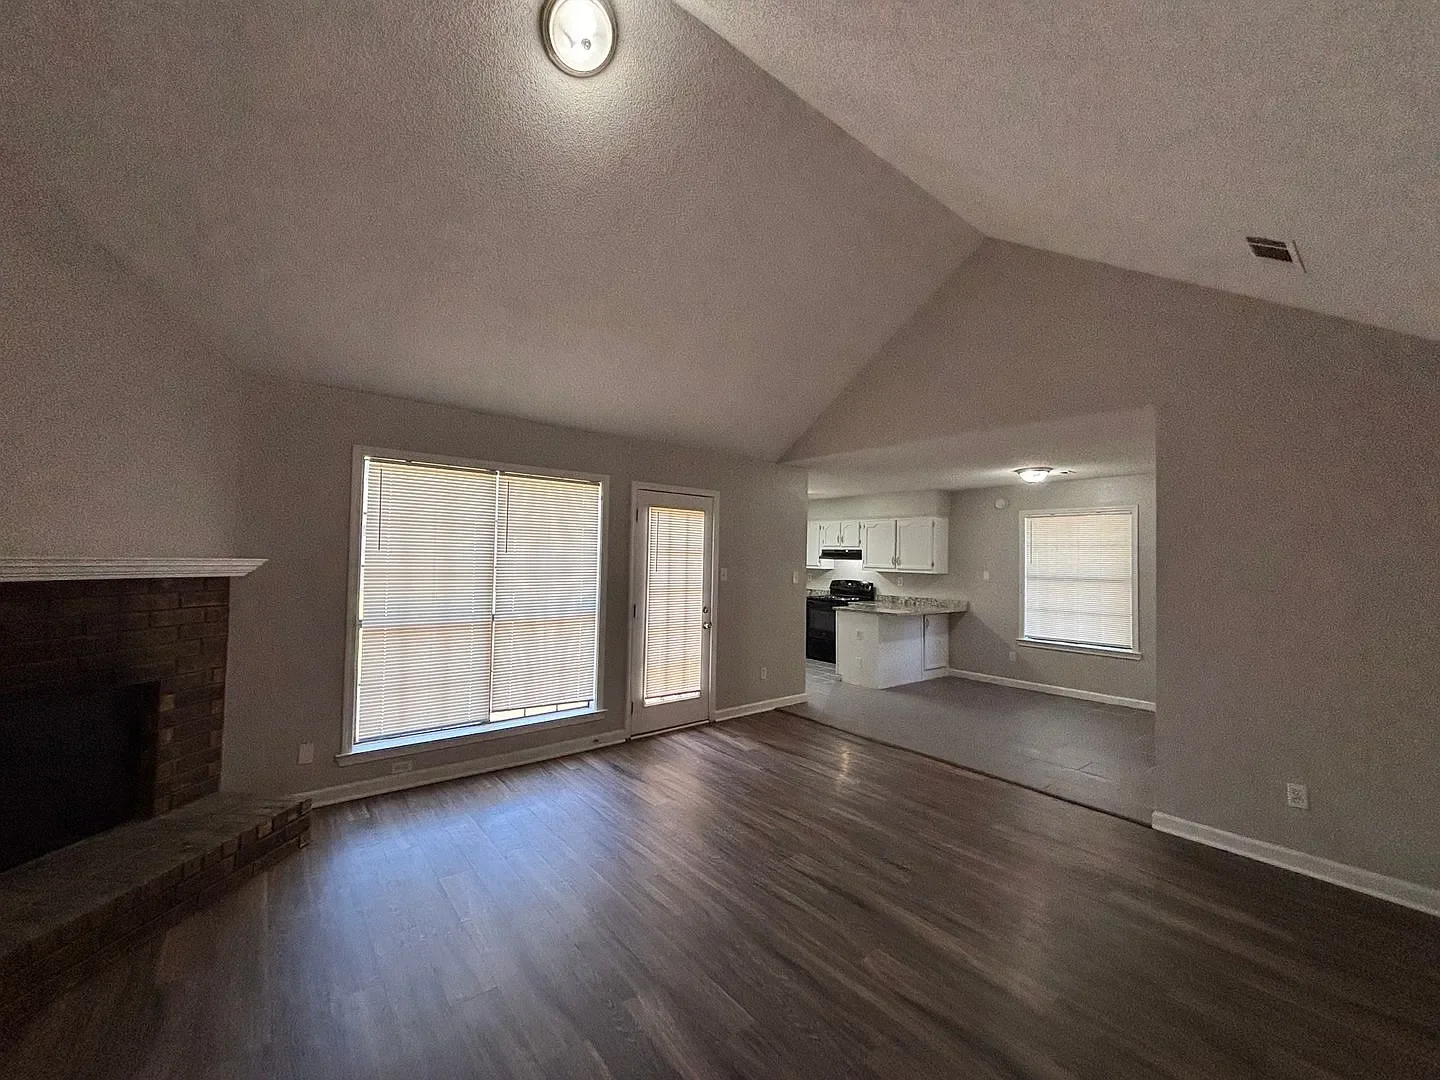
1466 square feet of interior space (spacious compared to nearly all other 3/2’s in the portfolio)
Central air
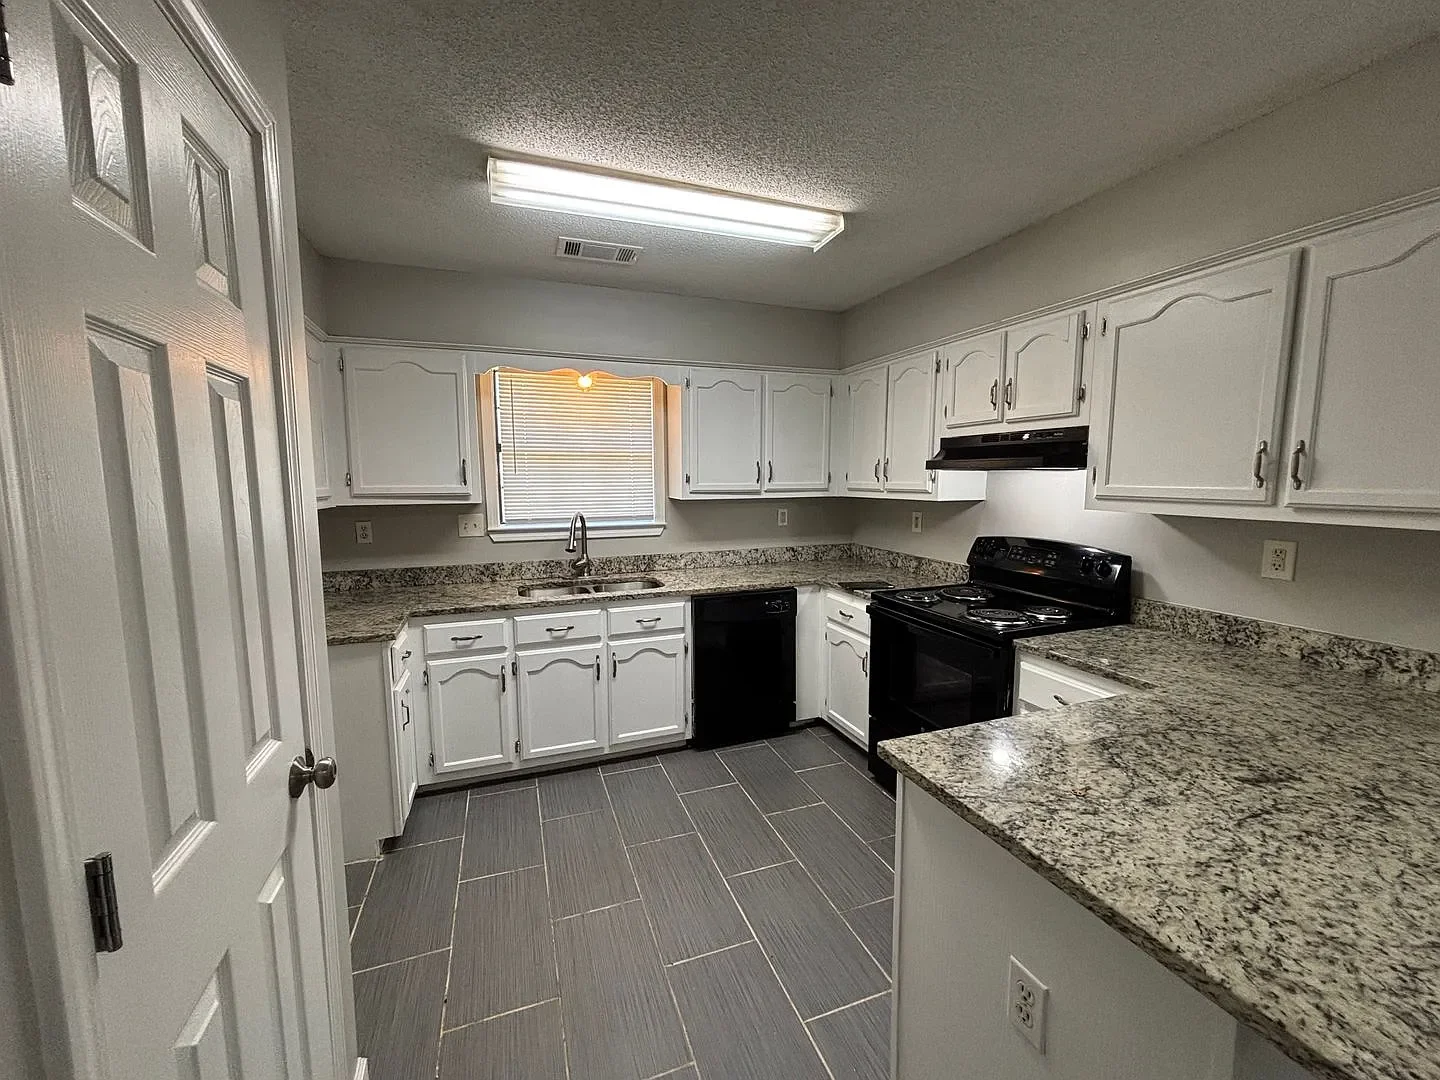
Tile & LVP floors centrally; carpets in bedrooms (I later replaced these with LVP in 2025 turn)
Driveway, 2-car attached garage
Tenant in place paying $1,350/mo.
Property #11: Due Diligence
My turnkey provider had already done a full home inspection, and shared this with me. It was quite clean, other than finding that the water heater and HVAC systems were both near end of life. (And, true to form, they have both since been replaced.)
The tenant had lived in the property for 9 months, and had a perfect record of payment. They also kept the property up nicely, so I was confident inheriting this tenant. (Though that would later change…check out Annual Updates at the end!)
The house appraised just above the purchase price, with no repairs needed, and we closed at the end of May 2019.
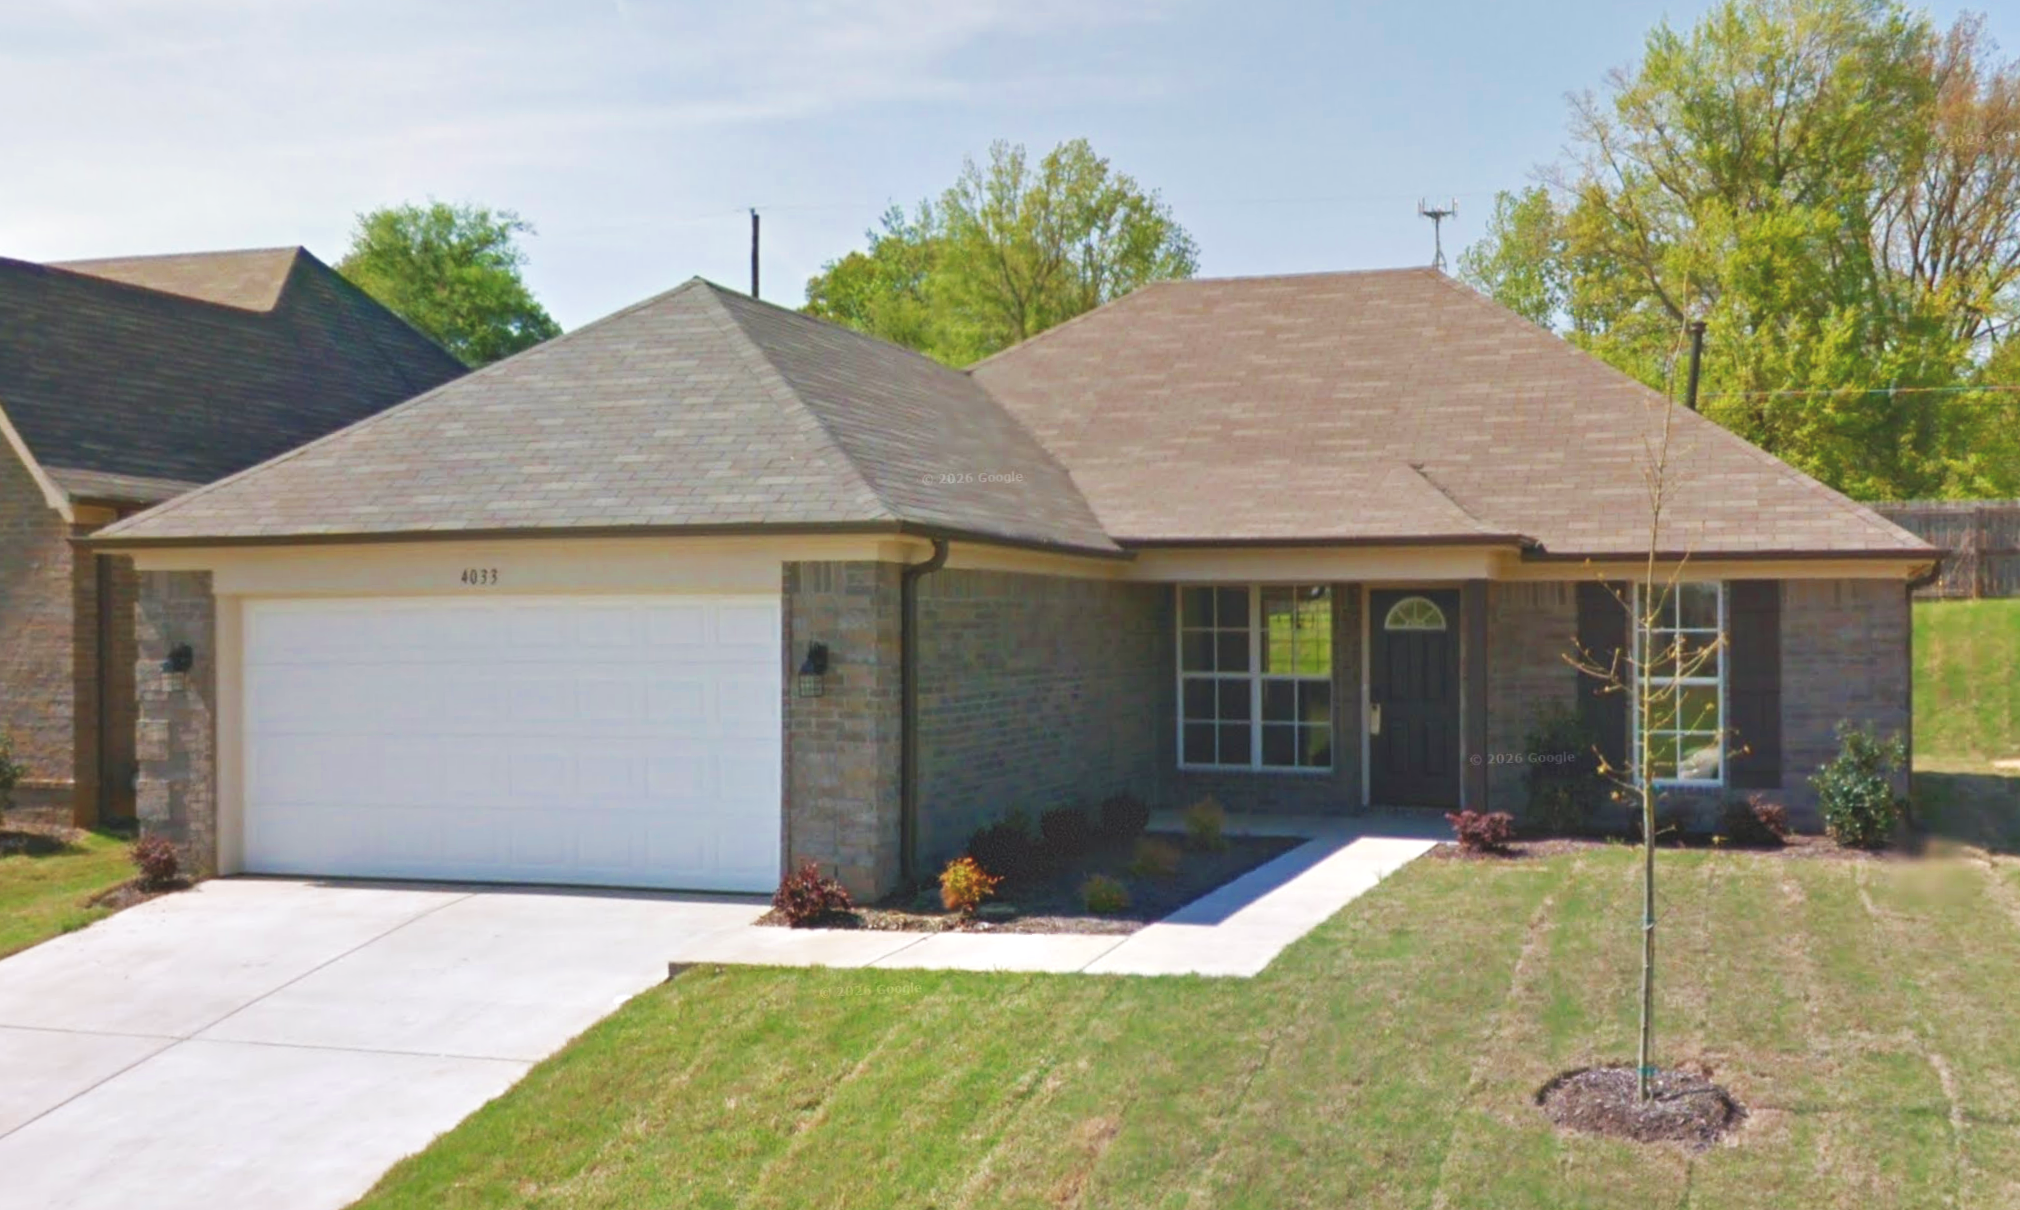
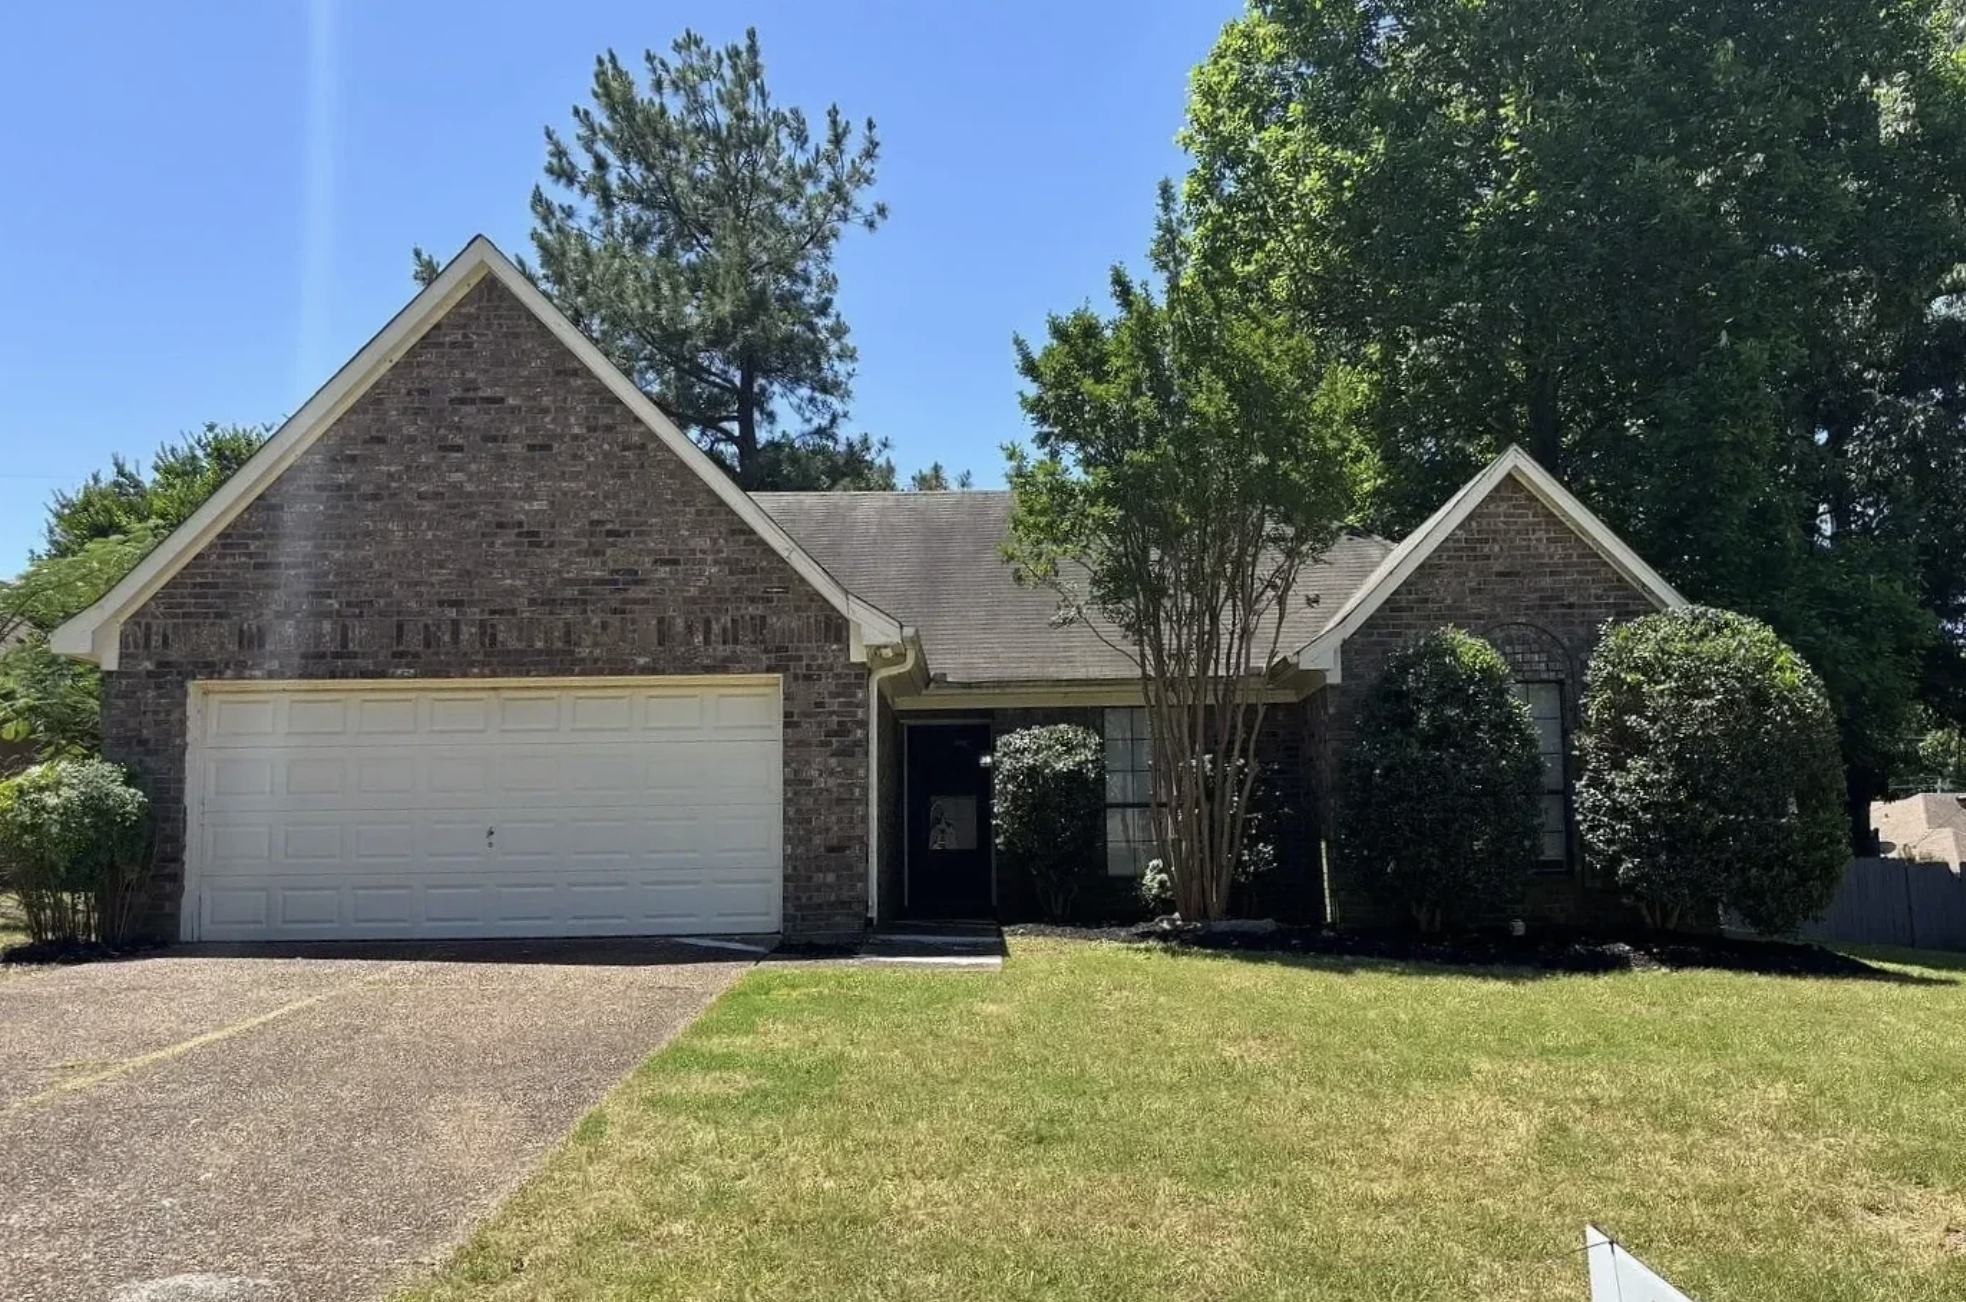
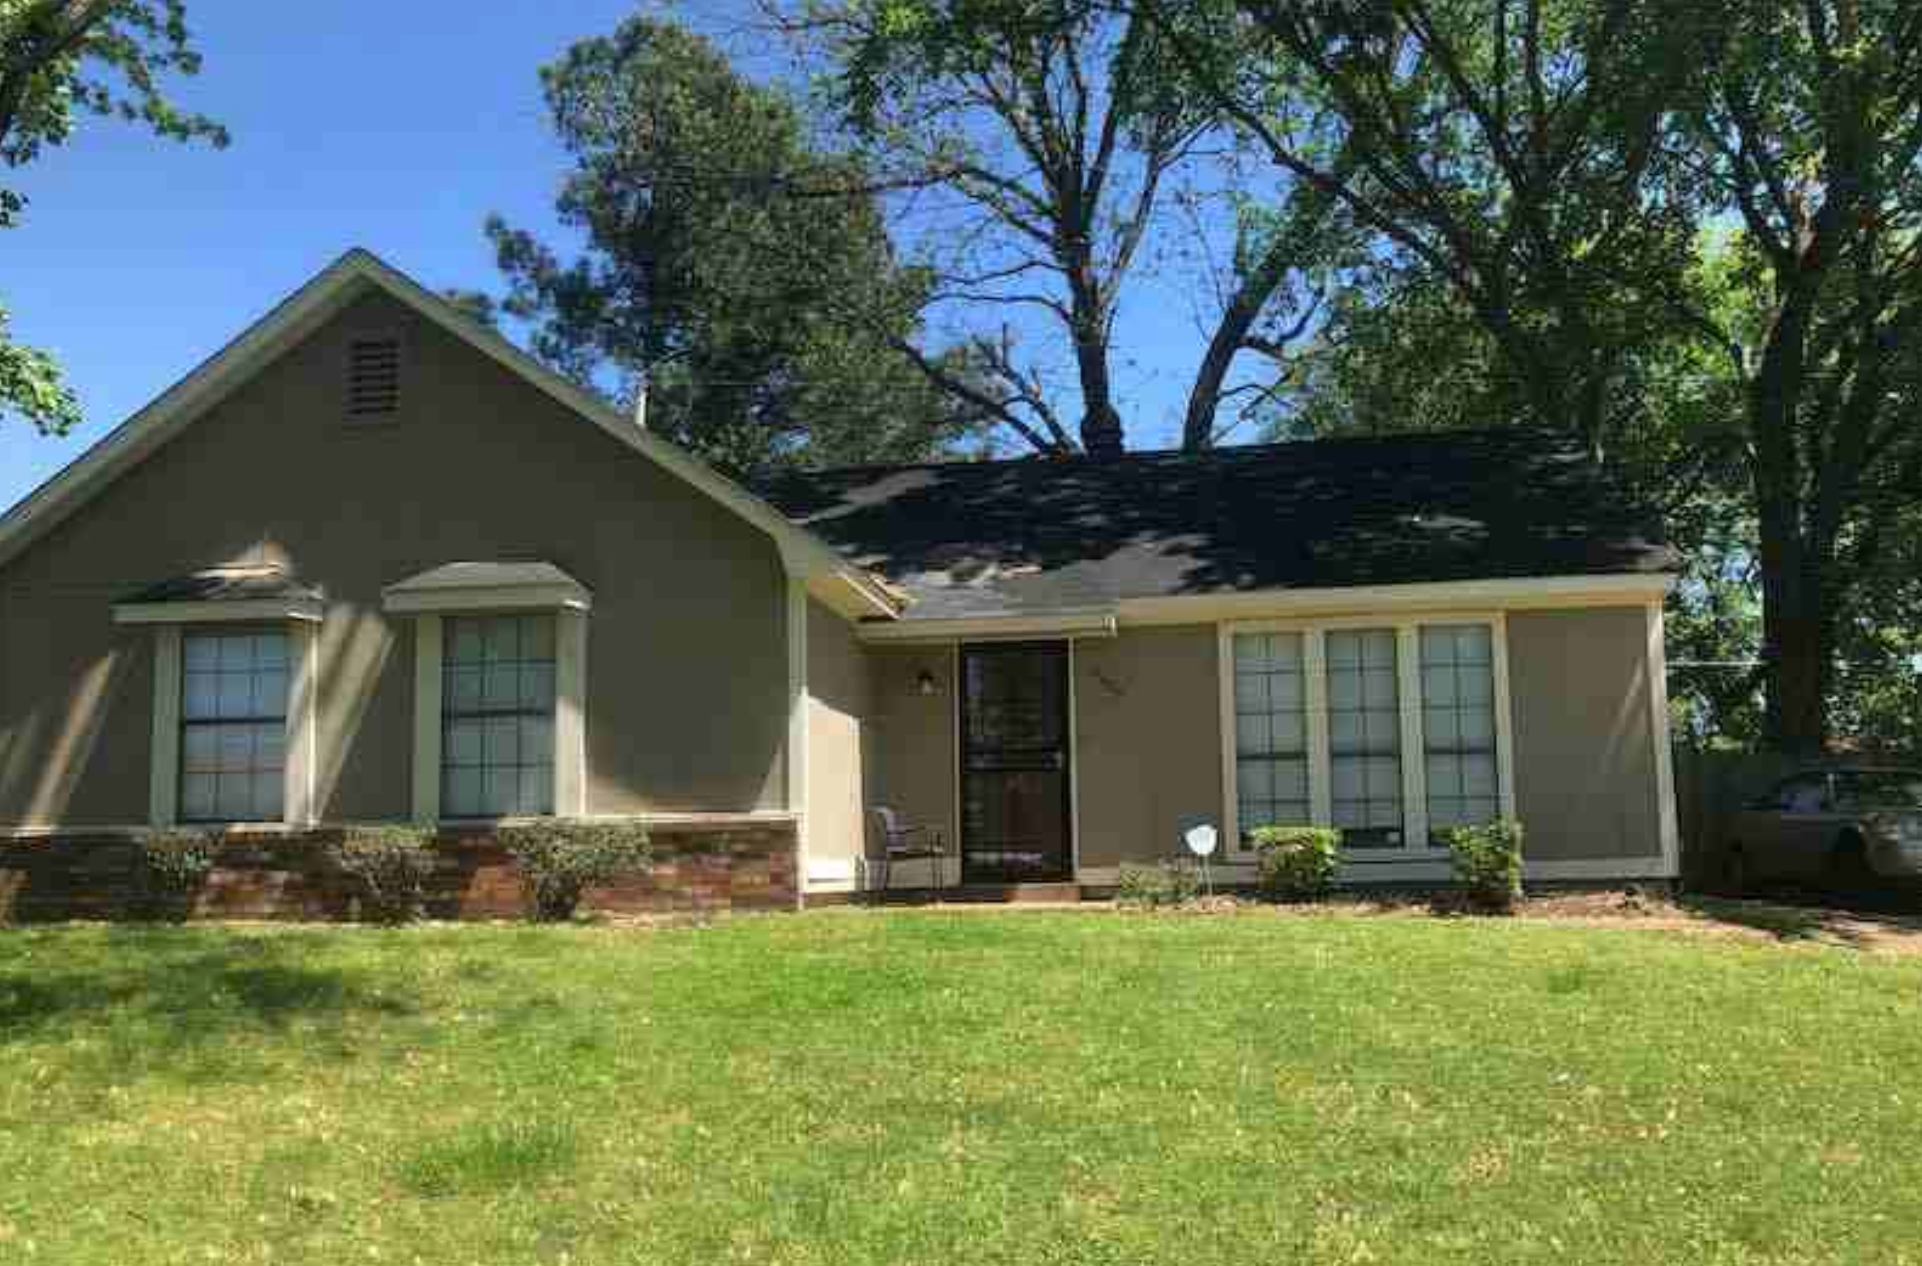
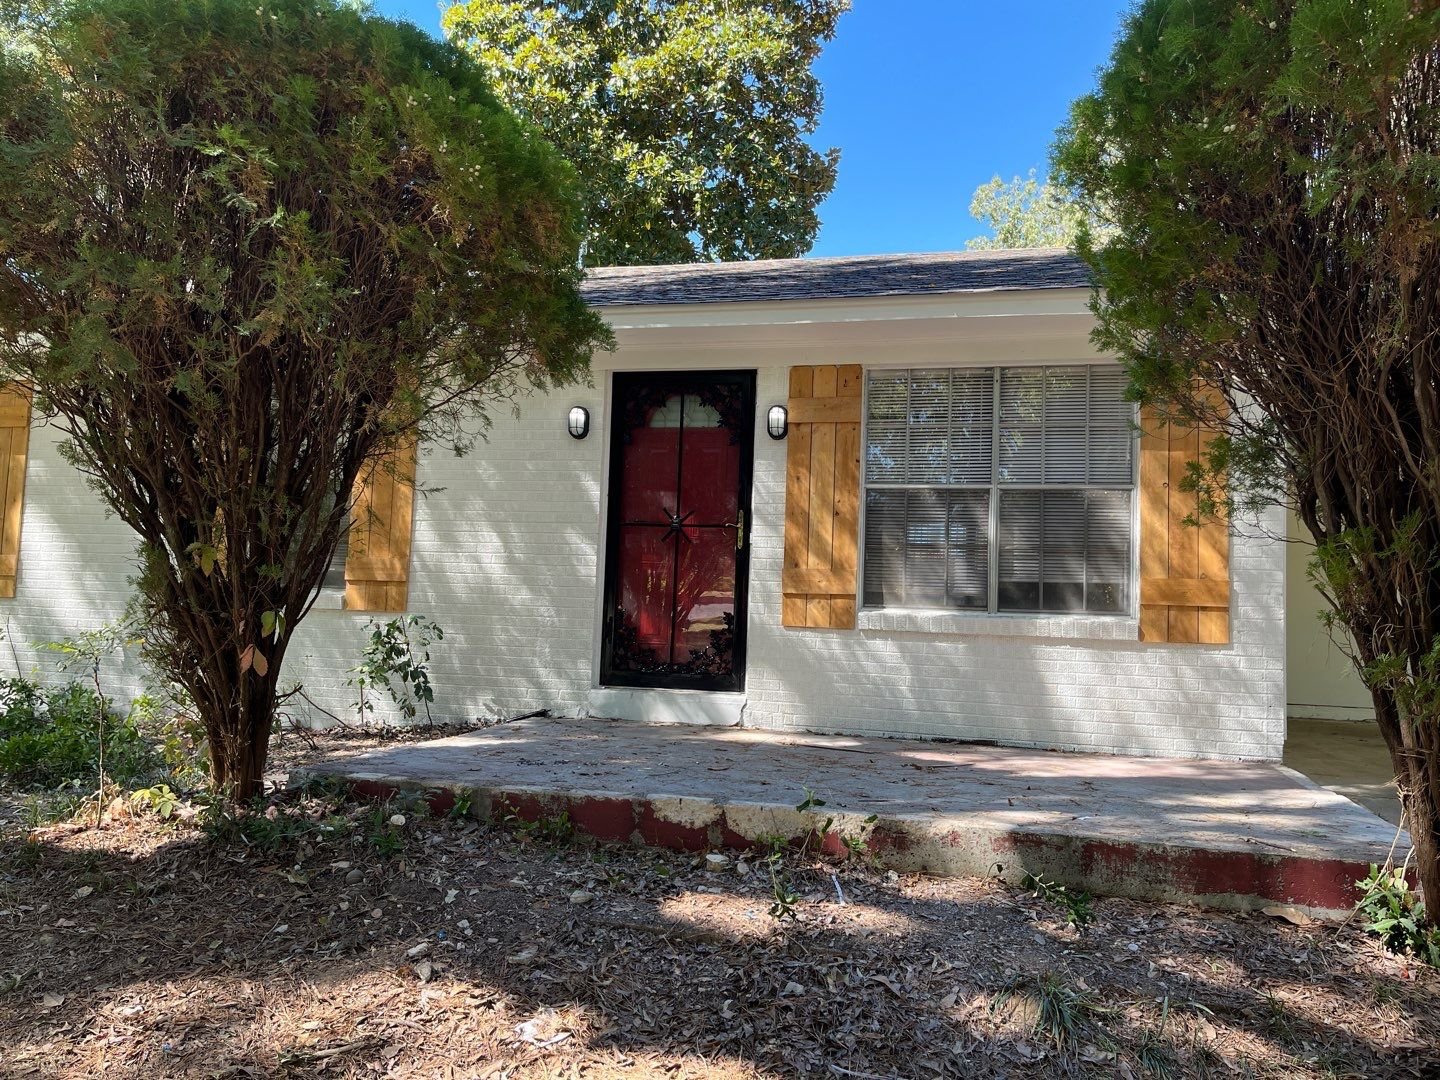
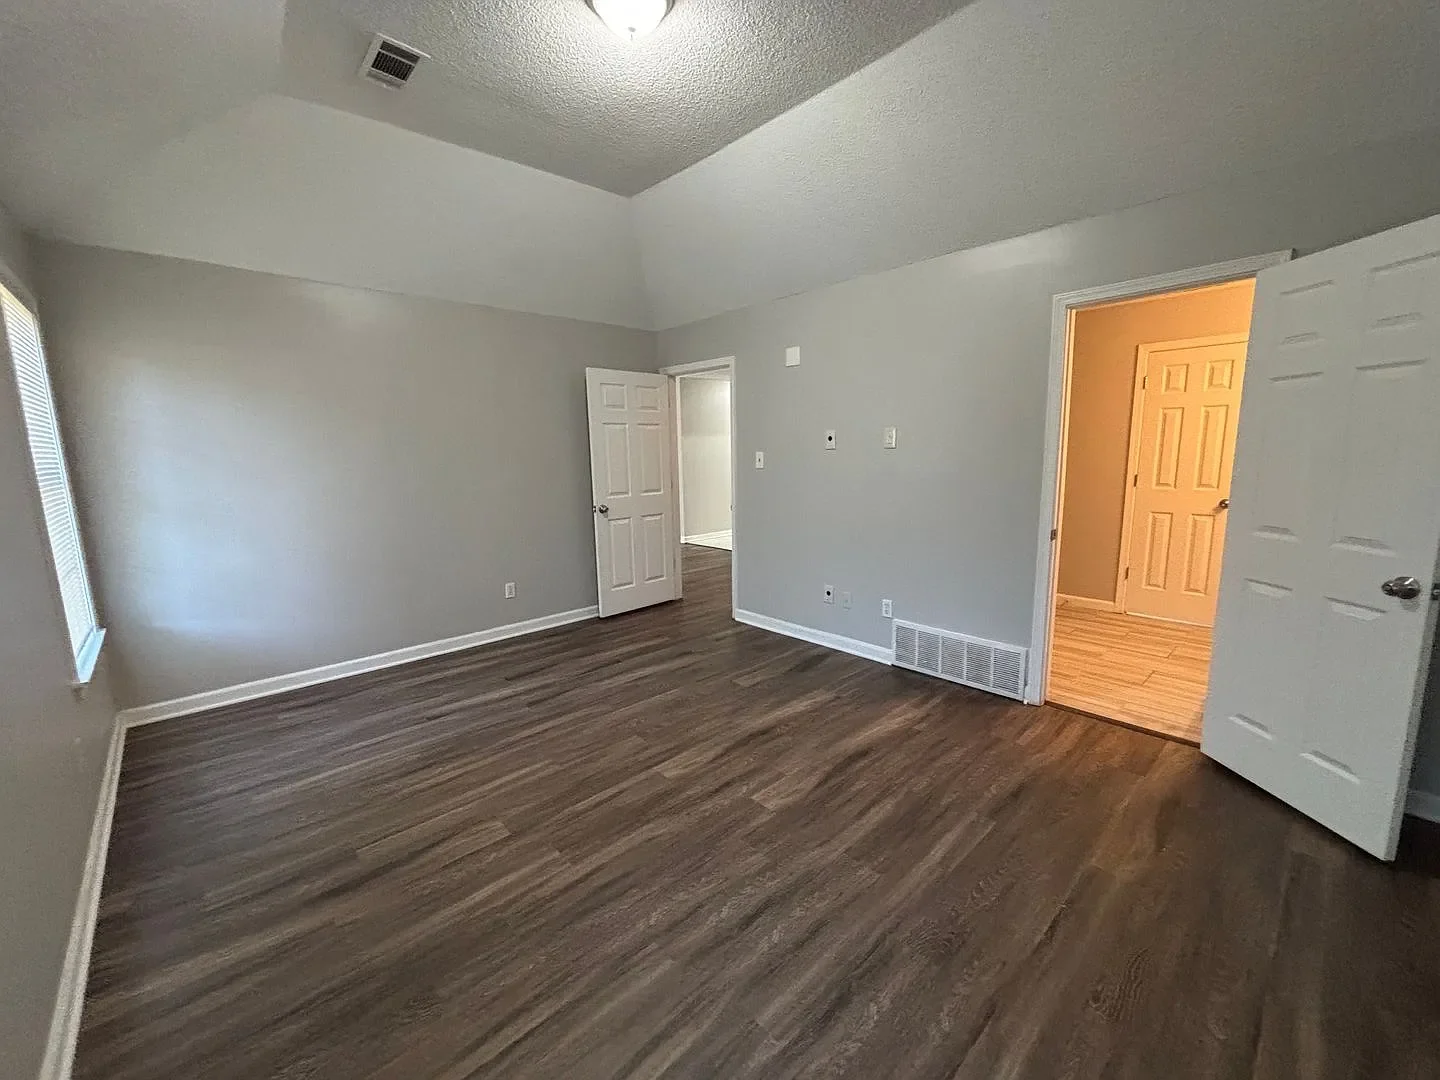
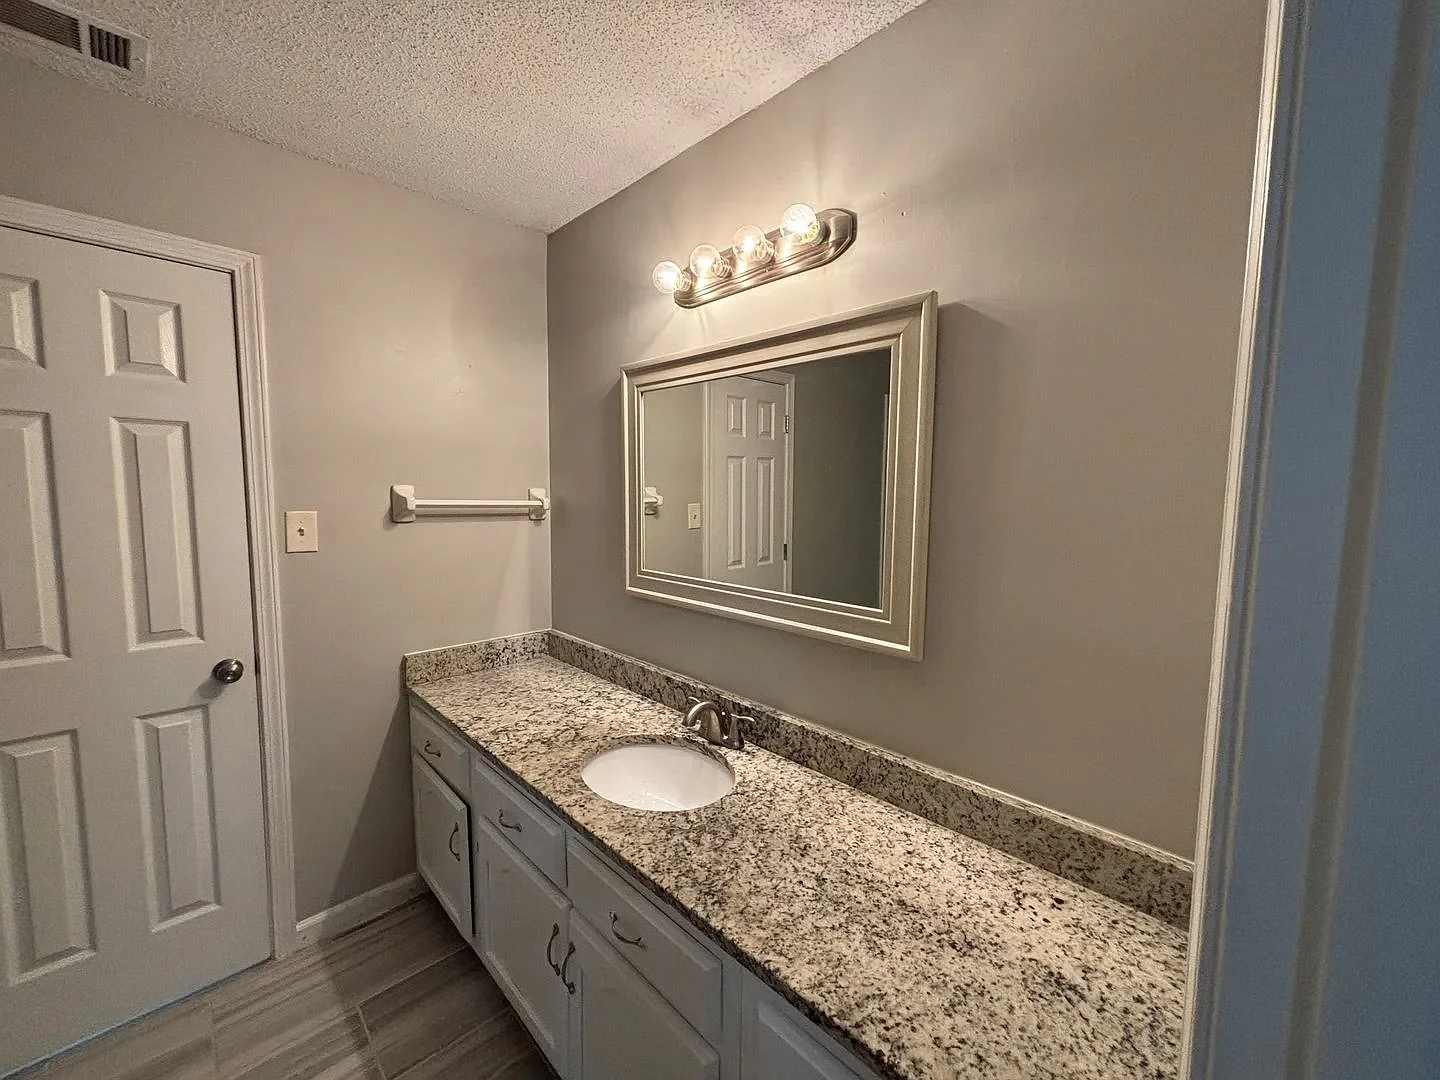
Here’s what the house looks like (note these are from a more recent 2025 rental listing, so I had already done a bit of work like replacing carpets with LVP, but you can still get the idea:
Property #11: The Financials
I secured a conventional 30-year fixed rate loan at 4.875%, with a 25% down payment. Like many of my other loans, this mortgage is actually in my spouse’s name alone, a strategy you can use as a married couple to expand your access to conventional financing (max of 20 loans vs. the normal 10).
One other interesting thing about this house is that it sits in an “unincorporated” area of town, which means that no city taxes are due (not to Memphis, nor any of the other incorporated places surrounding Memphis, such as Bartlett, Germantown, and others.) This makes the tax burden lower on this house than it would otherwise be.
I used the RIA Property Analyzer to re-create the initial numbers on this property, so you can see what the numbers would have looked like back in 2019 when I bought it:
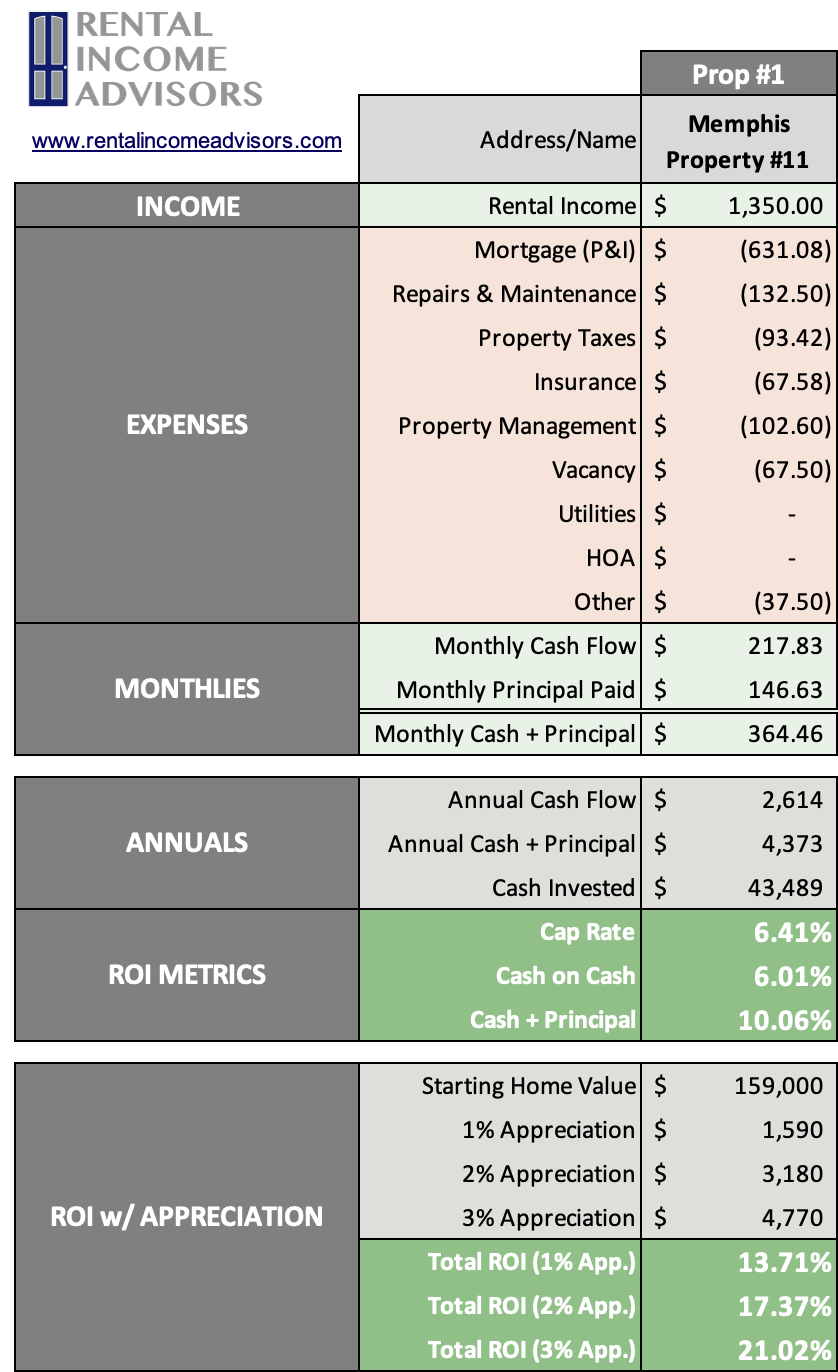
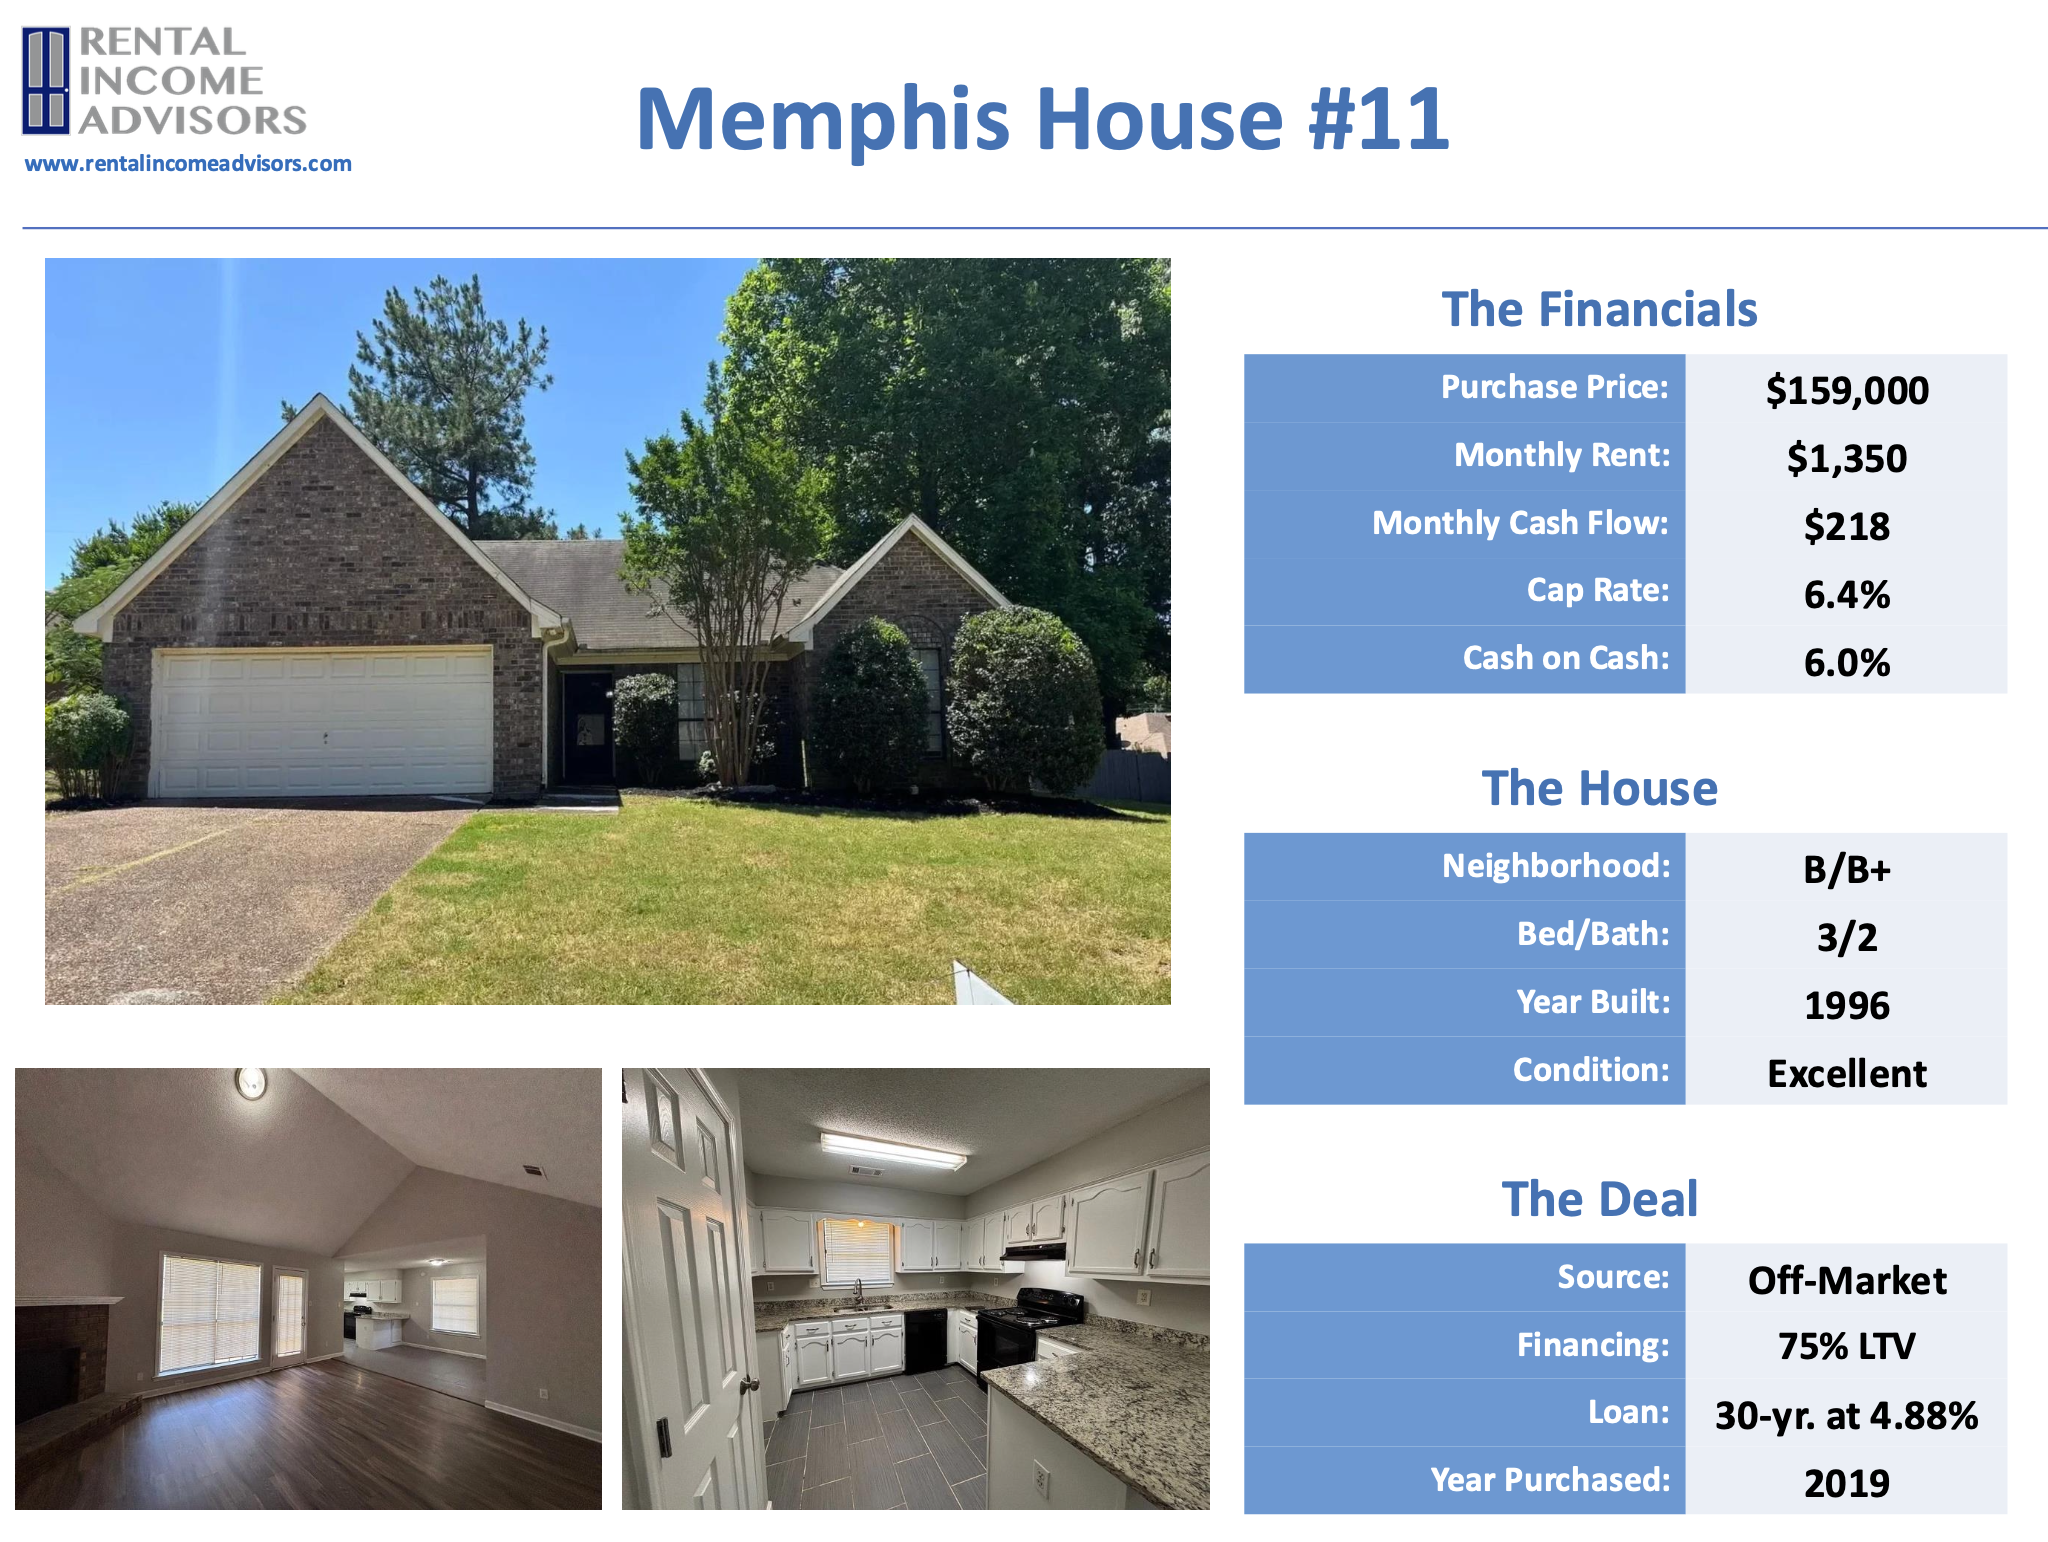
Purchase Price: $159,000
Monthly Rent: $1,350
Monthly Cash Flow: $218
Cap Rate: 6.4%
Cash on Cash Returns: 6.0%
Total ROI 2% Appreciation: 17.4%
(Want to use this calculator? It’s free!)
OR
Using the multi-year model in the RIA Property Analyzer, we can visualize some of the main long-term trends assuming a long-term inflation rate of 2%:
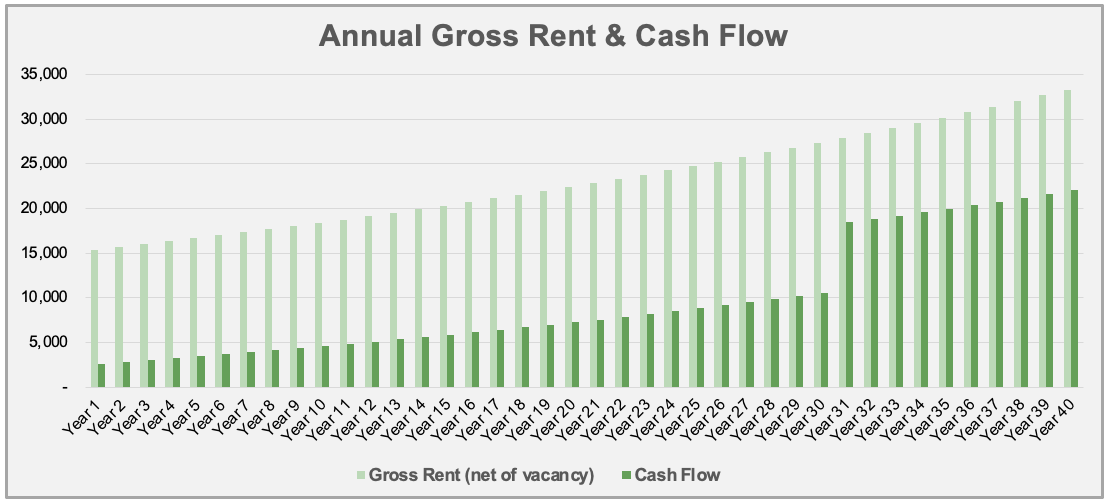
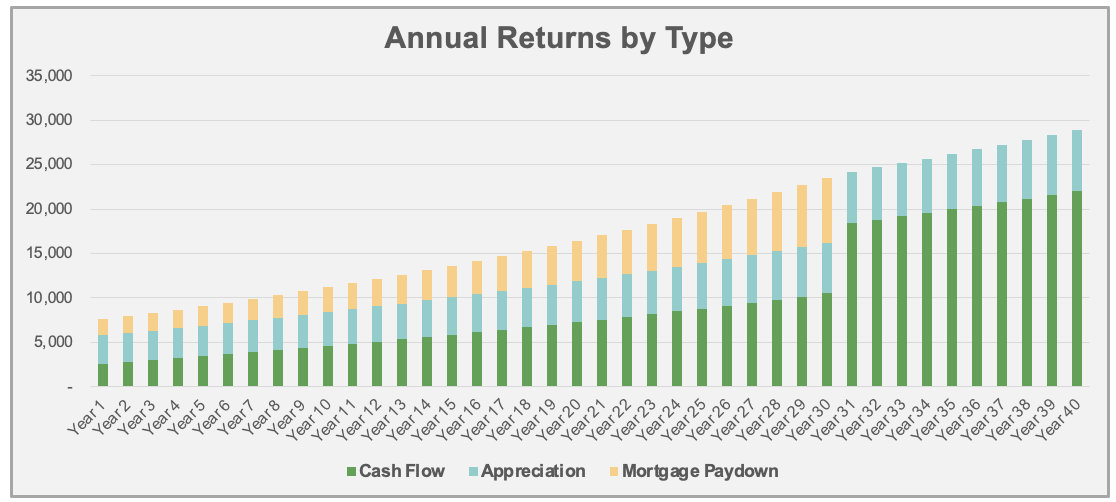
Cash flow increases over time. This is mostly because rent and expenses are expected to rise with inflation, but one major expense (my mortgage) is fixed.
Cash Flow Year 1: $2,614
Cash Flow Year 10: $4,601
Cash Flow Year 25: $8,812
Mortgage paydown accelerates over time. This is because of the way banks amortize loans – each month, a little bit more of your fixed payment is principal, and a little bit less is interest.
Mortgage Paydown Year 1: $1,799
Mortgage Paydown Year 10: $2,788
Mortgage Paydown Year 25: $5,784
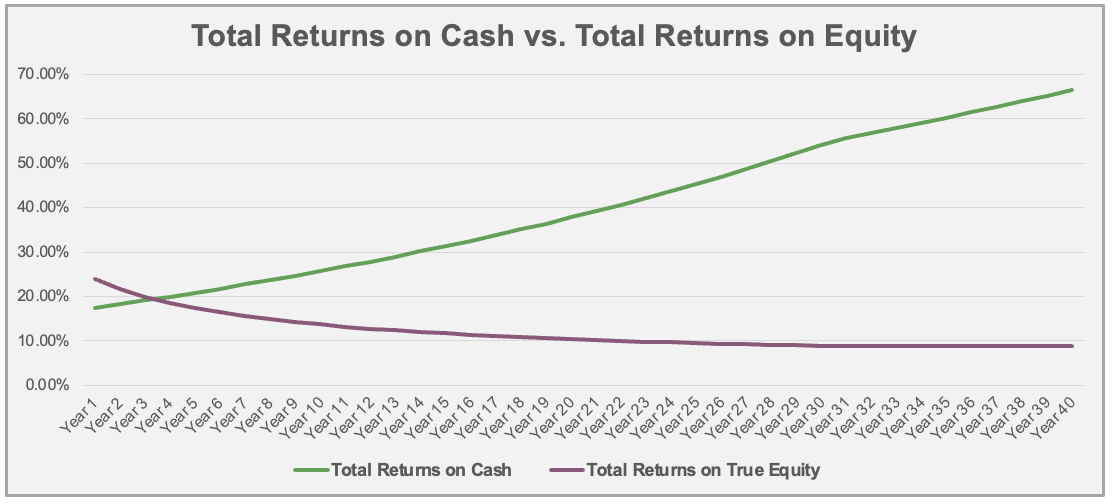
Total returns on cash increases over time. This is a consequence of the first two graphs – I will make greater total returns over time on the same initial investment of cash.
Total Returns on Cash Year 1: 17.5%
Total Returns on Cash Year 10: 25.7%
Total Returns on Cash Year 25: 45.3%
Overall, this property offered somewhat lower cash returns than others in my portfolio. But that makes sense given that it was the highest-priced property I bought, in the best neighborhood. In rental investing, there’s always an inverse relationship between home price and yield, and that bears out here. But it’s a great house that’s desirable to tenants and should produce great long-term Total ROI.
Property #11: The Deal Sheet
Finally, to sum up Property #11 and its financials, here’s the full “deal sheet”:
Looking for YOUR Next Property?
If you need help finding, analyzing, and purchasing YOUR next property — or your first one! — schedule a free initial consultation with me. I’ve helped over 120 private coaching clients invest with confidence and build cash-flowing rental portfolios of their own.
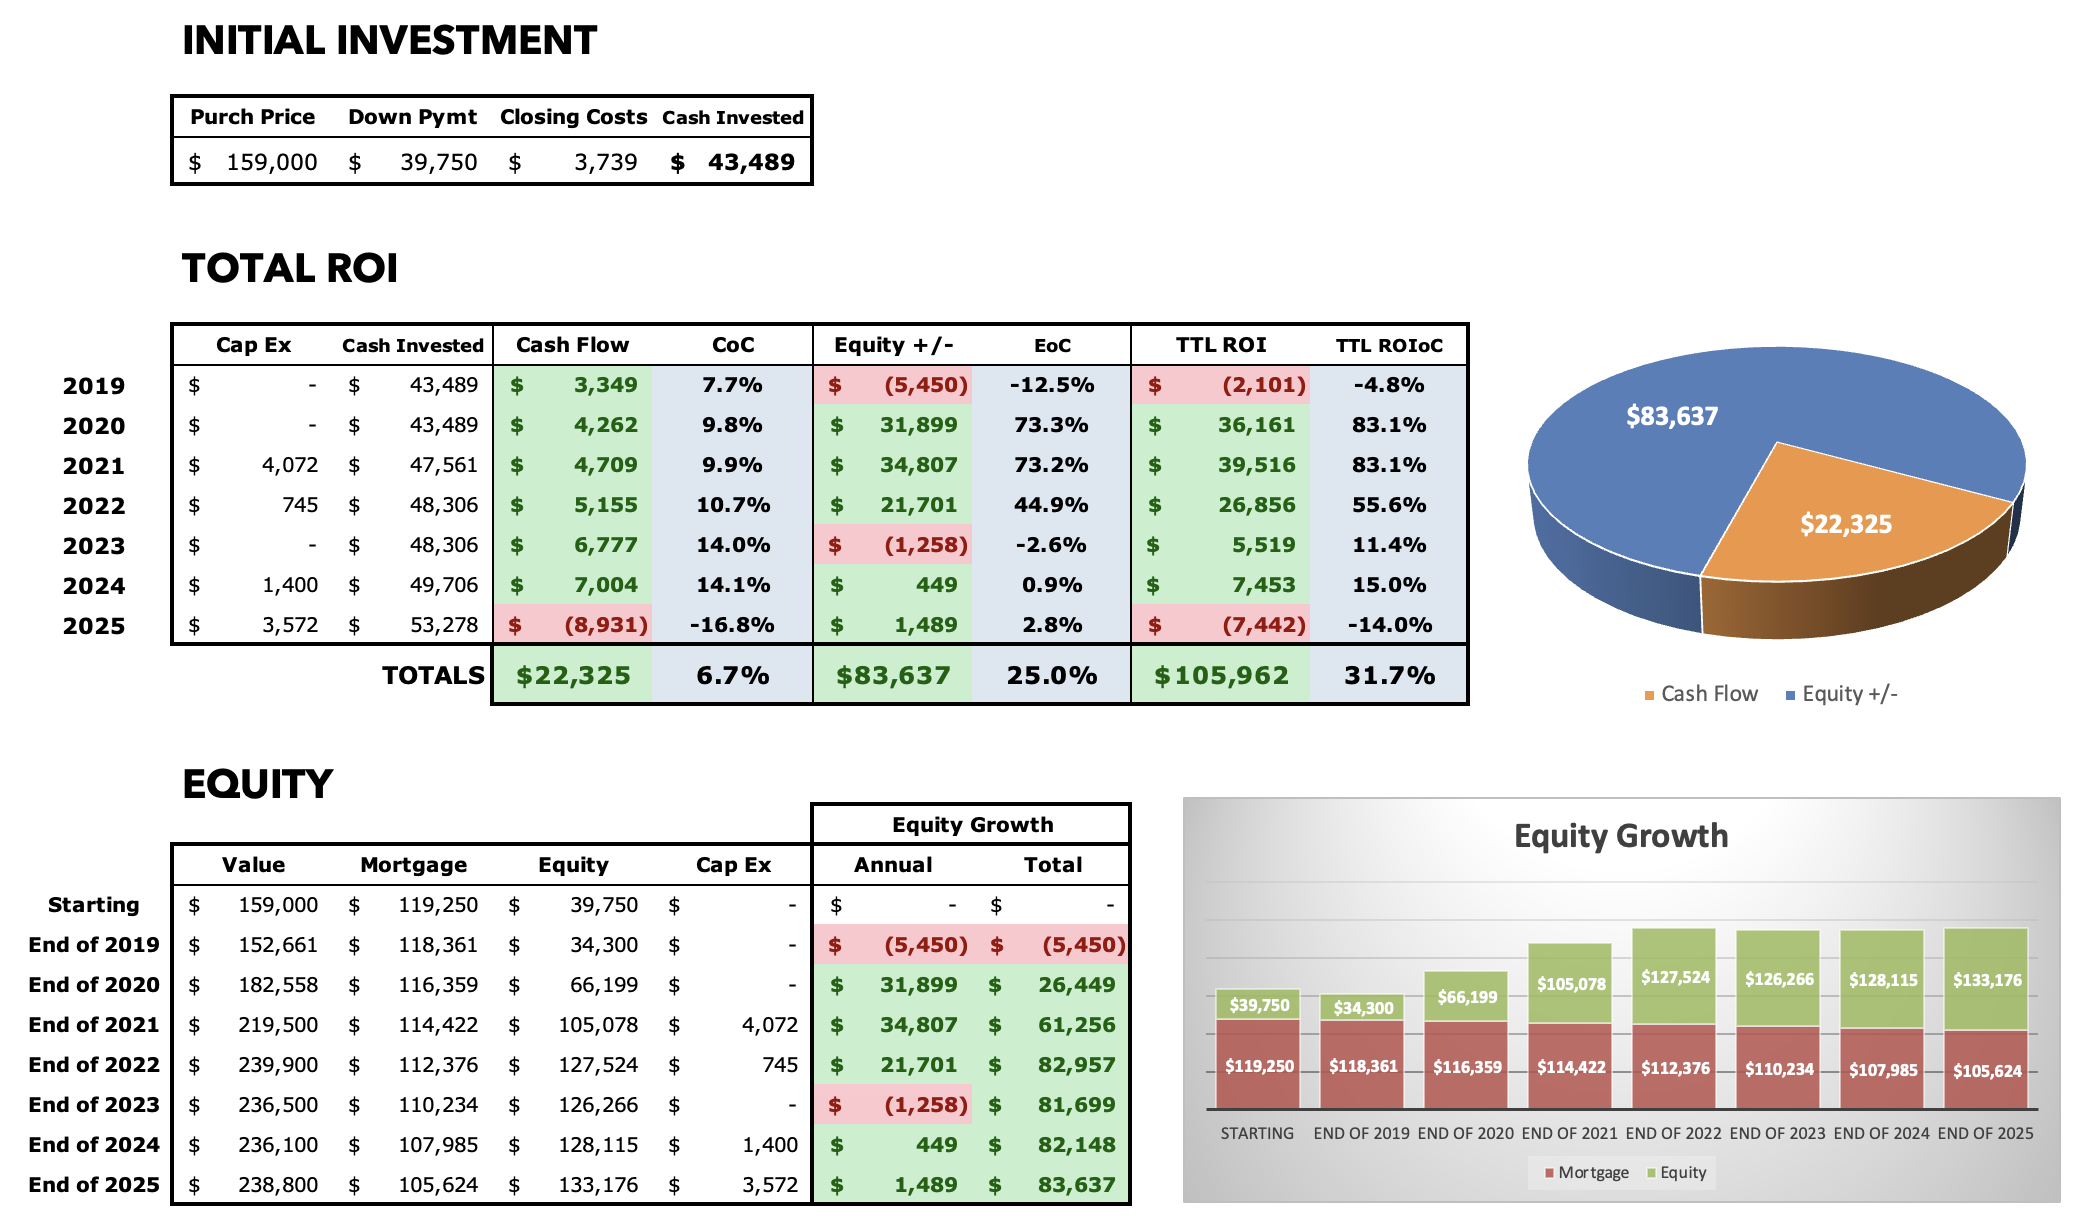
Annual Updates
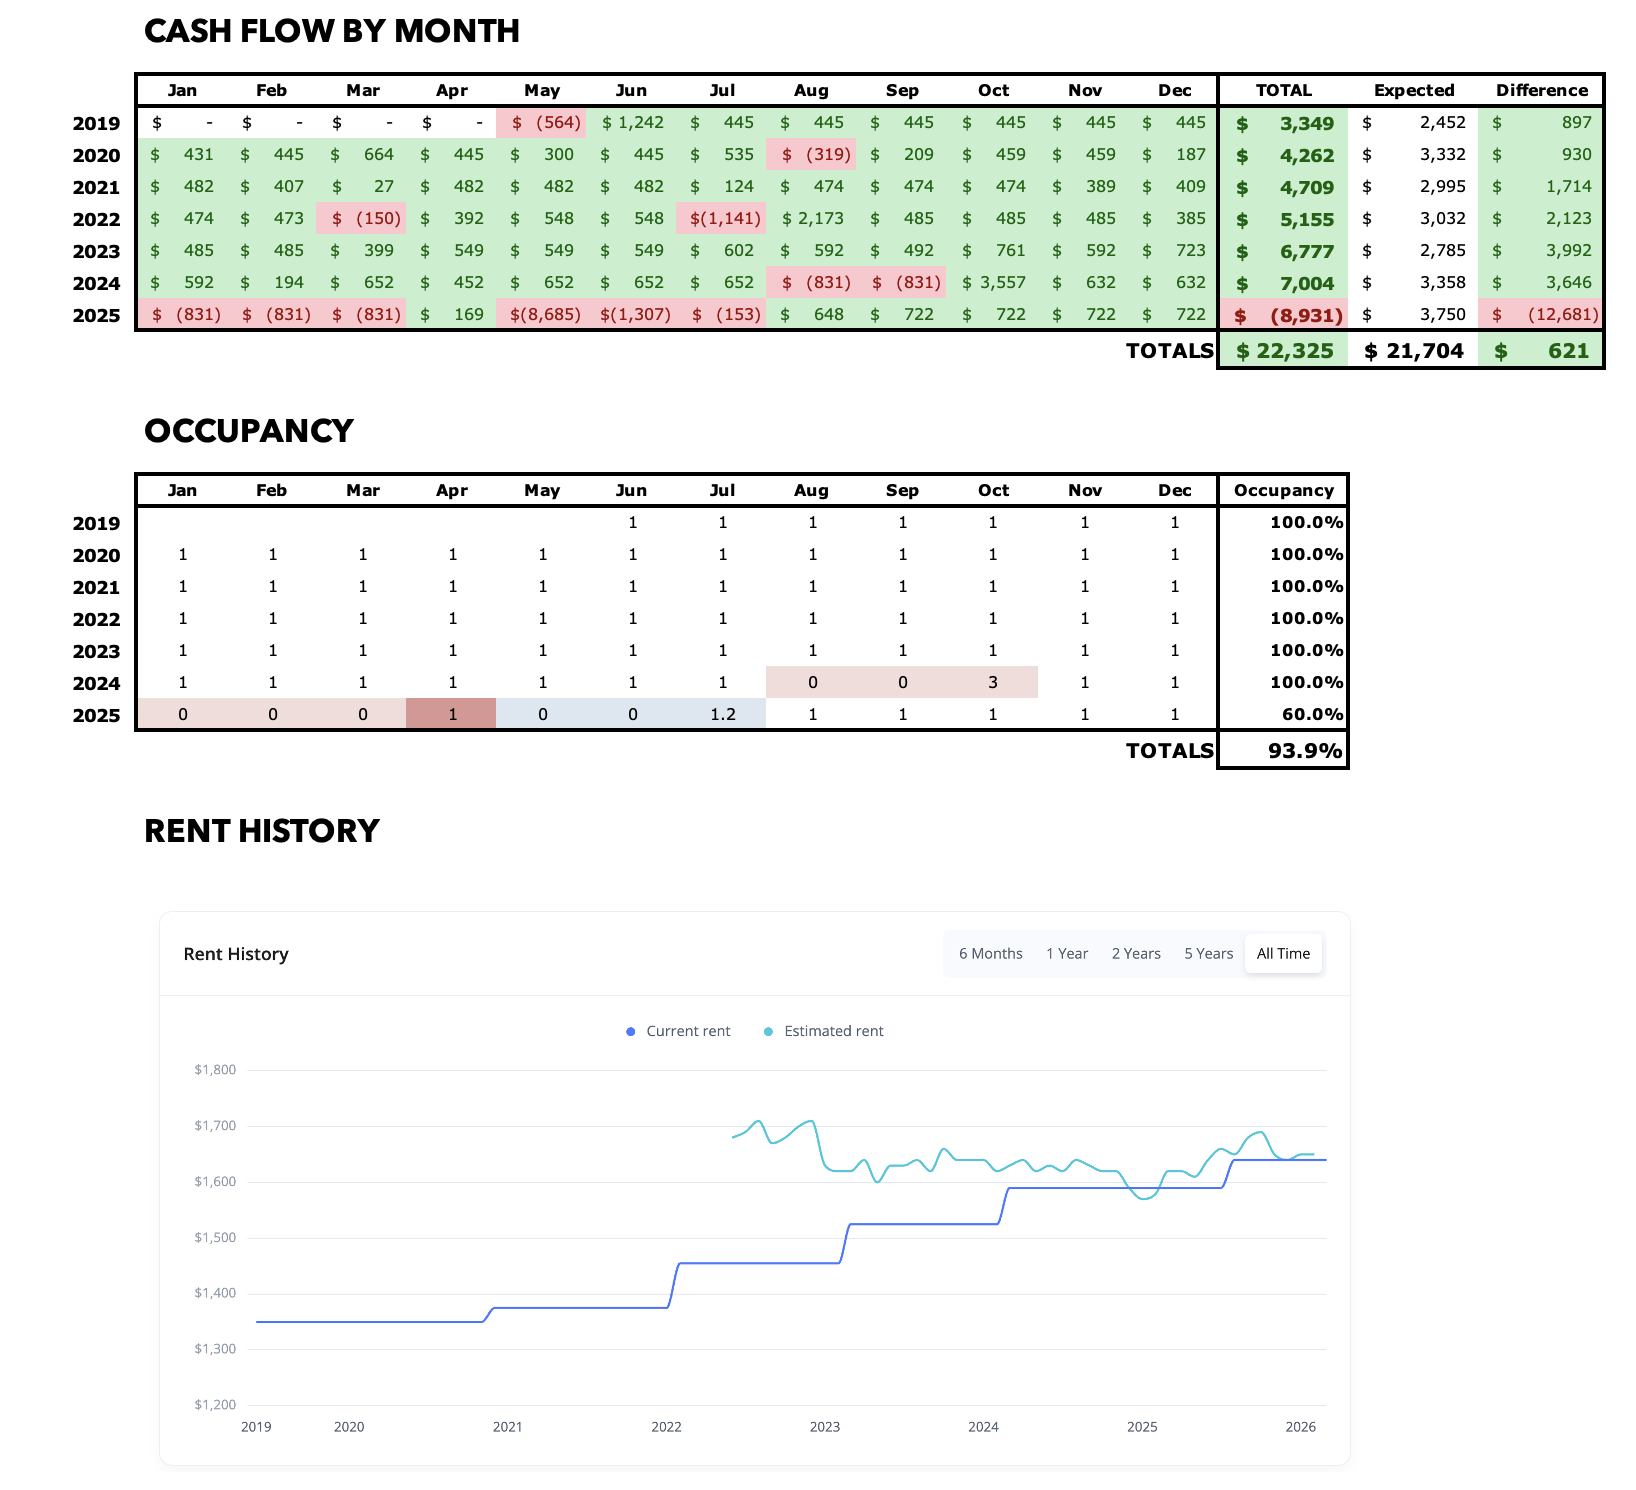
For all Property Spotlights, I come back at the end of each year to provide a brief narrative of what happened at the property that year. I also update my annual and cumulative figures for the property, including cash flow, equity growth, and occupancy.
2019
Very smooth first year after I bought the property in June, with no maintenance or repair costs. The property produced $3K+ in cash flow.
2020
The tenant renewed with an increase to $1,375/mo., and continued an excellent payment record. Various maintenance visits added up to $1,600 for the year, including plumbing, electrical, the garage door, and HVAC. But cash flow was over $4K, better than pro forma expectations.
Home value started to increase rapidly this year.
2021
No lease renewal this year, because the last renewal ran through early 2022. Several more HVAC visits eventually led to a full replacement of the cooling system at a cost of just over $4K in CapEx — but another big jump in home value more than made up for that investment, and cash flow grew to $4,700.
2022
Tenant renewed for another term at $1,455/mo. They also started to show some signs of financial stress with some late payments. At one point, they owed 2 months of rent, but they got caught up and were back making on-time payments by the end of the year.
I spent ~$1K on maintenance this year for typical stuff, and also $745 in CapEx on a new stove. Cash flow was over $5K for the first time at this house, and home prices continued to grow strongly.
2023
The tenant’s rent increased to $1,525/mo. on renewal, and they had a perfect year of on-time payments. Almost no expenditures this year, which allowed cash flow to swell to $6,700. Home values were stagnant.
2024
The tenant renewed once more with an increase to $1,590/mo. But midyear, they started making late payments again; by end of summer they were facing eviction due to nonpayment, and had reached 3-month’s of rent owed. However, they were able to get caught up by year’s end, and the eviction was forestalled.
Repairs were again very light this year ($600), though I did spend $1,400 in CapEx on a new water heater. Cash flow exceeded $7K for the first time — way ahead of my pro forma projection. Home prices continued to be level.
2025
The tenant’s payment issues over the years finally hit a breaking point. Shortly after getting caught up at the end of 2024, they again stopped paying rent in January, and unfortunately they were evicted. I retook possession of the house in May, and a new tenant was placed by July at $1,640/mo.
This was the first time I had turned this property, and it was predictably pretty costly: $7K in expense, plus another $3.5K in CapEx to lay new LVP floors through much of the house. Plus, the house didn’t collect rent for the first half of the year, and I had legal fees associated with the eviction. This turned cash flow very negative (-$9K), but interestingly I’m still $600 above my total pro forma cash flow for the life of the property. Even with very rough years, the numbers do even out over time.
The tenant left a large balance on their account, so I did decide in this instance to pursue outside collections. That can be a very long process, so it could be years before I know if/how that collection action is resolved.
About the Author
Hi, I’m Eric! I used cash-flowing rental properties to leave my corporate career at age 39. I started Rental Income Advisors in 2020 to help other people achieve their own goals through real estate investing.
My blog focuses on learning & education for new investors, and I make numerous tools & resources available for free, including my industry-leading Rental Property Analyzer.
I have also served as a coach to over 100 private clients starting their own journeys investing in rental properties, and have helped my clients buy millions of dollars (and counting) in real estate. To chat with me about coaching, schedule a free initial consultation.