2025 Annual Portfolio Checkup

It’s that time of year again! Time to make myself financially naked before you (better than being actually naked before you, I assure you) and review all the results from my rental portfolio in 2025.
Transparency and honesty are a big part of what I do — and they’re more important than ever given the rise of online gurus making big promises about real estate. With that in mind, I sit down each January/February to put together all the numbers for the previous year. In this report, you’ll be able to see my exact cash flow, equity growth, occupancy, the amount I spent on both maintenance and CapEx, and more. Nothing is held back.
This will be the 6th installment of my Annual Checkup, covering my cumulative numbers for 2025. (You can check out the previous years here.) It will follow a similar format as in previous years, including the following elements split into two large sections:
A Financial Results
A1 Cash Flow vs. Projected Cash Flow
Review of Maintenance & Repair Costs
Rate of Rent Increase
A2 Change in Equity
True Appreciation
Mortgage Paydown
Capital Expenditures
Total Change in Equity
A3 Total Returns (Cash Flow + Change in Equity)
B Tenancy Results
B1 Occupancy Rate
B2 Tenant Turns
Frequency
Duration
Cost
I did not buy or sell any properties in 2025, so this will cover all 25 properties in my current Memphis portfolio. Also note that each property’s annual results will be updated in the Property Spotlights section of my blog. Scroll down to the bottom of each post to see the annual figures since I purchased each property.
Alright, let’s get into it!
A Financial Results
Evaluating my total financial results over the year will help me to answer questions like these:
Did my cash flow meet expectations?
Were maintenance & repair costs in line?
Was I successful in raising rents?
How much did my total home equity increase (or decrease)?
What were my Total Returns on the cash I’ve invested?
The answers to these key questions will provide insights into my property manager, the state of the real estate market, and of course my properties themselves.
A1 Cash Flow vs. Expected Cash Flow
Cash flow always comes first in my analysis. When it comes to my rental properties, cash is king.
It’s the cash flow from my portfolio that allowed me to achieve more freedom and flexibility in my life, including the freedom to quit my lucrative but soul-smushing corporate job. Appreciation of home prices is nice, but as I’m fond of saying, you can’t buy groceries with home equity. So it’s critical for me to understand if my portfolio is producing the cash I’m expecting it to.
I model my expected returns ahead of time, so that I know how much cash my properties SHOULD produce. This kind of model is frequently called a pro forma. For my modeling, I use the RIA Property Analyzer (and you can, too, because I make it available as a free download!) This tool quickly calculates an expected average monthly cash flow, after all expenses are accounted for; it also calculates an expected rate of cash-on-cash returns.
When I put together the numbers for my portfolio in 2025, and compare them to the pro forma model, here are the results:
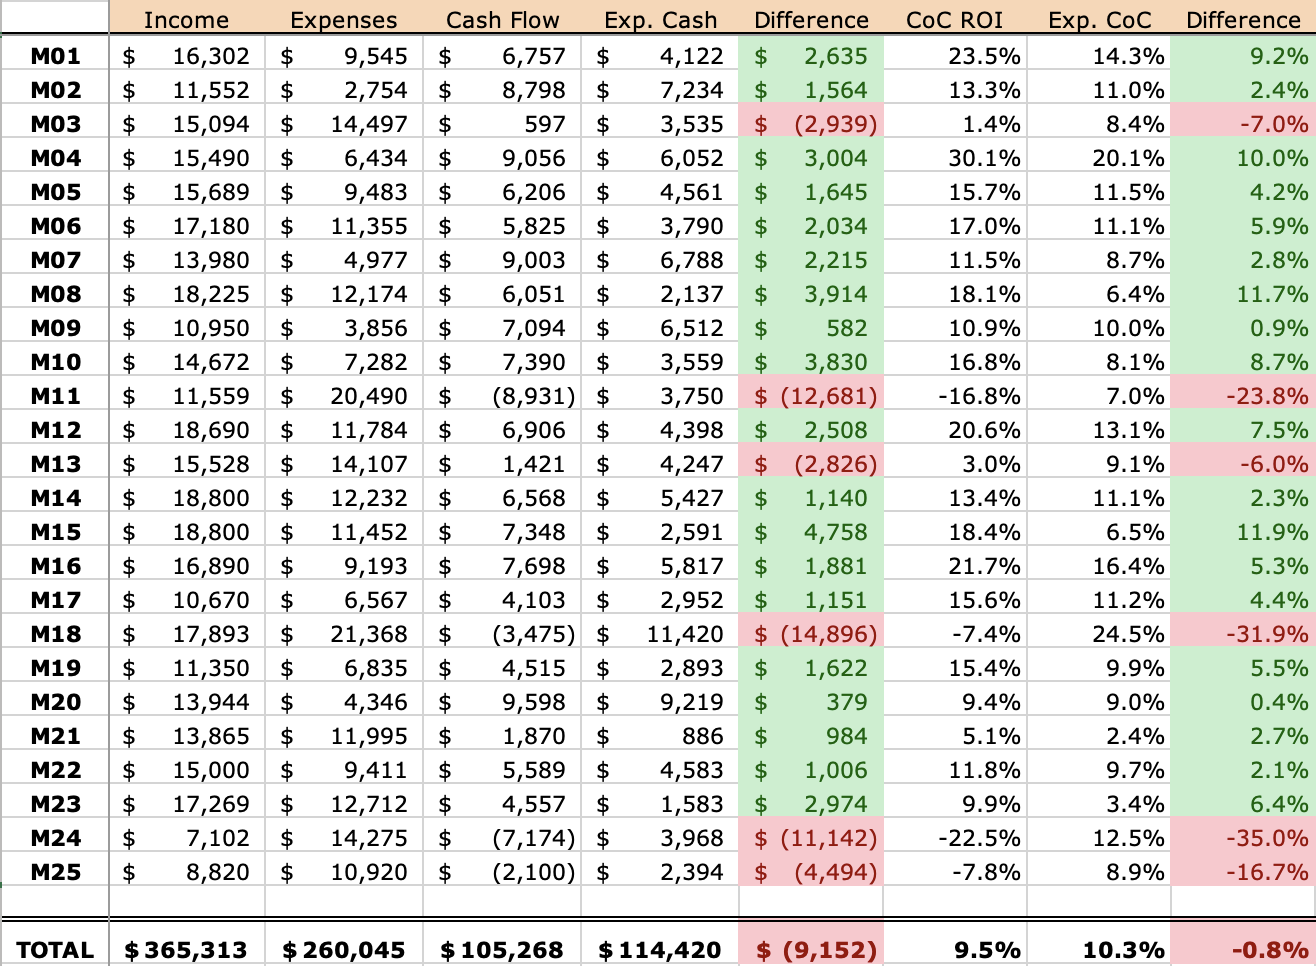
Overall, my properties generated $105K in cash flow, my highest annual total ever. However, this was $9K short of my pro forma expectations. My cash-on-cash returns were 9.5% vs. 10.3% expected.
In total, then, this was a solid cash flow year, though it was not without its challenges (as we’ll see below).
The results at the individual property level varied, but followed the normal pattern that I’ve seen in previous years: most individual properties exceeded their pro formas. If a property does not experience a turn or vacancy during the year, this is a bonus vs. the model, which plans for a 5% vacancy rate — so unless there are significant maintenance expenses, that property is likely to end up in the green. This was true for 19 out of my 25 properties last year.
The biggest problems houses this year were those where I experienced a turn or vacancy, which is also typical. Here are some of the lowlights:
Property #11 was the worst-performing property, with negative $9K of cash flow thanks to an eviction and an expensive first turn (the evicted tenant was in place when I bought the house in 2019.) I spent a lot, and only collected rent for 5 months…not a recipe for a good cash flow year!
Property #18, normally a strong cash-flowing duplex, missed its target substantially, and had cash flow of negative $3K on the year. (Ouch!) This was because I turned BOTH sides of the duplex in 2025.
Property #24 had a very tough year as well (another eviction/turn here), and it also had negative cash flow for the year ($7K).
The other properties that experienced tenant turnover were Property #25, Property #3, and Property #13. The first of those also had negative cash flow for the year, but the turns at #3 and #13 were relatively quick and inexpensive, so both those properties still managed positive cash flow for the year, though they of course missed their targets.
Review of Maintenance Costs
The biggest variable component of a rental portfolio’s expense structure is maintenance & repair costs. (In fact, I dove into this topic in a detailed article last year — check out The True Cost of Maintaining Rental Properties.)
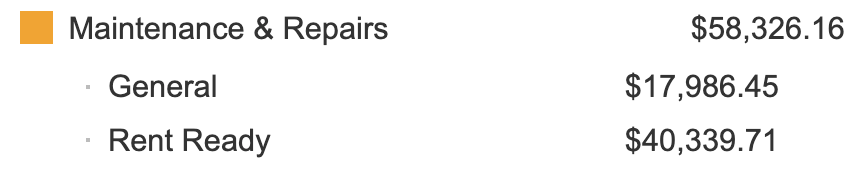
Across all 25 properties last year, my model budgeted for $39,500 in maintenance & repairs. The actual number came in much higher at over $58K! This is the second year in a row that my expenses have been much higher than expected.
However, 2025 was quite different than 2024 in this regard. In 2024, only 35% of my total expenses came from turn (aka rent-ready expenses), meaning that the bulk of my overage was from “regular” maintenance & repairs in occupied properties. In 2025, however, rent-ready expenses accounted for a whopping 69% of my total spend:
You might be wondering at this point: if my maintenance & repair costs were $25K+ above expectations, how did I only fall $9K short of my annual cash flow goal? Well, there were several factors that contributed to “closing the gap” caused by my maintenance overage:
Mid-year rent increases give me a “bonus” vs. my pro forma
My occupancy is modeled at 95%, but in reality came in at 96% — that’s another small benefit vs. my pro forma numbers
I collected ~$16K in “extra” revenue from retained security deposits, fees, and collections (prior balances from defaulted tenants)
Despite making a change a few years ago to increase my budget for maintenance & repairs, I have still managed to exceed those budgets (by a small margin in 2023, and by large margin in 2024 and 2025.) The one silver lining here is that it was the unusual number of turns I had in 2025 that drove the overage — I only had $18K in “regular” expenses, which was well within expectations. Eventually, I should have years when I turn only one or two properties, which will mean very low expenses that year.
So I still think my maintenance & repair estimates are reasonable for an average year; it’s just that the last two years have not been average.
Rate of Rent Increase
Each year, I look at how much I was able to increase rents in the course of the year. Rents must increase to make properties profitable in the long run. Why? Because all costs other than my mortgage — such as property taxes, insurance, and repairs — are certain to go up over time, so rents need to (at least) keep pace with those increasing costs.
In my portfolio, my property manager is responsible for leasing vacant properties, and renewing existing tenant leases. Therefore, the rate of rent increase is really a way to measure how well my PM has managed rents across my portfolio — though of course it also reflects larger market forces, and in some cases my own decision to freeze rents for certain properties.
My rent increase target is 2%. That may not sound like a lot, but it’s the figure I always use when modeling long-term returns for a property — so anything more than that is icing on the cake.
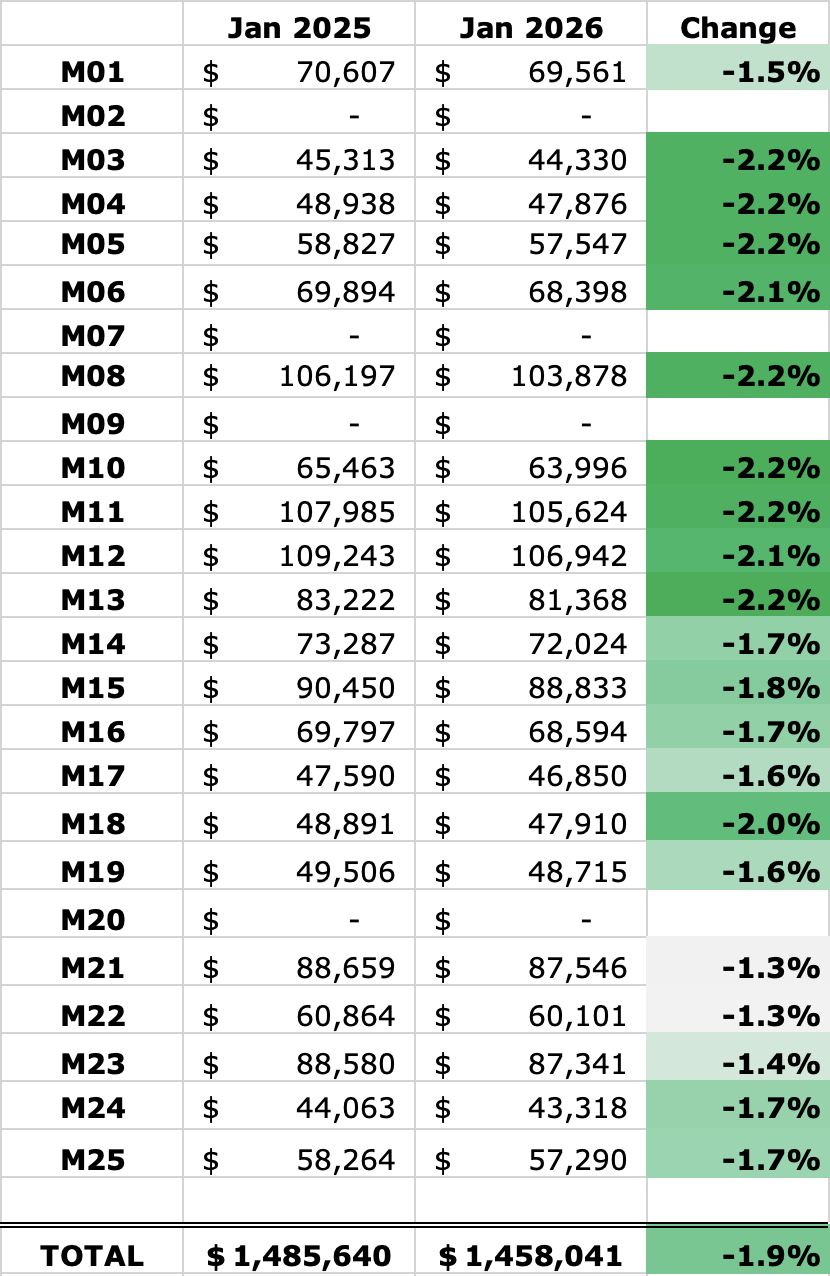
So — did I meet my 2% target last year? Here’s a look at where my rents were in January 2025, and where they are now a year later:
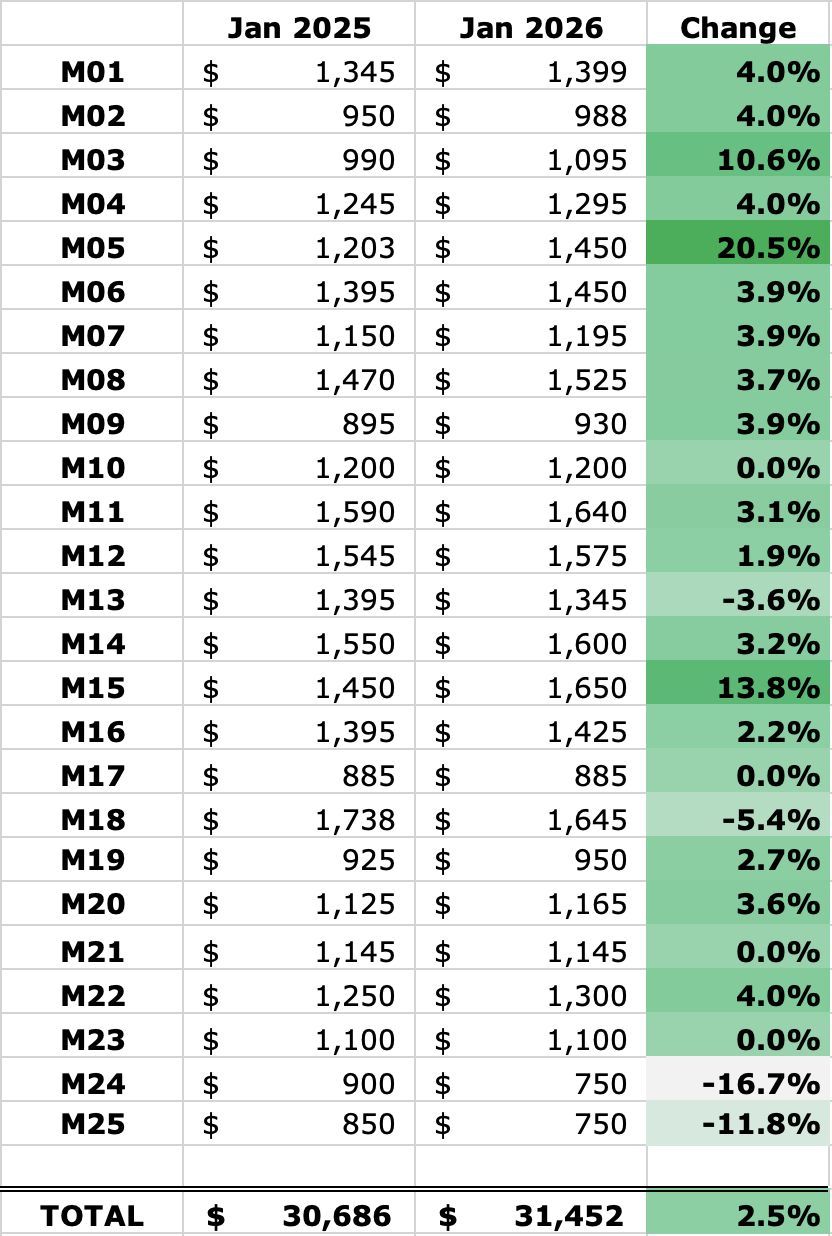
Overall, rents across these properties increased 2.5%, which slightly exceeds the 2% inflationary target. But this is the lowest rate of rent increases I’ve achieved in any year since 2020:
2020: 3.4%
2021: 4.6%
2022: 10.2%
2023: 4.6%
2024: 3.6%
2025: 2.5%
A typical rent increase at an individual property is ~4%, but there are a few notable outliers to explain:
Larger increases were achieved in a few properties where newly-placed tenants replaced older ones (Property #3 and Property #5). However, rent fell at four other properties when new tenants were placed: Properties #13, #18, #24, and #25. This is indicative of the softening rental market that is now evident in Memphis…it’s been a bit harder recently to fill vacancies.
Several properties had no change in rent, which in all cases last year was due to a 2-year lease.
A2 Change in Equity
While cash is king in rental property investing, appreciation is still part of the equation. Particularly when using leverage, small increases in home prices can mean big returns — you capture all the appreciation, even if you’ve only put 20% or 25% down on the house. You also get the paydown of mortgage principal on those properties, yet another way to create positive returns. (Further reading: I published a detailed article last year on Cash Flow vs. Appreciation.)
Capital expenses must be considered in this section as well. As I’ve discussed before, capital expenditures are not true expenses, and are better understood as increases in the cost basis of the home; therefore, CapEx reduces your appreciation, not your cash flow. Here is where that reduction in appreciation will come into play: if the value of the home goes up $5K, but I spend $5K on a new furnace, then I haven’t really gained anything.
Let’s look at each of these pieces that are part of the equity calculation — true appreciation, mortgage paydown, and CapEx — and see where those numbers landed in my portfolio last year.
True Appreciation
This one is pretty simple: how much did the value of each home increase in the last year? I track home values using the Zillow Zestimate, which has its flaws but it is nonetheless a straightforward way to see changes over time, and takes my own personal bias out of the equation.
Home prices were relatively flat in 2023 and 2024, and that trend continued again in 2025. Let’s compare my home values now to where they were a year ago:
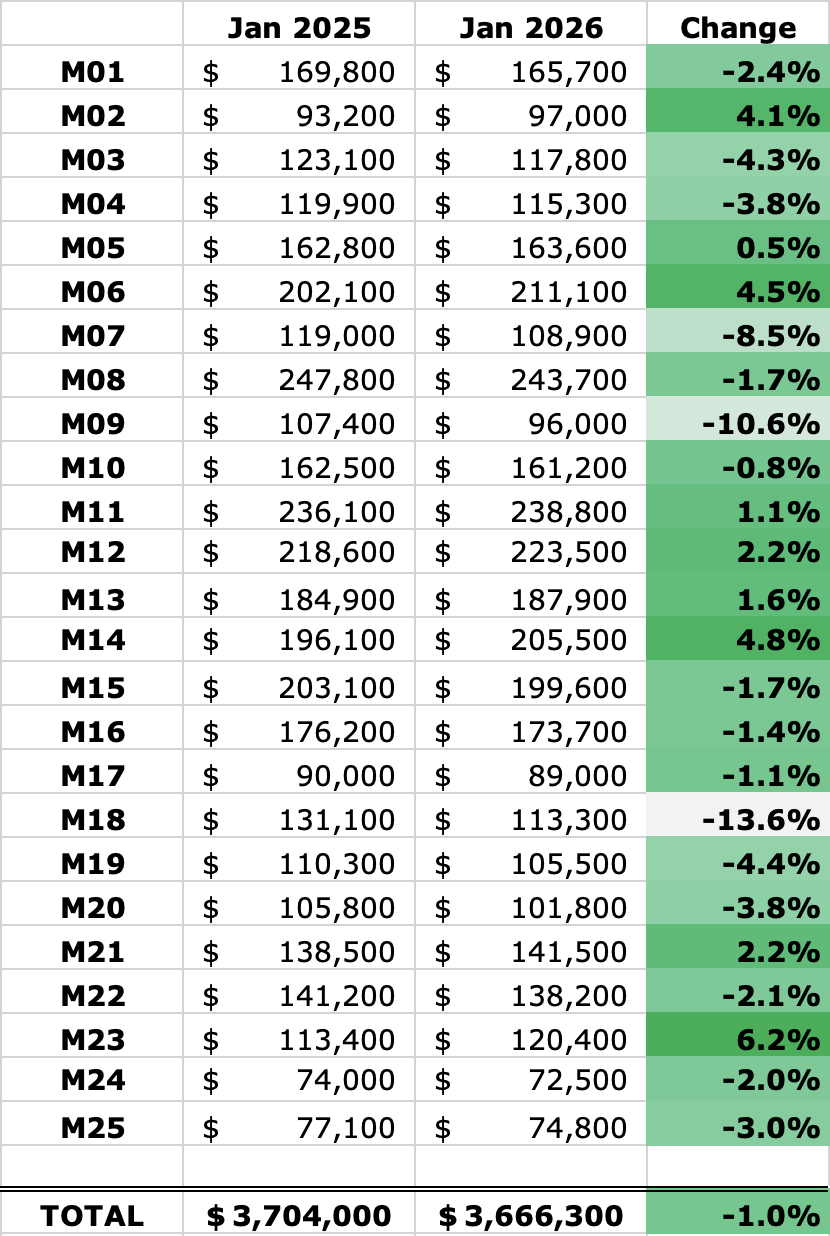
Overall, my home values decreased by about 1% last year. While flat home prices over the last 3 years are a bit disappointing, the long-term gains are still quite significant thanks to the rapid home price increases we saw post-pandemic. Here is the last 6 years of appreciation I’ve seen in my portfolio:
2020: 12.9%
2021: 33.5%
2022: 10.7%
2023: -0.9%
2024: 1.0%
2025: -1.0%
Prices continue to be relatively stable, so I wouldn’t expect to see a large shift either way in 2026 — but we’ll have to wait and see. My long-term models only ask for inflationary increases, so anything 2% or higher I’d be happy with.
One interesting takeaway here: with flat home prices over the past three years but rents continuing to slowly increase, price-to-rent ratio is likely more favorable to investors now than it was 2-3 years ago.
Mortgage Paydown
Home equity also increases each month on leveraged properties due to the loan principal slowly being paid off. This is the portion of rental property returns that is pretty much guaranteed — and it accelerates over the life of the loan.
Here’s a picture of the reduction in loan balances I experienced in 2025, which added another $27K to my annual returns (you’ll notice that four of the properties have no mortgages):
It sure is nice to see your loans melt away over time. This is one of the numerous reasons why conventional mortgages are your precious “golden tickets”!
The percent reduction of each loan is a function of the loan’s interest rate — the higher the interest, the lower the percent paid off in the early years of the loan.
The maturity of the loan also matters: because mortgage payoff accelerates over time, older loans (mostly toward the top of this list) tend to have larger payoff percentages than the newer loans at the bottom. My oldest loans are now entering their 8th year, so I’m nearly a third of the way through the full 30-year amortization period.
Capital Expenditures
While I have MORE equity due to appreciation and mortgage paydown, I have LESS equity due to capital expenditures, which increase the cost basis of the property — in other words, they increase my cash invested into the house.
My capital expenditures for last year were nearly $23K, which is back in line with my historical figures following a huge outlier last year in which annual CapEx exceeded $60K.
Here is the annual trend in CapEx:
2020: $10,882
2021: $16,915
2022: $21,772
2023: $22,468
2024: $62,039
2025: $22,733
Here’s the long list of CapEx by property in 2025:
Property #2: $1,282 for partial driveway replacement
Property #3: $1,000 for new bathroom vanity cabinet/sink
Property #5: $1,094 for new water heater
Property #9: $3,105 for new tub & shower surround
Property #11: $3,572 for new LVP flooring
Property #18: $5,816 for new countertops & doors, and new electric meter box
Property #19: $1,398 for new water heater
Property #22: $5,465 for new HVAC
How do most investors model capital expenses? Some assume a percentage of the value of the properties each year, typically 1%. Others prefer to use a percentage of rent, usually 8% or 10%. Some prefer a fixed dollar amount per month per unit, such as $100.
Using each of these three methods yields slightly different values, but all of them are more than what I spent last year (and in most previous years except 2024):
1% of home value: $3.66M x 1% = $36,600
8% of rent: $365K x 8% = $29,200
$100 per unit per month: 26 x 12 x $100 = $31,200
Despite the big outlier in 2024, my per-year CapEx is very much in line with these estimates. In fact, I’ve spent a bit less than expected, averaging $26,126 per year in CapEx over the preceding six years. (Though this is not inflation-adjusted.)
Total Change in Equity
Now let’s put all of these pieces together — appreciation, mortgage paydown, and CapEx — and calculate the total change in equity for the year:
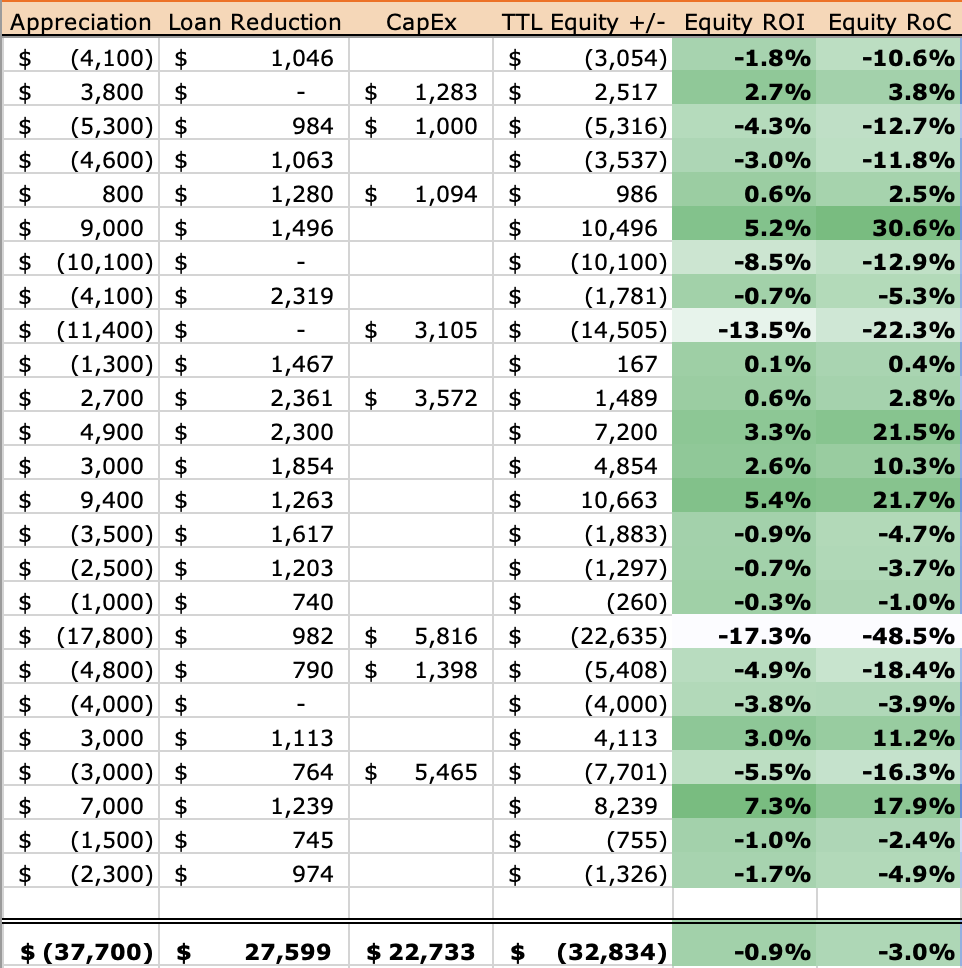
As you can see, my total equity dropped by nearly $33K. Let me also explain the two percentages I calculated here:
Equity ROI: Compares the total change in equity to the value of the property at the beginning of the year.
Equity RoC: Compares the total change in equity to the total cash invested into the property.
Said a different way, my total equity across these 25 properties dropped at a rate of 0.9% relative to their value at the start of the year, and dropped at a rate of 3.0% relative to the amount of cash I have invested in the properties.
The results here are mediocre for the third straight year, largely due to stagnate home prices. But these are tiny changes when compared to the huge equity increases I experienced in 2020-2022:
2020: +$220,119
2021: +$675,264
2022: +$294,483
2023: -$30,694
2024: +$2,406
2025: -$32,834
I’m in the fortunate position of achieving such large equity gains since the pandemic that several consecutive years of lackluster equity growth have hardly made a dent.
A3 Total Returns
To calculate total returns, we’re simply going to add together the cash flow and equity portions that we’ve already calculated. Total returns is an important number — particularly your rate of total returns on cash invested — because that’s what you would mentally compare against other types of investments. For example, the stock market has historically returned ~10% total returns (before adjusting for inflation); if your rental properties are yielding total returns on cash of 10% or more, then you can assume that you’re beating the stock market. (Yes, I know that doesn’t include real estate transaction costs, taxes, and other factors — but my epic Stocks vs. Rental Properties article contemplates ALL those factors, if you want to dive deep into that perennial debate.)
Anyway, here’s what my Total Returns look like for 2025, putting together all the numbers that we’ve looked at so far:
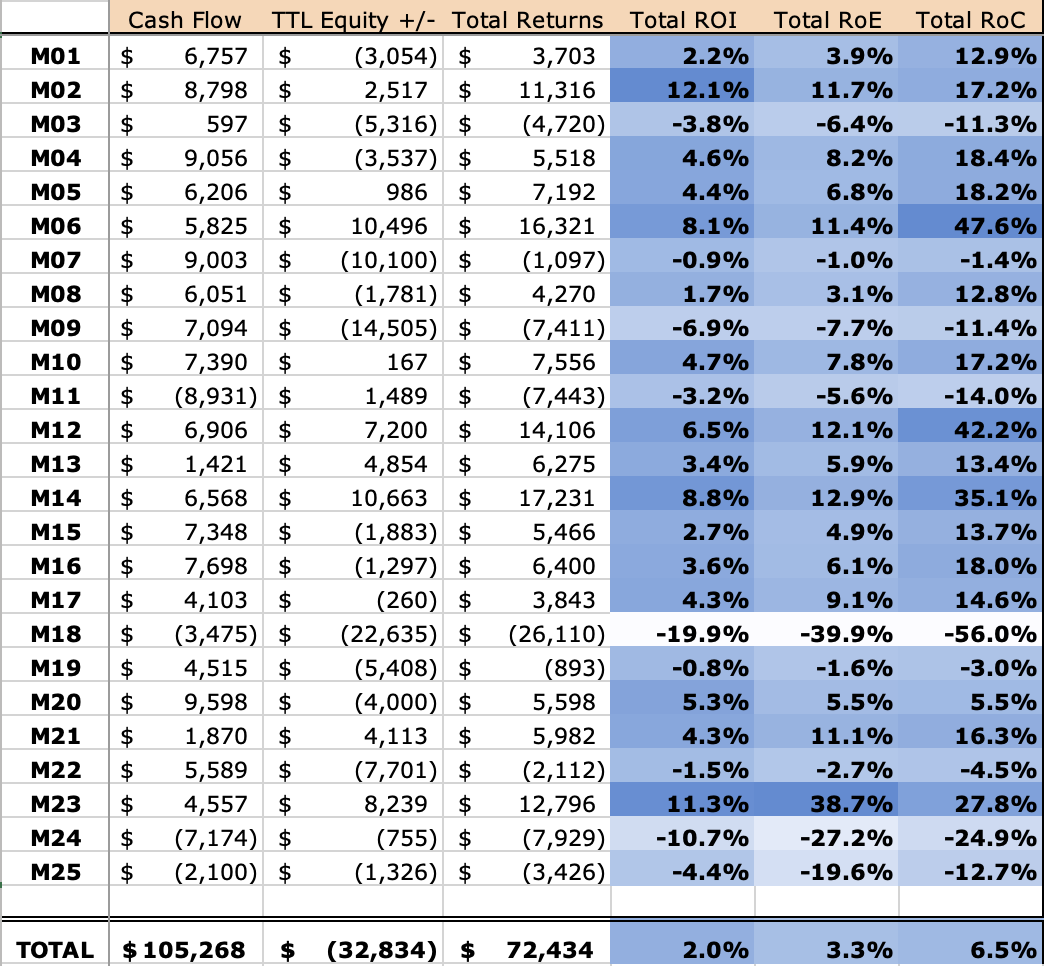
Here’s how I calculated the three rate-of-return metrics above:
Total ROI: Compares Total Returns to the value of the property at the beginning of the year.
Total RoE (Return on Equity): Compares Total Returns to my total equity in the property at the end of the year.
Total RoC (Return on Cash): Compares Total Returns to the total cash invested into the property.
Or said a different way, my Total Returns across these 25 properties were equal to 2.0% of their value at the start of the year, 3.3% of my current equity in the properties, and 6.5% of the amount of cash I have invested in the properties.
This year, as in 2023 and 2024, my cash flow drove nearly all of my total returns. And I have no problem with that. Sure, equity gains are nice, but they will mostly likely come in spurts — I can’t reasonably expect a smooth 2-3% increase in home values each year. Far more important to me is that the portfolio continues to meet its expected rate of cash returns, which provides the foundation for the financial and work freedom that I currently enjoy.
B Tenancy Results
The second large section of the Annual Checkup will be a close look at tenancy — specifically occupancy rate and tenant turns. While these factors contribute to the financial results that we’ve already calculated and reviewed, it’s important to break them out separately to understand them — just as the variable costs of maintenance & repairs can make or break a property’s financial results, so can your ability to keep your properties occupied with quality tenants.
Or, more accurately, your property manager’s ability to do so. Because my PMs are fully responsible for keeping my properties occupied with strong tenants, this entire section is largely a reflection of their degree of success with this critical task.
B1 Occupancy Rate
This key metric is simply a measure of the percent of the time that your properties are occupied. In my pro forma modeling, I always use a 5% vacancy factor (assuming 95% occupancy), because I know that some percentage of the time I won’t be collecting rent on properties, such as when they are being turned between tenants.
So the question here will be: did my portfolio exceed the 95% occupancy goal that I budget for?
Calculating vacancy rate is pretty simple. Each combination of a month and property (i.e. October at Property #5) is a slot to be potentially filled, which serves as the denominator of the fraction. The number of slots that were, in fact, occupied, is the numerator. For example, if you owned two properties for a full year, that’s 24 “tenant month” slots; if the first property had no vacancy, and the second property was vacant for one month, that’s 23 out of 24 tenant months occupied. So your occupancy rate would be 23 divided by 24, or 95.8%.
One quick caveat: I count a property as occupied if I’m collecting rent on it, whether or not a tenant is actually living there. For example, in a lease break situation where I retain a 1-month security deposit after the tenant moves out, I count the property as occupied for that additional month. Conversely, if a tenant IS in place but I’m never able to collect rent for that month, then I count the property as vacant. This aligns with my pro forma modeling, which does not budget for vacancy in the strict sense of the word, but instead for months where rent is not collected.
Using this math across my 2025 portfolio, here’s what we find:
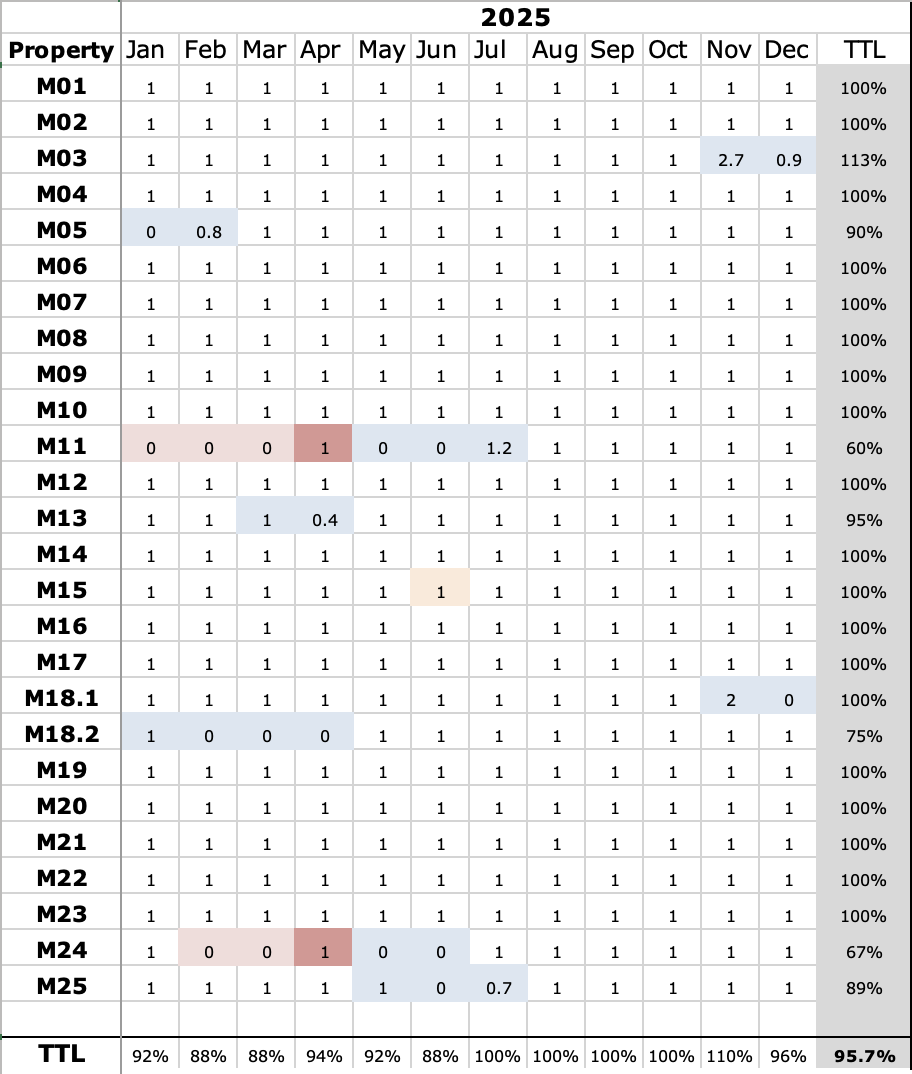
In total, these 25 properties maintained an occupancy rate of nearly 96%. And this isn’t a fluke — I’ve consistently achieved better than 95% occupancy:
2020: 98.1%
2021: 95.5%
2022: 98.8%
2023: 97.4%
2024: 97.8%
2025: 95.7%
Blue highlights indicate periods of a tenant turnover. As you can see, I had 7 turns in 2024 (Property 5’s turn was included in last year’s report.) I’ll discuss these 7 turns in more detail in the section below.
Red highlights indicate evictions. I unfortunately had two evictions this year, which occurred simultaneously. Those evictions, along with several other turns, made cash flow quite challenging in the spring months.
B2 Tenant Turns
Turning properties between tenants is a big driver of cost in any rental portfolio. They’re costly in several different ways: not only do you have to pay for the work to get the property ready for the next tenant, you’re also not collecting any rent during that period. (To add insult to injury, you also have to pay for utilities and lawn care during the turn!)
Proper management of tenant turns can therefore be critical to ensure the success of rental property investments. There are three primary objectives when it comes to turns, and they’re all worth monitoring in my annual checkup. In a perfect world, I want turns to be:
Infrequent. By screening tenants properly upfront, providing them with a quality home, and responding professionally to any issues they’re having, my PM can make it more likely that tenants will stay longer, which decreases the number of turns I have to do in any given year.
Short. If turns must occur, I want them to be as short as possible. This is a measure of how efficiently my PM can complete the rent-ready work, and get a new tenant in place.
Inexpensive. If the home was maintained properly during the tenancy (by both the tenant and the PM), and if the property was up-to-standard beforehand, then turns should be relatively cheap; if not, they can get quite costly.
Let’s see how well I achieved those three turn objectives in 2025.
Frequency
How often should you expect to turn a property? This depends on the length of an average tenancy: if the average tenant stays 4 years, I would expect to turn 25% of my properties each year, on average.
My PM’s data indicates average tenancy of ~4.5 years, which means that 5 or 6 turns each year would be average for my 25-property portfolio.
Instead, I turned 7 properties last year. This is the most I have ever had in one year, so I’m hoping 2026 returns to the lower number of turns I had gotten accustomed to:
2020: 3 turns
2021: 4 turns
2022: 2 turns
2023: 4 turns
2024: 5 turns
2025: 7 turns
Duration
Were those five turns performed efficiently? Let’s take a close look at them:
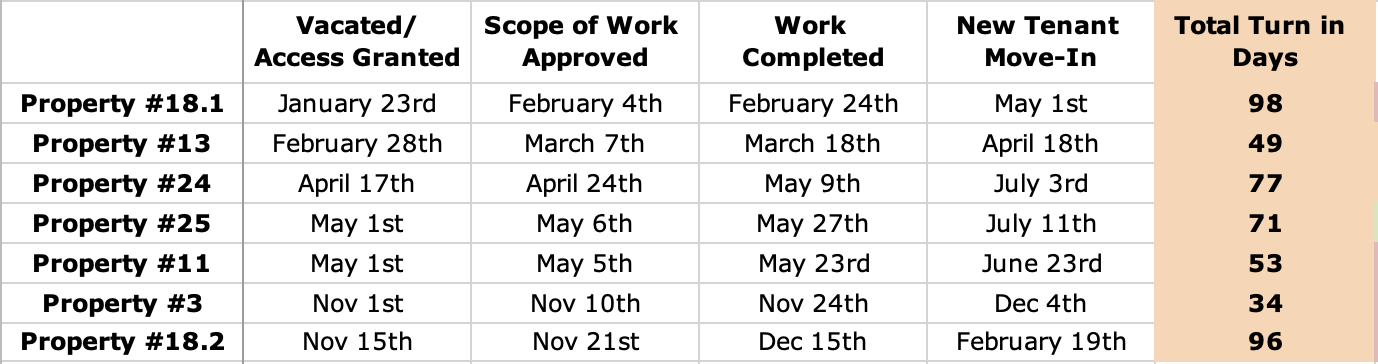
These turns are reasonably efficient. In general, I’d say that any turn completed in less than 60 days is great. Only when the turn stretches into its third month would I start to become concerned. My average this year was 68 days, which is decent.
The one step of the process that was noticeably slower than in previous years was the placement of a new tenant. I’m still getting SOWs approved and completed as quickly as in previous years, but at times, placing a new tenant is taking a few weeks longer than I would hope. That’s indicated of a slightly softer rental market; to counteract this in 2026, I may be tempted to price vacancies more aggressively in order to attract more potential tenants — though of course this is a trade-off vs. lower rents.
Cost
I expect a typical turn to cost between $3,000 and $6,000 — any turn under $2,000 is cheap, and one that exceeds $6,000 is expensive. Here’s a glance at the turns I did in 2025, and their costs:
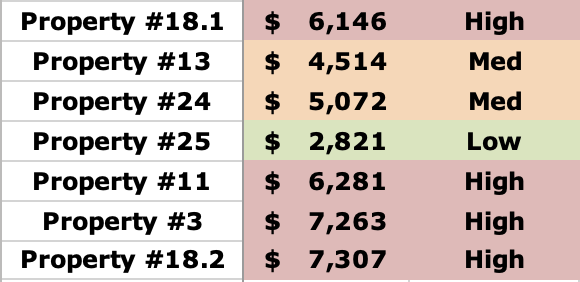
As we’ve already seen, turns were a significant driver of my maintenance expenses in 2025, so it’s not surprising to see some expensive ones.
Some additional color on these turn expenses:
The last three turns for the year (at Properties #11, #3, and #18.2) were all “first turns” — in other words, I had bought those properties occupied and had not yet turned them. These tend to be quite expensive because there can be more work required to bring them up to my PM’s normal standard.
The turn on the other side of my duplex (#18.1) was expensive despite the fact that I did a costly initial rehab in 2020, and turned it again in 2023. It was quite disappointing, because I hope that a smaller, rehabbed unit would not continue to cost a lot to turn — in this case, though, it was due to the tenant taking poor care of the property.
The other turns all fell into the normal expense range.
Conclusion
Finally, here is the dashboard for my portfolio in 2025, incorporating all the key areas and metrics we’ve reviewed in this article:
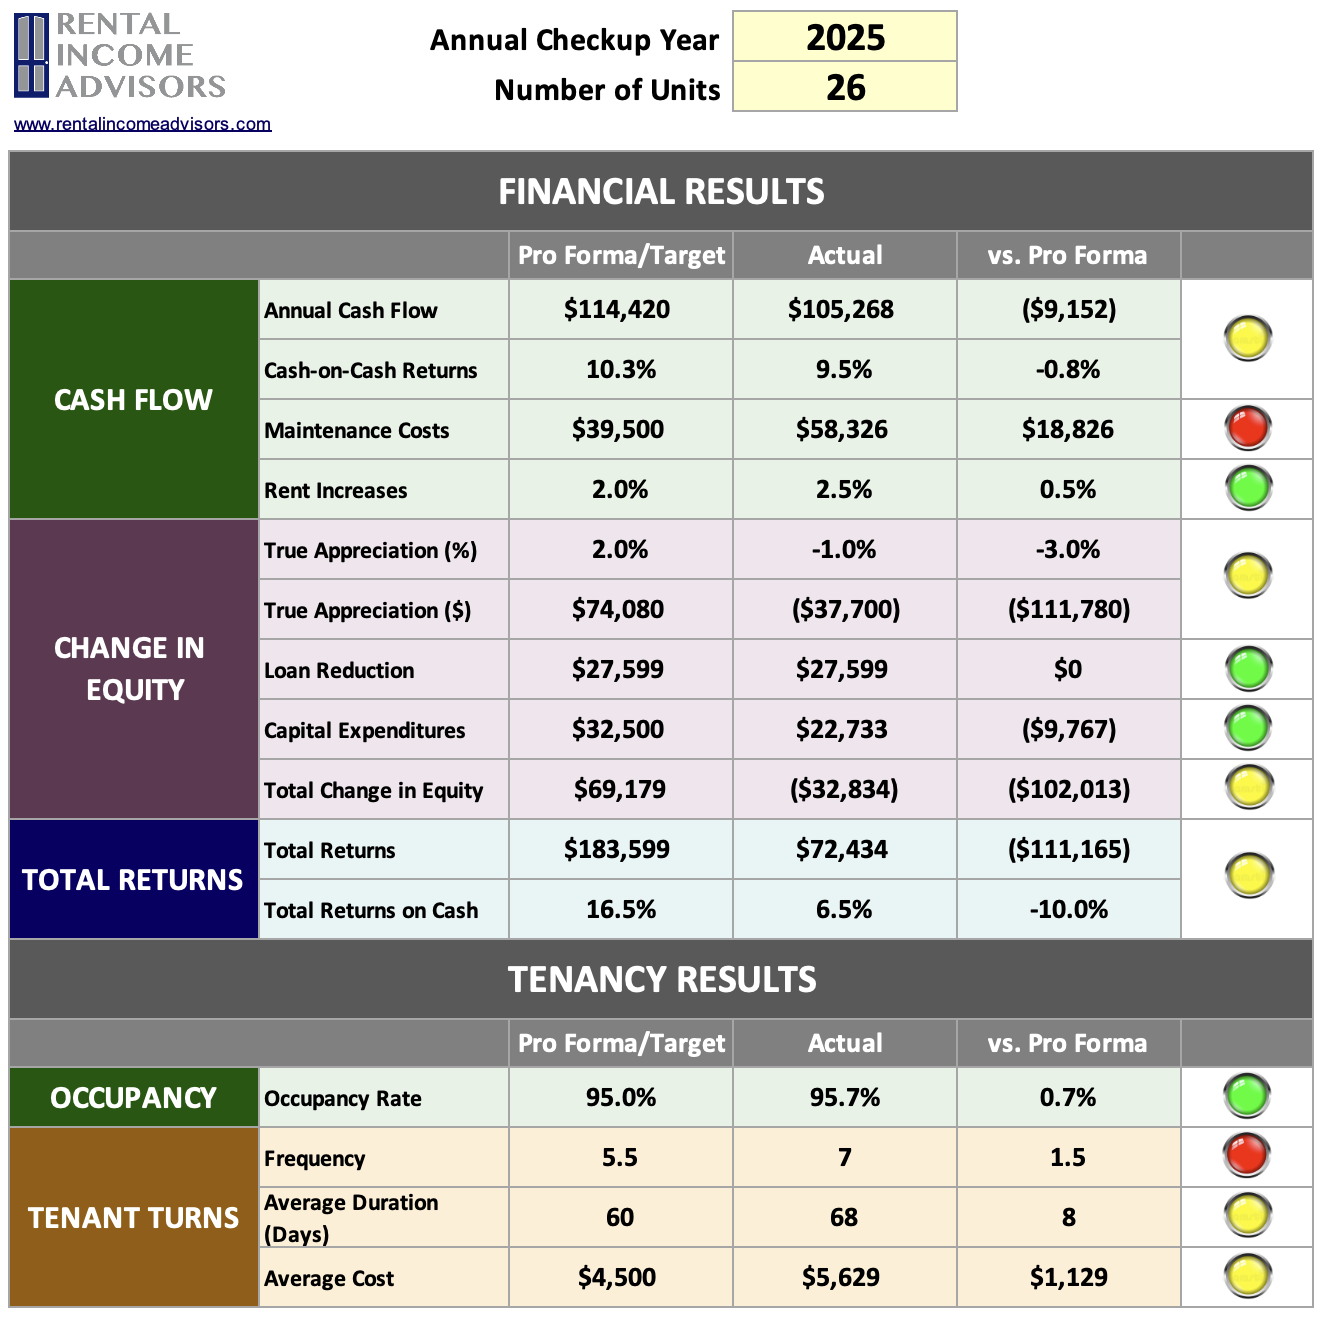
Here are my key takeaways from this annual checkup:
Maintenance expenses far exceeded expectations…again. Tenant turnover was the primary driver here, which was different from previous years. I expect this to revert to the average going forward. Plus, I have very few “first turns” still waiting to be done, which should help to keep both turn costs and associated CapEx in check.
The huge CapEx spend in 2024 looks like an anomaly. Very happy this got back to normal, and hope it stays that way.
Sound operations continue to be a strength. From occupancy rate to rent increases to management of turns, my PMs have been reliable stewards of my portfolio. There are always things to tweak, and I’ll continue to partner with them on those things — but overall, they are delivering reliable operations.
There are signs the rental market is softening. It took longer to fill vacancies, and new tenants more often had rents that were lower than before. The rental market is cyclical and out of my control, but there are things I can do operationally to minimize the impact of a soft rental market, such as reducing/eliminating rent increases where tenants are already at market rate, and marketing vacant properties at lower rents in order to fill them faster.
Despite 7 expensive turns, it was still a good year. The last two years have proven that a well-constructed cash flow portfolio can weather some pretty intense storms and still produce reliable annual income.
It might be time to make some moves. My portfolio has been stable/unchanged for quite a few years now. Though it’s still doing its job, it is by no means perfect or optimal. Will I actually look to sell, shuffle, or 1031 some properties this year? I’m not sure, but there are certainly opportunities I could address:
Some properties are ones that I wouldn’t buy today (i.e. don’t meet my current Buy Box)
Some properties have persistent, costly issues and just don’t seem to stabilize even after many years
I have a ton of equity in some properties that I could deploy more productively
A few properties never met my initial rent expectations; that, combined with increasing property tax and insurance rates, means that they simply don’t have the cash flow potential I would want going forward
About the Author
Hi, I’m Eric! I used cash-flowing rental properties to leave my corporate career at age 39. I started Rental Income Advisors in 2020 to help other people achieve their own goals through real estate investing.
My blog focuses on learning & education for new investors, and I make numerous tools & resources available for free, including my industry-leading Rental Property Analyzer.
I also now serve as a coach to dozens of private clients starting their own journeys investing in rental properties, and have helped my clients buy millions of dollars (and counting) in real estate. To chat with me about coaching, schedule a free initial consultation.