2021 Annual Portfolio Checkup

Last year, I published an article about how to perform an Annual Checkup on your rental portfolio, which outlined some key metrics and results that are worth a close retrospective look at the end of each year. In that article, I also reviewed those same metrics from my personal portfolio to see how they measured up.
This will be the second installment of my Annual Checkup, covering my cumulative numbers for 2021. It will follow a similar format to last year’s article, including the following elements split into two large sections:
A Financial Results
A1 Cash Flow vs. Projected Cash Flow
Review of Maintenance & Repair Costs
Rate of Rent Increase
A2 Change in Equity
True Appreciation
Mortgage Paydown
Capital Expenditures
Total Change in Equity
A3 Total Returns
B Tenancy Results
B1 Occupancy Rate
B2 Tenant Turns
Frequency
Duration
Cost
Also like last year, I will only include in this analysis those properties that I owned for the full calendar year — so the numbers will include my first 18 properties in Memphis, but exclude Property #19 which I bought in mid-2021.
Alright, let’s get into it and see how healthy my portfolio was in 2021!
A Financial Results
Evaluating the annual financial performance of my properties is the first (and most important) part of the Annual Checkup. It will help me answer questions like these:
Did my cash flow meet expectations?
Were maintenance & repair costs in line?
Was I successful in raising rents?
How much did my total home equity increase (or decrease)?
What were my Total Returns on the cash I’ve invested?
The answers to these key questions will provide insights into my property manager, the state of the real estate market, and of course my properties themselves.
A1 Cash Flow vs. Expected Cash Flow
It’s been said many times before: cash is king. And in my opinion, this holds very much true in rental property investing. My goal is to maximize my yield (aka cash-on-cash returns), so that my invested dollars are as productive as possible. Many investors who are chasing financial freedom have the same goal — appreciation of home prices is nice, but you can’t buy groceries with home equity. So it’s critical for me to understand if my portfolio is producing the cash I’m expecting it to.
I model my expected returns ahead of time, so that I know how much cash my properties SHOULD produce. This kind of model is frequently called a pro forma. For my modeling, I use the RIA Property Analyzer (and you can, too, because I make it available as a free download!) This tool quickly calculates an expected average monthly cash flow, after all expenses are accounted for; it also calculates an expected rate of cash-on-cash returns.
When I put together the numbers for my portfolio in 2021, and compare them to the pro forma model, here’s what it looks like:

Overall, my properties generated $67K in cash flow, which was about $2K better than expected. This translates into a cash-on-cash return of 9.5%, slightly better than the 9.2% pro forma.
If you’re a close follower of the blog, you might notice that these results do not align with my December monthly update, which showed I fell ~$10K short of my cumulative cash flow expectations for the year. So how does negative $10K turn into positive 2K? Rest assured that I’m not fudging the numbers — this discrepancy is caused by three factors:
Property #19 is excluded from the annual numbers, but included in the monthly numbers. That property had an expensive turn this year and was cash-flow negative. This accounts for ~$5K of the difference between the two measures.
When I calculate the “expected cash flow” for each property in the table above, I’m using the rents as they were in January 2021. So when a property’s rent increases during the year, this results in a small “bonus” vs. the expected annual cash flow. Conversely, in my monthly updates, rent increases are immediately incorporated into my expected monthly cash flow. Therefore, the sum of those monthly pro formas exceeds the annual pro forma for any property where the rent increased mid-year. I don’t store the pro forma cash flow values by month by property, so this isn’t something I can solve for. (And in fact, I think it’s just as reasonable to do it this way.) As we’ll see later, there were several properties that had significant rent increases this year, so this accounts for ~$5K of the difference between the two measures.
Memphis property taxes were adjusted in 2021, a process that occurs every 4 years. This resulted in a cumulative increase in my portfolio’s tax burden of about $3,500 annually. I inserted those higher costs into my pro formas, but didn’t save the old costs, so I had to use the higher taxes in the annual pro forma despite the fact that the lower taxes were still in play until mid-year (and therefore still reflected in those monthly updates in early 2021). This accounts for ~$2K of the difference between the two measures.
Following the pattern from last year, most individual properties exceeded their pro formas. If a property does not experience a turn or vacancy during the year, this is a bonus vs. the model, which plans for a 5% vacancy rate — so unless there are significant maintenance expenses, that property is likely to end up in the green. This was true for 13 out of my 18 properties last year.
My trouble properties last year were Property #8 and Property #13. This year, Property #8 performed well, because nothing at all happened! My only expenses for the year were my monthly PM fees and $75 for an annual inspection. That’s a guaranteed recipe to exceed your pro forma! I was also able to raise the rent by $50/month in April. Still, the pro forma cash-on-cash is only 3.5% at this property, and there’s a lot of equity in it at this point due to price appreciation, so it is still a prime candidate to sell in the next few years. Property #13 missed its target cash flow again this year, due to persistent maintenance & repair costs. I still have every reason to believe that this house will eventually stabilize; we’ll see what happens in 2022.
There were some other problem houses this year: Properties #2, 7, 9, and 17 all missed their targets. Unsurprisingly, these were all properties where I had turns/vacancy. I’ll discuss the costs of those turns in more detail later, but the worst offender was Property #2, which was the only home where I LOST money in absolute terms. I had en extended vacancy due to eviction, and then $5K in turn costs on top of that, which explains why the property missed its cash flow target by more than $8K. Property #7 was also tough, missing its target by more than $4K due to a very costly turn (this was the one with extensive water damage, the bee colony in the wall, etc., as I discussed in several monthly updates this past spring/summer.)
Review of Maintenance Costs
The biggest variable component of a rental portfolio’s expense structure is maintenance & repair costs. Across all 18 properties, my model budgeted for $18,400 in maintenance & repairs. The actual number came much higher, at nearly $27K — and like last year, turns (aka Rent Ready expenses) were a big driver of those costs:

This is the second year in a row that my M&R costs exceeded my expectations — and it was a pretty big miss this year. This suggests that my pro forma assumptions (I use 1% of the purchase price) may be too low. If this pattern holds true for a third straight year in 2022, I will make an adjustment to increase my expected spend on maintenance & repairs. This is one of the most important things I’ll be watching in my portfolio this year, since any change in those pro forma assumptions will impact my expected rate of cash returns, both on my existing properties and on new deals that I’m considering.
Rate of Rent Increase
I also like to look at how much I was able to increase rents in the course of the year. Rents must increase to make properties profitable in the long run. Why? Because all costs other than my mortgage — such as property taxes, insurance, and repairs — are certain to go up over time, so rents need to (at least) keep pace with those increasing costs.
In my portfolio, my property manager is responsible for leasing vacant properties, and renewing existing tenant leases. Therefore, the rate of rent increase is really a way to measure how well my PM has managed rents across my portfolio.
With inflation increasing significantly of late, rent increases are even more important. I’d normally want to see rents increasing by at least 2%, and that was the target I measured against in 2020. But this year, let’s double that target to 4% to account for higher inflation. Did I meet that target last year? Here’s a look at where my rents were in January 2022, as compared to January 2021:
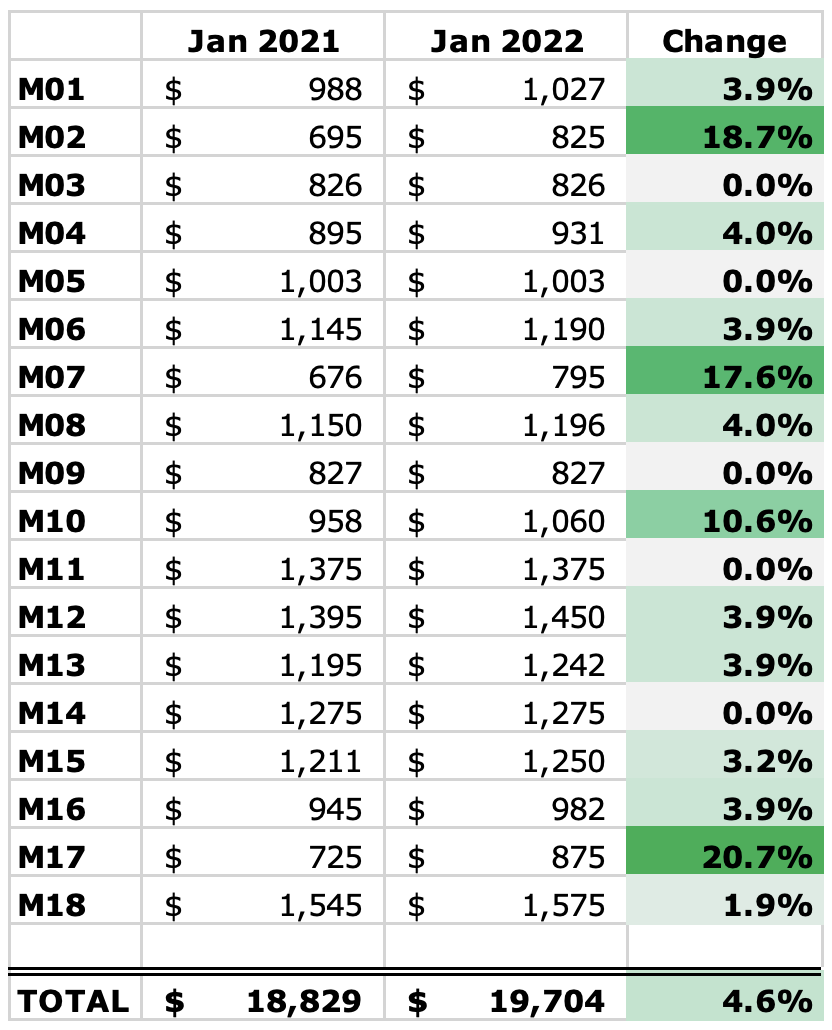
Overall, rents across these properties increased at 4.6%, which exceeds the 4% inflationary target, and also exceeds the 3.4% I achieved in the previous year. In most cases, my property manager attempts to raise the rent 4% at the time of renewal — this is evident by the numerous properties that show a 4% increase. Some properties did not increase at all, either due to a multi-year lease or the tenant’s successful negotiation to keep the rent the same.
Several properties achieved a double-digit percentage increase in their rent. In nearly all those cases, this was due to placing a new tenant at a much higher rent than the previous tenant was paying; but at Property #10, this was due to a Section 8 rent increase that was (finally) approved by the Memphis Housing Authority.
A2 Change in Equity
While cash is king in rental property investing, appreciation is still part of the equation. Particularly when using leverage, small increases in home prices can mean big returns — you capture all the appreciation, even if you’ve only put 20% or 25% down on the house. You also get the paydown of mortgage principal on those properties, yet another way to create positive returns.
On the flip side, capital expenses must be considered in this section as well. As I’ve argued before, capital expenditures are not true expenses, and are better understood as increases in the cost basis of the home; therefore, capex reduces your appreciation, not your cash flow. Here is where that reduction in appreciation will come into play.
Let’s look at each of these pieces that are part of the equity calculation — true appreciation, mortgage paydown, and capex — and see where those numbers landed in my portfolio last year.
True Appreciation
This one is pretty simple: how much did the value of each home increase in the last year? I track home values using the Zillow Zestimate, which has its flaws but it is nonetheless a straightforward way to see changes over time, and takes my own personal bias out of the equation.
This year, home prices experienced a significant pop — much larger than in 2020, in fact. Earlier this year, I wrote an in-depth article about the underlying factors that I believe are the causes of the hot market, and argued that it does not represent another bubble like 2008. Still, these price increases can’t last forever. But they’ve certainly been great for the value of homes in my portfolio — let’s compare my home values in January 2022 vs. January 2021:

Overall, my home values increased by about 33% last year, which is…completely bonkers. Are these increases real? While there’s no doubt prices have gone up sharply, part of me is skeptical. Some of this may have to do with changes that Zillow seems to have made to the price algorithm this year: the very evident “herding effect” of the Zestimate values that I saw last year are much less present this year, as there are larger variations between properties; all values are now rounded to the nearest $100; and there were instances where a value went up more than 10% in a single month, which almost HAS to be an algorithmic change, and not a change in the comp data being used.
So Zillow may have made some changes here — but whether it was 33% or something less, prices definitely went up quickly. This sets the stage for pretty insane total returns on cash invested, given that most of these properties are leveraged…
Mortgage Paydown
Home equity also increases each month on leveraged properties due to the loan principal slowly being paid off. This is the portion of rental property returns that is pretty much guaranteed — and as a bonus, it accelerates over the life of the loan.
Here’s a picture of the reduction in loan balances I experienced in 2021, which added another $17K to my annual returns (you’ll notice that three of the properties have no mortgages):

It sure is nice to see your loans melt away over time!
The percent reduction of each loan is a function of the loan’s interest rate: the higher the interest, the lower the percent paid off. (The maturity of the loan also matters — of course the percent reduction will increase over time, but all these loans were originated within a few years of each other.) My nonconforming loans on Properties 1, 14, 15, and 16 have higher interest rates than the conventional loans on the balance of properties, which is why their balances are shrinking more slowly in the early years of the loan. (Yet another reason why conventional mortgages are your precious “golden tickets”!) I’ll be looking to re-finance these loans later this year after the 3-year timeframe in which they’d be subject to pre-payment penalty expires.
The reduction for Property #18 was less because the loan originated mid-year (which completed my first BRRRR!)
Capital Expenditures
While I have MORE equity due to appreciation and mortgage paydown, I have LESS equity due to capital expenditures, which increase the cost basis of the property — in other words, they increase my cash invested into the house.
My capital expenditures in 2020 were ~$11K, but they were more significant in 2021. Here’s a quick summary:
Property #7: $8,588 to replace walls and floors (due to water damage)
Property #11: $4,072 for a new HVAC unit
Property #13: $2,440 for a new furnace and new dishwasher
Property #14: $1,815 for a new furnace
So that’s a total of $16,915 in capex. Investors use various methods to estimate and budget for capital expenditures. Some assume a percentage of the value of the properties each year, typically 1%. Others prefer to use a percentage of rent, usually 8% or 10%. Some prefer a fixed dollar amount per month per unit, such as $100.
Using each of these three methods yields slightly different values, but all of them are in line with my ~$17K in spend:
1% of home value: $2.01M x 1% = $20,100
8% of rent: $224K x 8% = $17,920
$100 per unit per month: 18 x 12 x $100 = $21,600
Total Change in Equity
Now let’s put all of these pieces together — appreciation, mortgage paydown, and capex — and calculate the total change in equity for the year:

Let me explain the two ROI numbers I calculated here:
TTL Equity ROI: Compares the total change in equity to the value of the property at the beginning of the year.
CoC Equity ROI: Compares the total change in equity to the total cash invested into the property.
Said a different way, my total equity across these 18 properties grew at a rate of 34.4% relative to their value at the start of the year, and at a rate of 101.7% (more than double!) relative to the amount of cash I have invested in the properties.
Obviously, these are absolutely insane numbers. I’m an investor who doesn’t count on price appreciation at all in my investing strategy — it’s just the icing on the cake that is cash flow. In that sense, 2021 was like a cake with WAY too much icing. This simply can’t go on forever, and with the promise of the Federal Reserve raising interest rates pretty aggressively in 2022, I fully expect a slowdown in price growth, or even a pullback — which would be fine, given the huge increases in the last two years. (And there’s a silver lining: it would make it easier to acquire new properties!)
A3 Total Returns
To calculate total returns, we’re simply going to add together the cash flow and equity portions that we’ve already calculated. Total returns is an important number — particularly your rate of total returns on cash invested — because that’s what you would mentally compare against other types of investments. For example, the stock market has historically returned ~10% total returns (before adjusting for inflation); if your rental properties are yielding total returns on cash of 10% or more, then you can assume that you’re beating the stock market. (Yes, I know that doesn’t include real estate transaction costs, taxes, and other factors — but my epic Stocks vs. Rental Properties article contemplates ALL those factors, if you want to dive deep into that perennial debate.)
Anyway, here’s what my Total Returns look like for 2021, putting together all the numbers that we’ve looked at so far:

Here’s how I calculated the three rate-of-return metrics above:
Total ROI: Compares Total Returns to the value of the property at the beginning of the year.
Total RoE (Return on Equity): Compares Total Returns to my total equity in the property at the end of the year.
Total RoC (Return on Cash): Compares Total Returns to the total cash invested into the property.
Or said a different way, my Total Returns across these 18 properties were equal to 37.8% of their value at the start of the year, 49.6% of my current equity in the properties, and 111.6% (again more than double!) of the amount of cash I have invested in the properties.
Despite having a decent cash flow year, it’s obvious how much of these numbers were driven by price appreciation. In fact, the gains in equity were about 10x the gains achieved through cash flow. In that sense, the numbers are a bit deceptive, and I certainly don’t expect this rate of appreciation to continue. More important to me is that the portfolio continues to meet its expected rate of CASH returns, which I DO expect to continue, and which provides the foundation for the financial and work freedom that I currently enjoy. In other words, the huge jump in equity is nice, but I can’t buy groceries with home equity — instead, it’s the cash flow that was my ticket out of the office, and continues to provide me greater choice and flexibility than I’ve ever had before.
B Tenancy Results
The second large section of the Annual Checkup will be a close look at tenancy. While these factors influence the financial results that we’ve already reviewed, it’s important to break them out separately to understand them — just as variable costs of maintenance & repairs can make or break a property’s financial results, so can your ability to keep your properties occupied with quality tenants.
Or, actually — your property manager’s ability to do so. Because my PM is fully responsible for keeping my properties occupied with strong tenants, this entire section is largely a reflection of their degree of success with this critical task.
B1 Occupancy Rate
This key metric is simply a measure of the percent of the time that your properties are occupied. (Just as often, the inverse metric, Vacancy Rate, is used — but I like Occupancy Rate better, simply for psychological reasons. It just seems more positive, right?) In my expense modeling, I always use a 5% vacancy factor (assuming 95% occupancy), because I know that some percentage of the time I won’t be collecting rent on properties, such as when they are being turned between tenants.
So the question here will be: did my portfolio exceed the 95% occupancy threshold that I budgeted for?
Calculating vacancy rate is pretty simple. Each combination of a month and property (i.e. April at Property #3) is a slot to be potentially filled — this serves as the denominator of the fraction. The number of slots that were, in fact, occupied, is the numerator. For example, if you owned two properties for the full year, that’s 24 “tenant month” slots; if the first property had no vacancy, and the second property was vacant for 1 month, that’s 23 out of 24 tenant months that were actually occupied. So your occupancy rate would be 23 divided by 24, or 95.8%.
One quick caveat: I count a property as occupied if I’m collecting rent on it, whether or not a tenant is actually living there. For example, in a lease break situation where I retain a 1-month security deposit after the tenant moves out, I count the property as occupied for that additional month. Conversely, if a tenant IS in place but I’m never able to collect rent for that month, then I count the property as vacant. This aligns with my pro forma modeling, which does not budget for vacancy in the strict sense of the word, but instead for months where rent is not collected.
Using this math across my 2021 portfolio, here’s what I found:

In total, these 18 properties maintained over 95% occupancy in 2021. This is a solid result that is slightly better than my modeled expectations.
Blue highlights indicate periods of a tenant turnover. In many of these cases I retained a security deposit, which is why I show as fully occupied during some months of those turns. Also note that the turn at Property #13 was already included in the 2020 update, and the vacancy at Property #18 (on one side of the duplex) was not a turn, but rather an initial rehab — so neither will be included in the Turn summary below.
Red highlights indicated evictions — as you can see, they take a long time to resolve. The eviction at Property #9 is still ongoing.
B2 Tenant Turns
Turning properties between tenants is a big driver of cost in any rental portfolio. It’s the dreaded “double whammy”: not only do you have to pay for the work to get the property ready for the next tenant, you’re also not collecting any rent during that period. (To add insult to injury, you also have to pay for utilities and lawn care during the turn — so it’s nearly a triple whammy!)
Proper management of tenant turns can therefore be a critical way to ensure the success of rental property investments. There are three primary objectives when it comes to turns, and they’re all worth monitoring in my annual checkup. In a perfect world, I want turns to be:
Infrequent. By screening tenants properly upfront, providing them with a quality home, and responding professionally to any issues they’re having, my PM can make it more likely that tenants will stay longer, which decreases the number of turns I have to do in any given year.
Short. If turns must occur, I want them to be as short as possible. This is a measure of how efficiently my PM can complete the rent-ready work, and get a new tenant in place.
Inexpensive. If the home was maintained properly during the tenancy (by both the tenant and the PM), and if the property was up-to-standard beforehand, then turns should be relatively cheap; if not, they can get quite costly.
Let’s see how well I achieved those three turn objectives in 2021.
Frequency
How often should you expect to turn a property? The less the better, of course — but I want my tenants to stay at least 3 years, on average. This means that in any given year, I should expect to turn about a third of my properties. We’re examining 18 properties in 2021, so turning 6 properties would have been an average year by this standard.
Instead, I only turned 3 properties — #2, #7, and #17. There’s a few caveats here: first, Property #9 has an ongoing eviction, which will inevitably result in a turn. But I’ll count that in next year’s turns. Also, Property #19 (which I’m excluding from this report because I didn’t own it the full year) also had a turn. If you count that one, I really had 4 turns. But either way, from the standpoint of turn frequency, 2021 was much better than expected. The same was true in 2020, when I also had only 3 turns. If that pattern continues, it means that my average tenancy is exceeding 3 years, which would be great news for my long-term returns.
Duration
Were those three turns performed efficiently? Let’s take a close look at them:

I think all three turns were a success from an efficiency standpoint. In general, I’d say that any turn completed in less than 30 days is a huge win, and anything under ~60 days is acceptable. Only when the turn stretches into its third month would I become concerned and disappointed. The turn at Property #7 was right at the edge of this 2-month deadline, but given the extraordinary circumstances (major water damage, a bee colony in the walls, and more), let’s call it a win.
It’s worth noting the various ways my PM contributed to the efficiency of these turns. First, they consistently provided a scope of work for approval within days of having access to the property. (The 8-day period for Property #7 was on me, since it took me a bit longer to finalize and approve the scope.) Second, even the VERY large scope at Property #7 was completed in less than 6 weeks, with the others completed much faster. And third, the leasing team found qualified tenants quickly for all three properties, often signing leases before the maintenance work was even finished.
Cost
As we’ve already seen, turns were a major driver of my maintenance expenses in 2021 — and I do expect that my initial turns (the first ones I perform after buying the properties) may be a little more expensive as I get them up to standard in certain areas. Therefore, costly turns may be a fact of life for me for several years to come, since I chose to buy many of my properties when they were occupied with tenants, and only a handful of my houses were full turnkey properties when I bought them.
I expect a typical turn to cost between $1,500 and $3,000 — any turn under $1,500 is cheap, and one that exceeds $3,000 is relatively expensive. Here’s a glance at the three turns I did in 2021, and their costs:

Conclusion
When you go to your doctor for a physical nowadays, you often get the results through an online dashboard that lays out your numbers, highlights areas where there may be issues, and suggests how you can improve.
So I put together the same kind of dashboard for the health of a rental portfolio, incorporating all the key areas and metrics we’ve reviewed in this article. Here’s what mine looks like for last year:

Here are my key takeaways from this annual checkup:
Overall, it was a great year. Rapid price appreciation — even more rapid than in 2020 — fueled sky-high rates of return on my invested dollars. I don’t expect this to continue in 2022.
My cash flow model is sound. The portfolio is producing the cash that it’s supposed to, which gives me confidence to continue to acquire properties using the same assumptions that are built into the RIA Property Analyzer.
My property manager is getting the job done. From occupancy rate to rent increases to management of turns, my PM has been a reliable steward of my portfolio.
Maintenance expenses were quite high, driven in particular by costly turns. This has now been true for two years running. If the same pattern holds in 2022, I will lower my pro forma expectations for future years accordingly.
About the Author
Hi, I’m Eric! I used cash-flowing rental properties to leave my corporate career at age 39. I started Rental Income Advisors in 2020 to help other people achieve their own goals through real estate investing.
My blog focuses on learning & education for new investors, and I make numerous tools & resources available for free, including my industry-leading Rental Property Analyzer.
I also now serve as a coach to dozens of private clients starting their own journeys investing in rental properties, and have helped my clients buy millions of dollars (and counting) in real estate. To chat with me about coaching, schedule a free initial consultation.