Memphis Rental Property #10
Last updated: 2026
NOTE: This article was published in 2026, but the house was bought six years earlier, in 2019. Refer to the Annual Updates section at the end of the article to see how the property has fared since then.
Here is Property #9 in my Memphis portfolio — with this house, I hit double-digits of rental properties. Quick review: all my properties between #3 and #16 were purchased very quickly from May to September of 2019. This was my opening acquisition sprint after I left my office job, sold my primary residence, and used the proceeds to invest in a portfolio of cash-flowing rental homes.
This is a pretty typical home in my portfolio. It has 3 beds and 2 bathrooms, sits in in a C+/B- neighborhood, and was built in 1990 (newer than many other houses in my portfolio.) One notable thing about this property: at the time of writing in 2026, it’s one of the few remaining properties that I have never turned, meaning that the tenant I inherited at closing still resides in the property. That has been great for my operations & cash flow so far, though of course that first turn may be a doozy.
Unlike Property #9, this one ticks all the boxes of my buying criteria, and I would absolutely buy the same house again today.
Alright, let’s take a closer look at this house and deal!
Property #10: The Deal
I found this house the simple way: on Zillow. From this point forward, public listings became my primary source of deals, which suited me just fine — I was confident in what I was looking for, in my ability to run numbers, and there’s always lots to choose from on MLS.
The house was being offered at $109,900, and had a tenant in place at $958/mo. This was a Section 8 tenant, the first I had encountered in my property search. It was a 3-week-old listing that I judged would sell pretty quickly. I initially offered $100K, and after a few counters, I ultimately settled on a purchase price of $102,500.
Here are some additional facts about this particular house:
3-beds, 2 full bath
In the 38128 zip code (popular area; I own several in this zip)
Built in 1990
1135 square feet of interior space
Central air
LVP & tile floors
Driveway, but no covered parking
Tenant in place paying $958/mo.
Big tree in the front yard (more on this later…)
Property #10: Due Diligence
As with Property #9, it appears I did not do a licensed home inspection, and instead relied on a a rehab scope from my property manager at the time. (I really can’t believe I did this — I’ve learned a lot since then!)
As a result, I didn’t really have great info on the age and condition of the roof, HVAC, furnace, or water heater. But the info and photos I did get from the rehab scope indicated that the home was in really nice shape, and that the tenant kept up the property very nicely. There were no major concerns called out, and as a result, I felt confident moving forward to closing at the contract price of $102,500.
Rhe tenant had moved in just under a year before, and had a spotless payment record, so no concerns there.
The house appraised at the purchase price, with no repairs needed, and we closed at the end of May 2019.
I have almost no photos of this house that would be useful here — the original listing photos are lost to history, and I’ve never turned the property. Just to have SOME visual reference, here’s a terrible photo of the front of the house:

Property #10: The Financials
For this one, I secured a conventional loan at 4.7% fixed rate over 30 years. The loan is actually in my spouse’s name alone, a strategy you can use as a married couple to expand your access to conventional financing (max of 20 loans vs. the normal 10).
I used the RIA Property Analyzer to run the final numbers on this property, and here’s what I came up with for an initial pro forma:
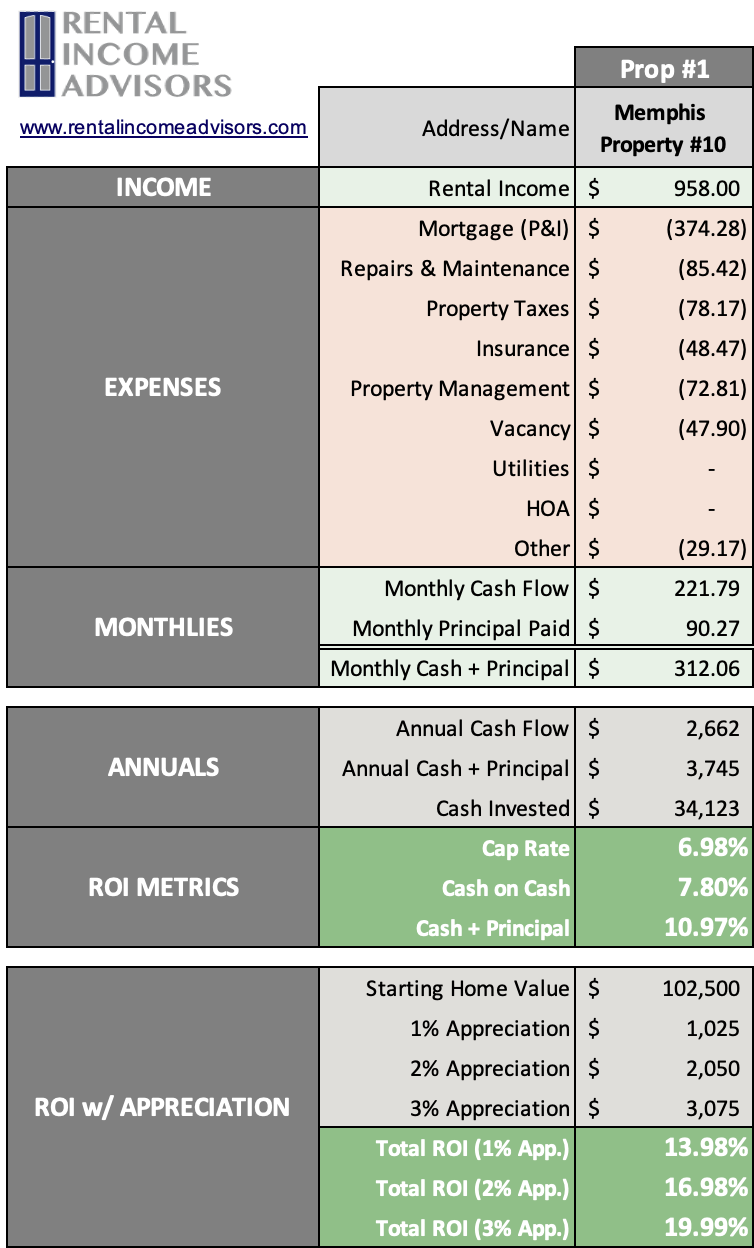
Purchase Price: $102,500
Monthly Rent: $958
Monthly Cash Flow: $221
Cap Rate: 7.0%
Cash on Cash Returns: 7.8%
Total ROI 2% Appreciation: 17.0%
(Want to use this calculator? You can!)
OR
Using the multi-year model in the RIA Property Analyzer, we can visualize some of the main long-term trends assuming a long-term inflation rate of 2%:
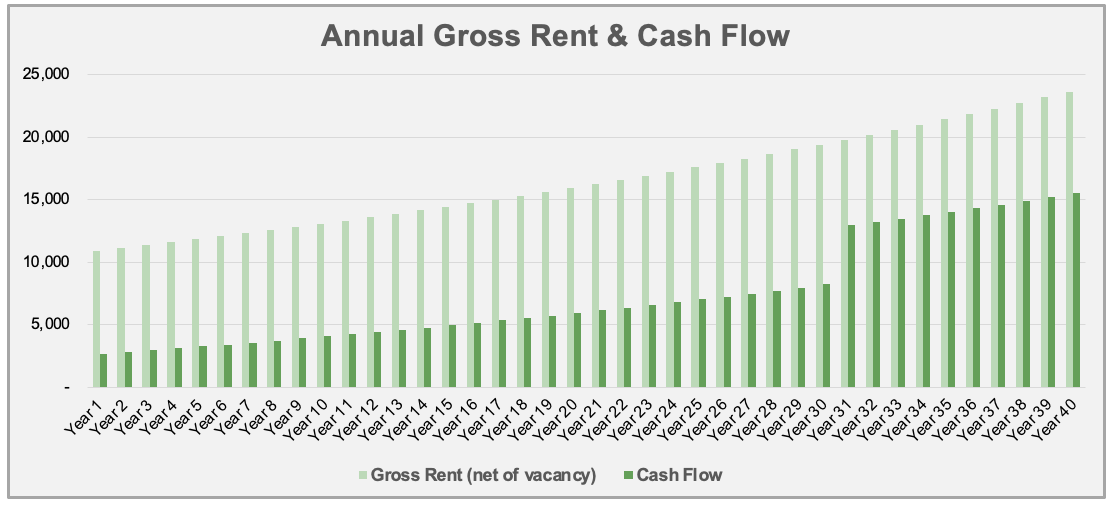
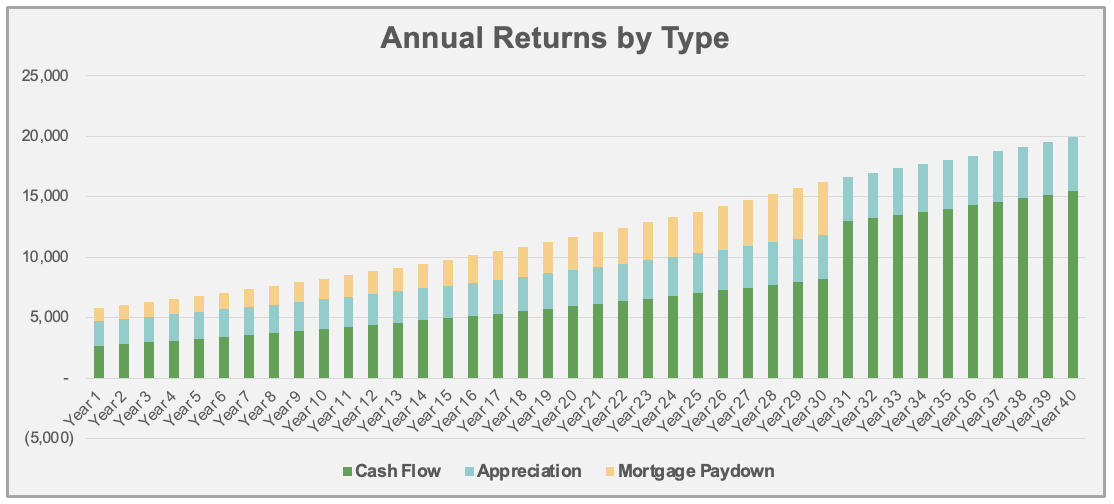
Cash flow increases over time. This is mostly because rent and expenses are expected to rise with inflation, but one major expense (my mortgage) is fixed.
Cash Flow Year 1: $2,662
Cash Flow Year 10: $4,057
Cash Flow Year 25: $7,014
Mortgage paydown accelerates over time. This is because of the way banks amortize loans – each month, a little bit more of your fixed payment is principal, and a little bit less is interest.
Mortgage Paydown Year 1: $1,107
Mortgage Paydown Year 10: $1,696
Mortgage Paydown Year 25: $3,454
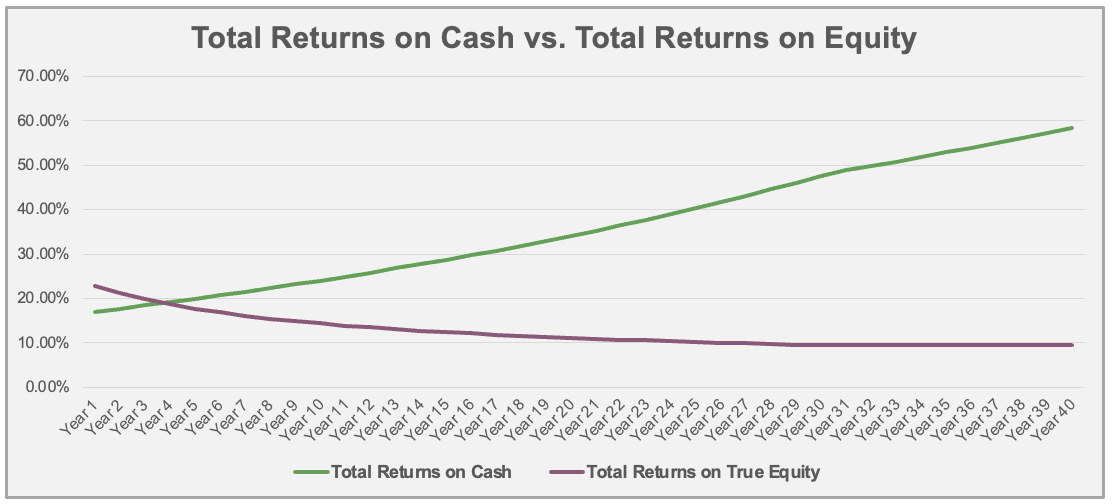
Total returns on cash increases over time. This is a consequence of the first two graphs – I will make greater total returns over time on the same initial investment of cash.
Total Returns on Cash Year 1: 17.1%
Total Returns on Cash Year 10: 24.0%
Total Returns on Cash Year 25: 40.3%
This is a near-perfect example of a C+/B- rental property. The cash flow is strong, and should increase over time. But I also expect to make a lot of money from paying off the mortgage, and through long-term price appreciation. A home like this is in the absolute center of the “buy box” for most of the private coaching clients I work with.
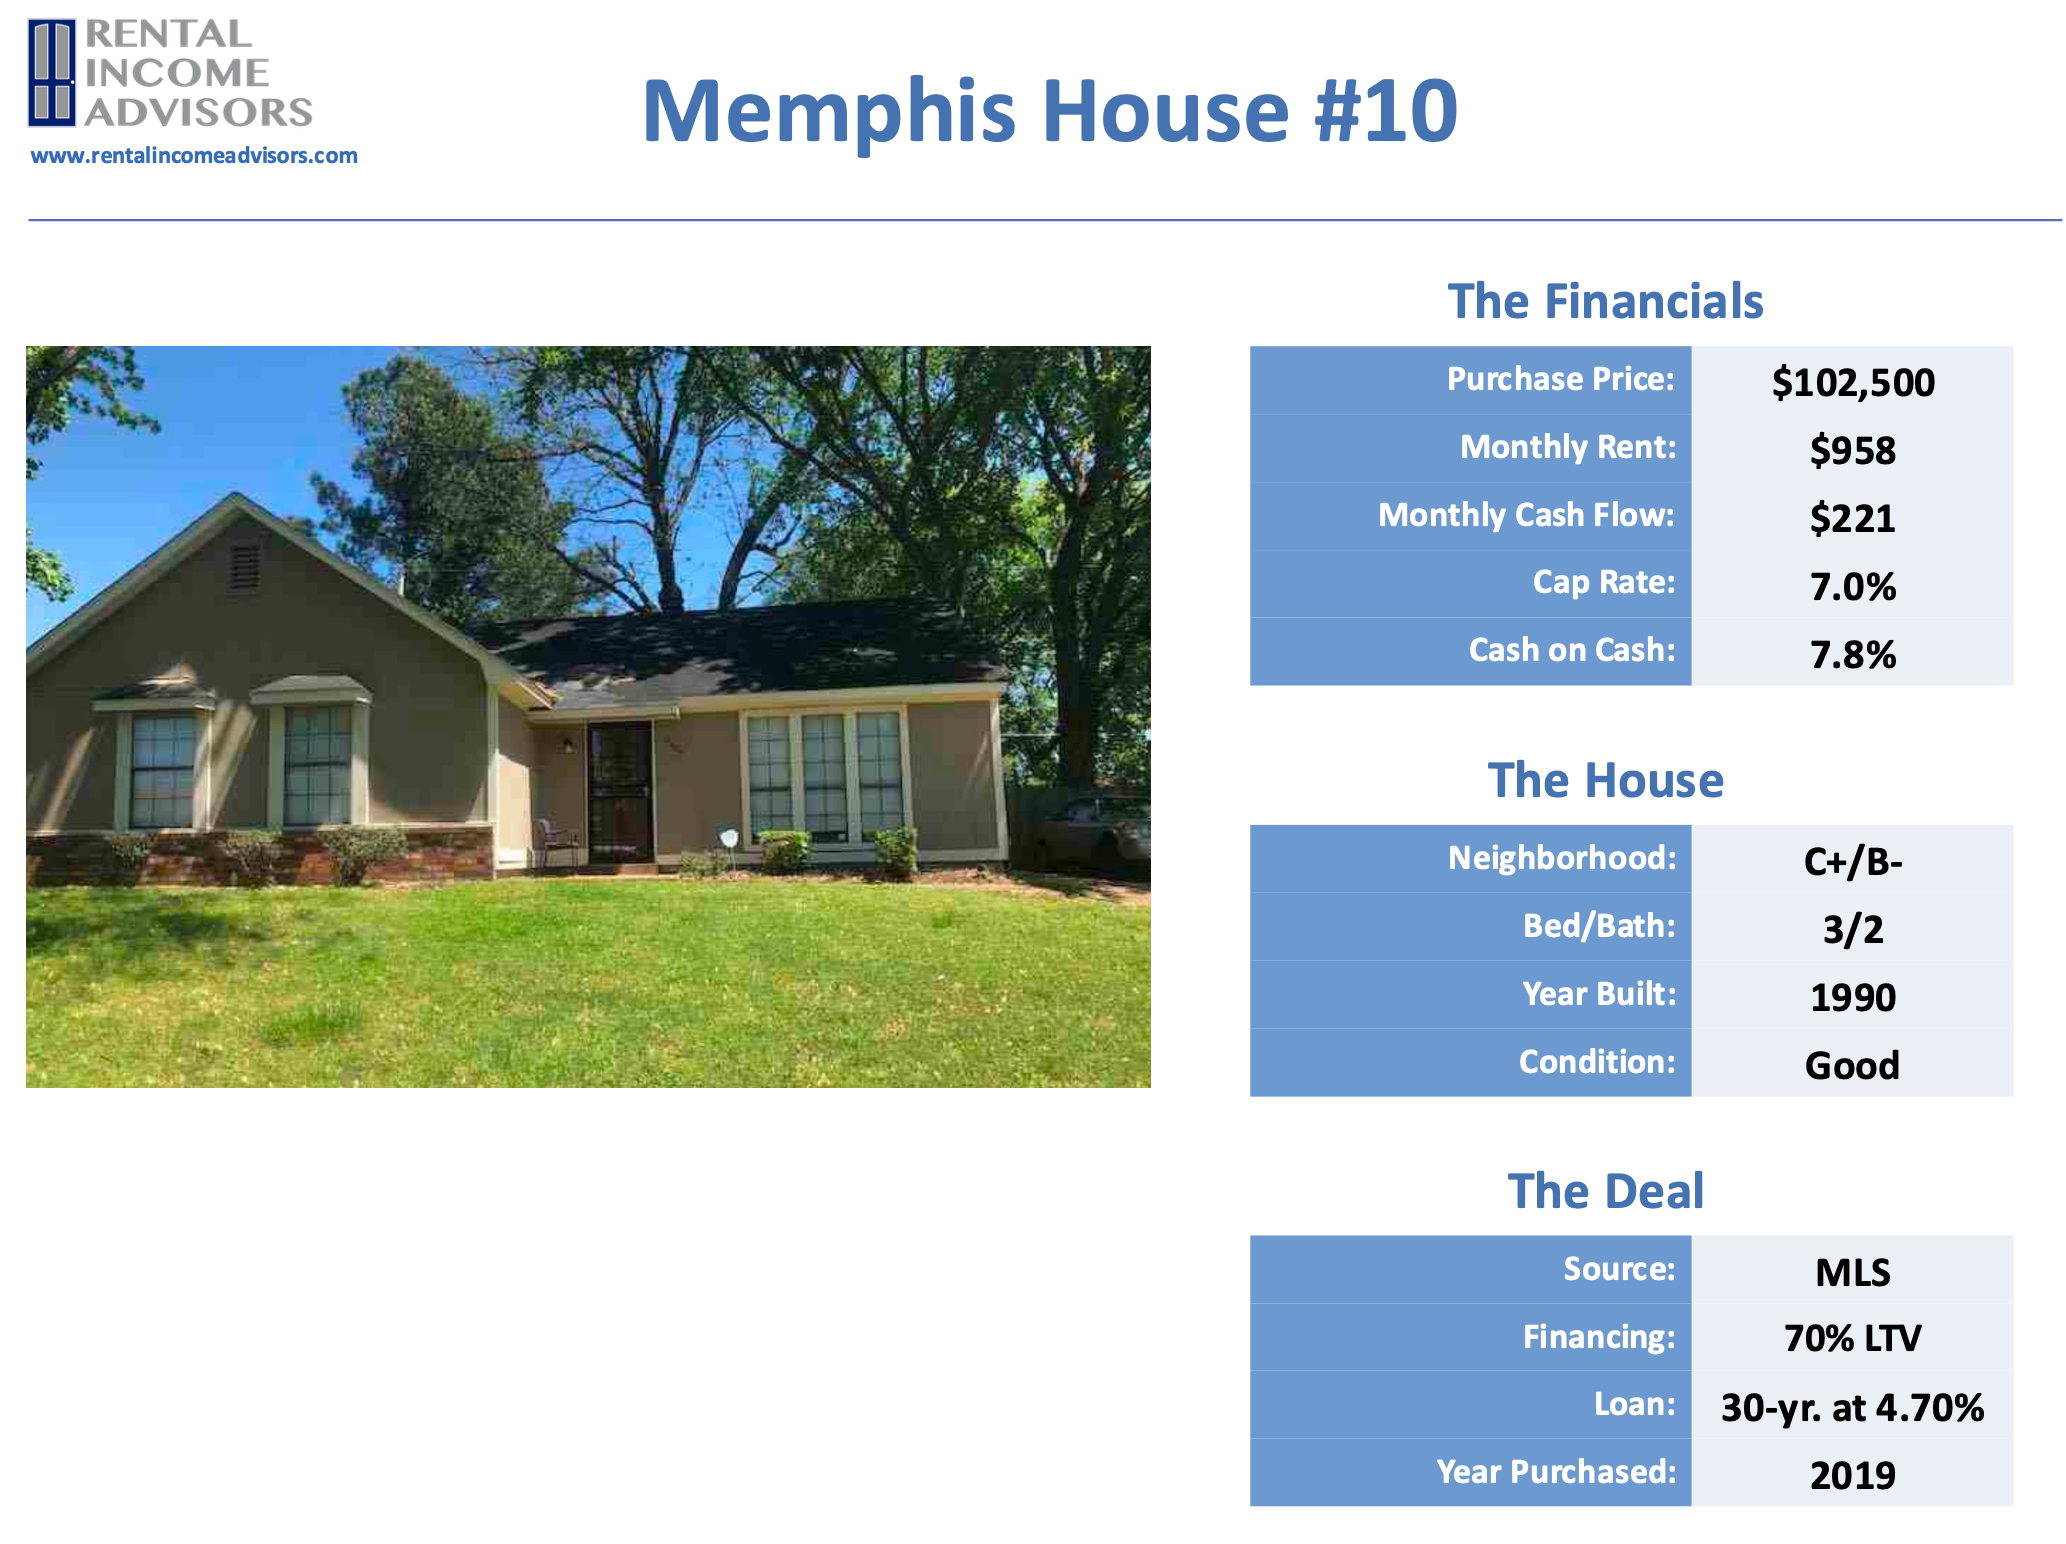
Property #10: The Deal Sheet
Finally, to sum up Property #10 and its financials, here’s the full “deal sheet”:
Looking for YOUR Next Property?
If you need help finding, analyzing, and purchasing YOUR next property — or your first one! — schedule a free initial consultation with me. I’ve helped over 100 private coaching clients invest with confidence and build cash-flowing rental portfolios of their own.
Annual Updates
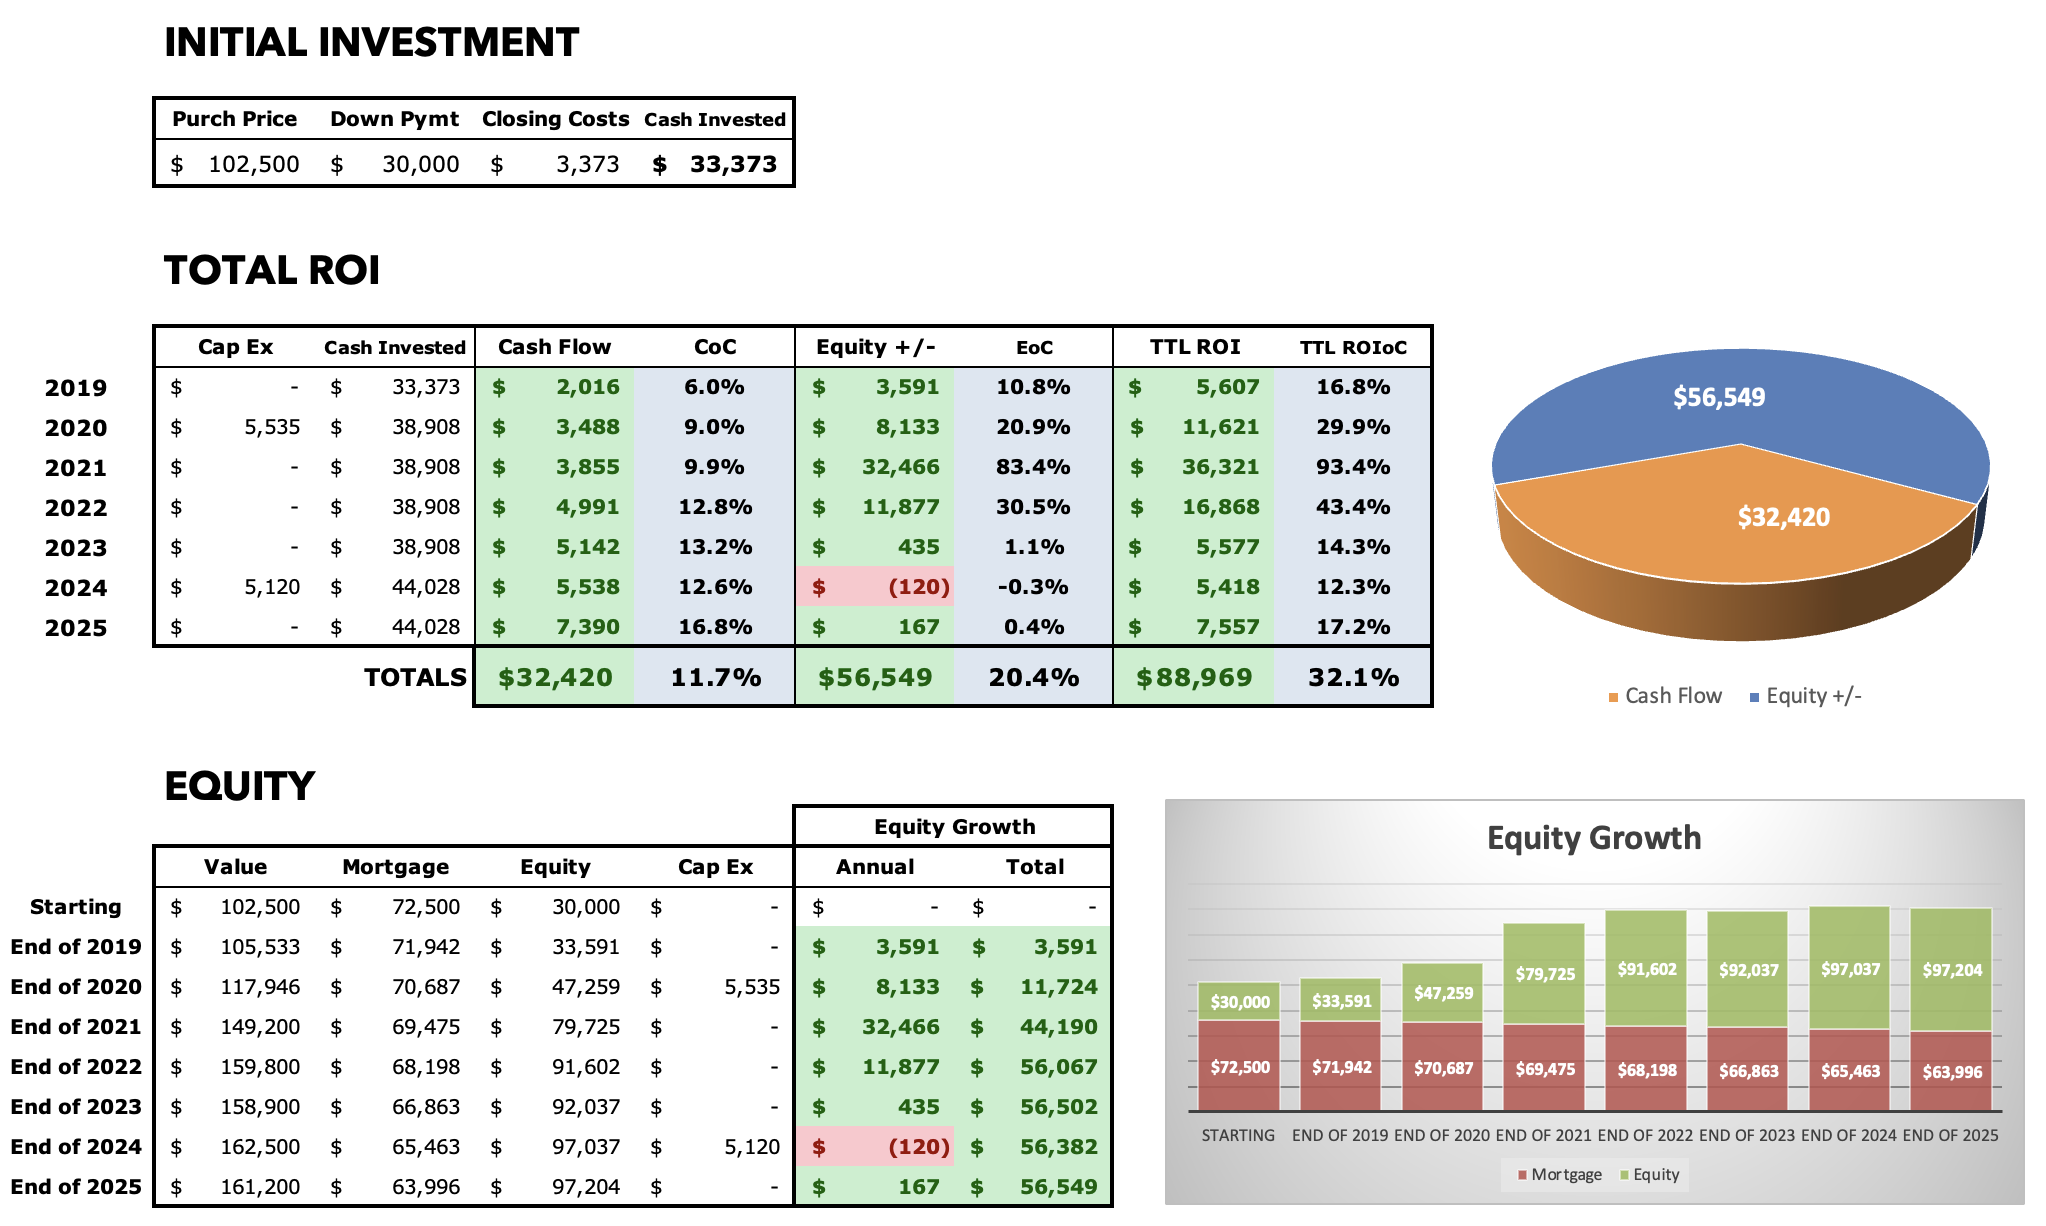
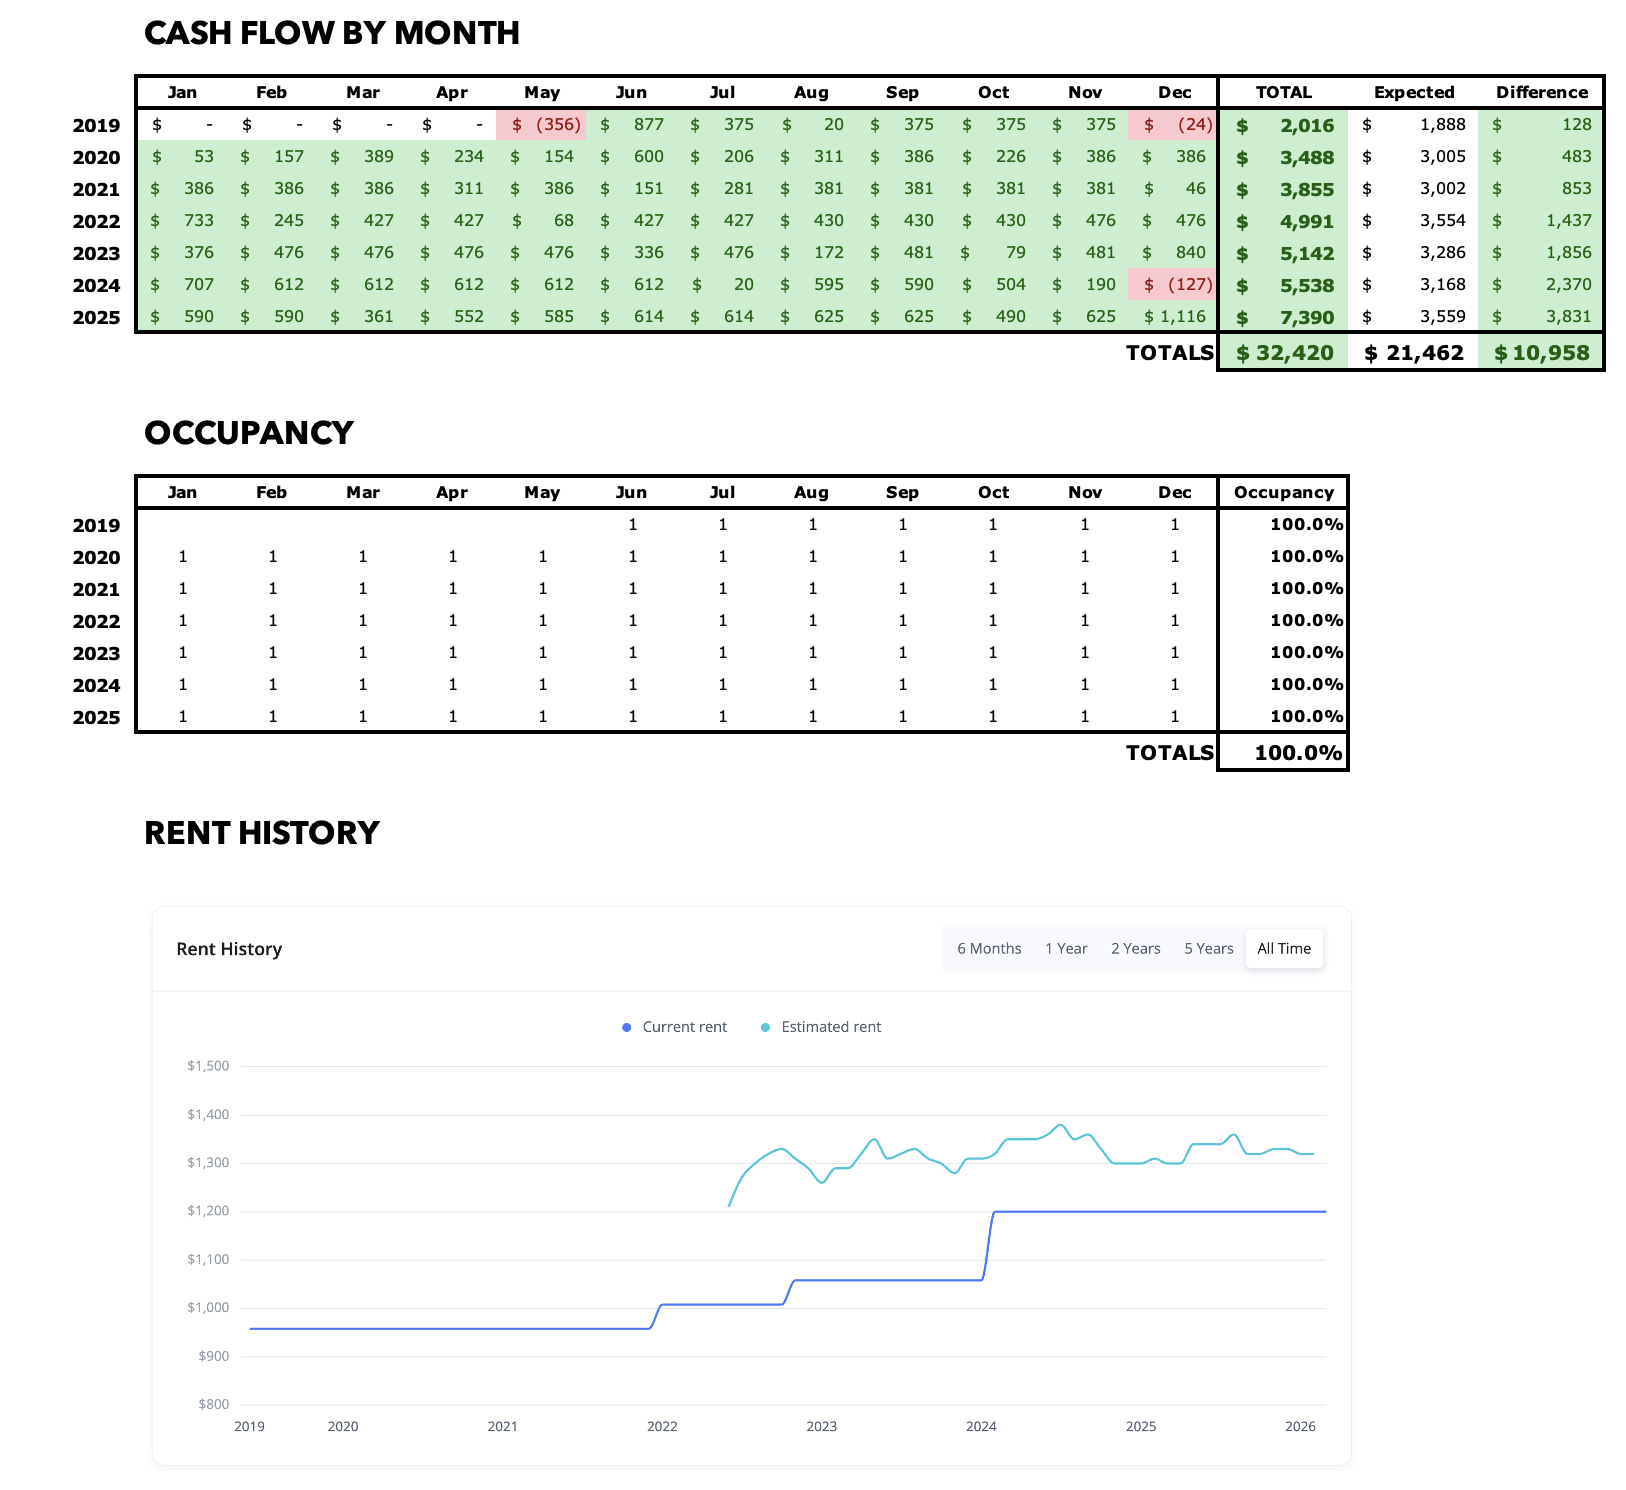
For all Property Spotlights, I come back at the end of each year to provide a brief narrative of what happened at the property that year. I also update my annual and cumulative figures for the property, including cash flow, equity growth, and occupancy.
2019
I had a few minor repairs in the months after I bought the property, but other than that, things went very much as planned from June to December, and the property produced $2K+ in cash flow.
2020
The first occupied home inspection at this house revealed a few leaks coming into the house from above, and we made the decision to replace the roof at a cost of $5,500. (Boy, roofs cost a lot more than that here in 2026!) In hindsight, the roof was clearly quite old at the time of purchase, something I would have known had I performed a licensed home inspection.
There were also a half-dozen small maintenance issues totaling another $1,300, including plumbing, hvac, electrical, and door issues. Cash flow was $3K+, but of course I had to come out of pocket for the roof.
2021
The property stabilized nicely in its third year. The tenant continued to pay $958/mo., though I started the process of inquiring about a rate increase through the Memphis Housing Authority that administers the Section 8 program. But that can take a while to get reviewed & approved.
I only had $400 in maintenance costs for the year, which allowed me to increase my cash flow to $3,800. Like most of my properties, home values spiked this year due to the post-pandemic boom.
2022
At the beginning of the year, MHA finally approved a rent increase, but they had adopted a pandemic-era policy of only increasing rent by $50. So the tenant’s rent increased to $1,008/mo., still very far below the current market rent for this house.
It was another quiet year for maintenance, with just $600 required to fix the outside gate, a kitchen cabinet, and a toilet. Cash flow increased again to nearly $5K, my best year yet at this house.
2023
I was able to get another $50 rent increase from MHA at the beginning of the year, raising the tenant to $1,058/mo.
Like last year, we had just a few small technician visits to deal with minor issues, at a cost of $650. Cash flow was just over $5K.
2024
We requested, and finally received, an appropriate rent increase from MHA to $1,200/mo. The tenant continues to pay a small portion of this rent themselves, while the rest comes to me directly from MHA. This rent is now somewhat close to market rent.
We had more significant maintenance issues this year, however, almost all of which was plumbing-related. Remember that big tree in the front yard that I mentioned? Its roots had grown into the sewer line under the front yard, causing repeated backups and toilet issues. We finally did a sewer scope, saw the blockage, and realized we needed to fix the problem at the source. So we removed the tree, and dug up & replaced the damaged section of sewer, which amounted to over $5K in Cap Ex for me.
Still, with the tenant’s higher rent, cash flow was strong at $5,500.
2025
We did not ask for a rent increase this year, so the tenant stayed in place at $1,200/mo. They have now entered their 7th year as a tenant while I’ve owned the house, which of course is great for both parties.
Very quiet with repairs, which came in under $400 for the year. That allowed for my best cash flow year ever at this house: $7,400.
About the Author
Hi, I’m Eric! I used cash-flowing rental properties to leave my corporate career at age 39. I started Rental Income Advisors in 2020 to help other people achieve their own goals through real estate investing.
My blog focuses on learning & education for new investors, and I make numerous tools & resources available for free, including my industry-leading Rental Property Analyzer.
I have also served as a coach to over 100 private clients starting their own journeys investing in rental properties, and have helped my clients buy millions of dollars (and counting) in real estate. To chat with me about coaching, schedule a free initial consultation.