Stocks vs. Rental Properties: Which is a Better Investment?

Last updated: 2023
The debate has raged for decades: which investment offers the best returns, stocks or rental properties?
It seems like a simple enough question. Some say the answer is simple, too – after all, stocks have historically returned almost 10% each year, whereas home values have historically increased at the rate of inflation (just 2-3% in recent decades) – so stocks are the clear winner. It’s not even close, they say.
Well, whoever says that is flat wrong. The truth is the opposite: rental properties are the clear winner. And I will prove it in this article.
There are countless articles already written on this topic. The vast majority of them are quite useless, offering only a cursory overview of the historical performance of the two asset classes, and discussing the pros and cons of each while relying heavily on non-committal “on one hand, on the other hand” equivalencies. Some attempt more robust numerical analysis, but many of those are flawed, incomplete, or over-simplified.
If you read my blog regularly, you already know this article will not be like that. I will not present any investment philosophy in this article, nor will I discuss non-numerical pros and cons. It will not be about what I like or prefer. The question of stocks vs. rental properties is a math and modeling problem. Therefore, what follows will strictly be about the math, and will be as thorough and robust an analysis as exists anywhere else online.
Here’s the crux of the question I will seek to answer: if you had, say, $28K to invest right now, would you make more money investing in the stock market or in rental properties?
Let’s focus on the two most accessible (and most common) investment strategies in each realm. For the stock market, we’ll look at total market index fund investing, as exemplified by Vanguard’s VTSAX fund. This eliminates the vagaries of stock-picking and market-timing, and instead tracks the total stock market over the long term. For real estate, we’ll look at buy & hold rental properties purchased in rent-ready condition, and not consider trickier strategies like house flipping, or buying and rehabbing distressed properties. By focusing on these two strategies, we are are comparing the two assets in their purest, simplest forms.
Here’s what the math shows when we compare these two basic strategies:
If you invested that $28K in a broad-based index fund, and didn’t touch it for 40 years, you could expect to have just over $1M (that’s one MILLION dollars). Not bad at all, right?
But if you invested that same $28K in a rental property, you could expect to have over $1.6M at the end of 40 years.
And if you reinvested that rental property’s cash flow into a few MORE rental properties, you could have over $2.2M.
Don’t believe it? I don’t blame you. I could barely believe it myself when I ran the numbers.
But it’s the truth. In this article, I will walk through the math step by step to show you how I reach these conclusions. It’s pretty mind-blowing, actually.
One caveat: throughout this article, I will make reasonable assumptions based on historical data, and based on current features of our investing environment (such as mortgage rates, tax laws, and so on.) I will always state those assumptions clearly and explicitly, but of course things may change in the future, and that could change the conclusions I reach. In other words, my analysis and conclusions hold true if you are investing money at the time of writing, but may not necessarily hold true forever.
Still, the main conclusion – that rental properties offer much better long-term returns than the stock market – is remarkably resilient even when we change some key assumptions to model a future environment that is less favorable to rentals. I’ll demonstrate some of those alternate scenarios at the end of the article.
One other note: some people may object to the terms of this discussion because “stock market index funds are passive, but rental properties are active”. There is some truth to this – rentals certainly require more work than buying VTSAX. This is mostly true in the acquisition phase; once you buy a house and turn it over to a professional property manager, it is almost completely passive. But regardless, I’ll be ignoring this facet of the discussion and focusing only on the numbers. Both stock and rental property investing are (largely) passive asset classes available to all investors, so I believe it is still an apt comparison.
Alright then! Terms of discussion set. Asterisks marked. Caveats…caveated. Let the epic showdown begin!
Stock Market Returns
Let’s start by calculating expected returns in the stock market. This is a relatively simple matter (mercifully so, given that the rental property side of the equation will NOT be so simple.) I will make the following assumptions for stocks:
An initial investment of $28K. I use this amount because that is the same initial investment needed for the rental property in my later example, so it will make for easy direct comparisons.
Annual inflation-adjusted returns of 7%. This is based on historical average stock market returns since 1950, as explained in this article.
All dividends are reinvested. This is already “baked in” to achieve the 7% inflation-adjusted returns, so no further adjustment is needed.
Annual inflation rate of 2.5%. This is the historical average since 1990. Though inflation has been higher in the past, I believe this is the appropriate historical period to use given modern monetary policy, which has been largely successful in forestalling high inflation for over three decades (with the notable exception of 2021-2022, which appears to have been a relatively brief inflationary period triggered by the pandemic and its economic ripple effects — further reading in this article on inflation’s impacts on rental property investing.) This 2.5% inflation will be layered on top of the 7% inflation-adjusted returns, for a total of 9.5% returns in nominal dollars.
Here’s how a $28K investment would grow over 40 years, given the above assumptions:


You’ve turned $28K into over $1M, proving that the stock market can be an amazing tool for wealth-building, and that the power of compound growth should not be underestimated. (“Compound interest is the most powerful force in the universe” is a quote often attributed to Einstein. It’s not clear if he actually ever said this, but…I guess he would know, right?)
A quick note on taxes: there are several tax implications that are not contemplated here. First, a portion of these stock market returns would come in the form of dividends that, even if reinvested, would be subject to income tax in the year they are received. And second, to access these funds at any point in the 40-year period, you’d have to sell the stocks or funds, triggering capital gains taxes on your profits.
I am going to ignore both these tax implications, because the same exact implications will apply to the rental property example that we’ll be comparing against. Rather than complicating matters by solving for these taxes in both scenarios, I’m going to ignore them in both scenarios, preserving a valid, apples-to-apples comparison.
Rental Property Returns
Calculating the total returns for a rental property will be quite a bit more involved. It will require four steps:
STEP 1: Define an average rental property whose financials will be used to drive our calculations and modeling.
STEP 2: Project that property’s financials over a 40-year investment horizon to determine cumulative cash flow and cumulative equity growth. (Equity growth will occur through both price appreciation and the pay-down of mortgage principal.)
STEP 3: Apply an additional layer of analysis to subtract annual income tax on cash flow, and simulate the reinvestment of that cash flow into either stocks or additional rental properties.
STEP 4: Apply a final layer of analysis to accurately simulate the sale of the rental property, which will come with closing costs and broker fees, and will trigger depreciation recapture tax and capital gains tax.
STEP 1: Define a Standard Rental Property Unit (SRPU)
To begin, we need to agree on what a reasonable, average rental property is – in other words, how much it will cost, what it will rent for, and what expenses it will incur. For the purposes of this analysis, I am going to define a Standard Rental Property Unit, or SRPU for short. (I knew those corporate acronyms from my old career would come in handy someday!)
Here are the stats for the SRPU I will use, which are entirely consistent with an average rental property in my Memphis portfolio:
$100,000 purchase price
$1,000 monthly rent
6.64% cap rate
Purchased with a 30-year fixed rate conventional mortgage at 3.75% interest
25% down payment
$3,000 in closing costs
These are not spectacular numbers – they are solid, average numbers. These types of returns are available in Memphis where I invest, but also in many other markets all over the country. (Note: this low mortgage rate was available at the time of writing, but may no longer be when you’re reading this. But don’t dismay — I address the impact of higher mortgage rates at the end of the article.)
All the numbers above are self-explanatory, with the exception of the cap rate. (Quick review: cap rate is a measure of your unleveraged rate of return, calculated by dividing your net income (ignoring your mortgage payment) by the purchase price of the property.) To arrive at a 6.64% cap rate, I’ve made some assumptions about expenses:
Repairs & Maintenance: 1% of the purchase price ($1,000) annually.
CapEx: 1% of the purchase price ($1,000) annually. I don’t normally include CapEx in my calculation of cap rate, for reasons I explain in my article on Estimating Rental Expenses, but I thought it best to include them here to ensure these costs were baked in every year; this way, we don’t have to separately address questions like “how often will I have to replace the roof, and how much will that cost?”
Home Insurance: $600 annually. I pay ~$550 for insurance on a typical $100K home, but I’m rounding up for safety.
Property Taxes: $1,000 annually. This is consistent with what I currently pay for a $100K house in Memphis.
Property Management: 8% of rent collected, plus a leasing fee to place a new tenant every two years equal to 50% of a month’s rent. These are the PM fees I am currently paying.
Vacancy: the property will be vacant, or otherwise not generating rent, 5% of the time. My portfolio has been running at only 3% vacancy the last several years, but I want to remain conservative here.
Again, all of these numbers are fully consistent with expenses I incur in my actual portfolio of 25 rental properties, as demonstrated in my monthly portfolio reports.
Plugging these numbers into my RIA Property Analyzer, the cap rate (6.64%) and cash-on-cash returns (8.82%) are automatically calculated, and we can see that the property should produce an average monthly cash flow of $205:

Again, just to drive home the point: these numbers accurately reflect average returns I achieve on properties I own. Many other investors achieve the same (or better). They are not idealized or massaged, and they are not the cream of the crop – they are just AVERAGE. Better returns can certainly be achieved, but I wanted to use returns that are more “middle of the road”. That’s what these SRPU numbers represent.
Alright, now that we’ve defined our SRPU, we can move forward to Step 2.
Free Rental Property Analyzer
To calculate cap rate and other ROI metrics quickly and accurately, an Excel rental property calculator is essential. It lets you quickly answer key questions like:
Which of my target properties offers the best returns?
What will my monthly cash flow be, on average?
What impact will getting a mortgage have on my cash flow, and my cash-on-cash returns?
What will my total returns be after 10 or 20 years?
Those questions can be easily answered with side-by-side comparisons in the RIA Property Analyzer. I guarantee this is the best free rental property calculator out there today, and many of my readers have told me the same. It’s both powerful and very simple and intuitive to use. Check it out!

STEP 2: Calculate Returns for SRPU over 40 Years
To calculate the total returns of a rental property investment, we must look at much more than simply home price appreciation. The total returns actually have three components: cash flow; mortgage pay-down; and price appreciation.
Price appreciation is easy to calculate. But cash flow is trickier, because both rents and expenses will increase over time. Mortgage pay-down also changes each year, because the percentage of a fixed mortgage payment that goes toward the principal increases gradually over the life of the loan.
Fortunately, I have already built a handy and powerful Excel tool that automatically calculates all three of these components over a 40-year investment horizon – the Multi-Year Model in the RIA Property Analyzer.
To drive the Multi-Year Model, I will make the following assumptions about my SRPU over time:
Rent will increase at the rate of inflation (2.5%). I will use 2.5% for the inflation rate here, just as I did in the calculation of stock returns earlier.
All expenses will increase at the rate of inflation (2.5% per year). This includes maintenance, capex, property taxes, insurance, property management, and vacancy. The mortgage payment is the only exception, because it is fixed.
The value of the home will increase at the rate of inflation (2.5% per year). This is consistent with historical price appreciation for homes, which tend to increase only at the rate of inflation. (Actually, home prices have increased slightly faster than inflation for many decades, but we will only assume inflationary increases in this analysis.)
Inputting these assumptions at the top of the Multi-Year Model tab, I can quickly see the cumulative returns over 40 years for each of the three components:

Wait a minute – this shows total returns of only $565K, which is about half as much as we calculated earlier for stocks. Does this mean that stocks are the better investment after all?
Not quite yet. The Multi-Year Model is simplified in a few critical ways that don’t accurately reflect a real-life scenario. To make a TRUE comparison to stocks, we need to solve for those inaccuracies.
STEP 3: Adjust Cash Flow for Taxes and Reinvestment
The Multi-Year Model only tells us what our cash flow will be each year, and adds up those amounts to arrive at the cumulative cash flow. But this ignores a hugely consequential question: what do you DO with that cash flow in the meantime? Presumably you wouldn’t just stuff it under your mattress for 40 years. But that is, in fact, what the model assumes.
In our calculation of stock returns, we assumed that all the funds stayed invested the entire time – in other words, nothing was ever drawn out. In order to maintain parity, we have to make the same assumption for our rental property – namely, that the cash flow is reinvested into something productive, not just stored in a safe somewhere to be devalued over time by inflation.
Therefore, I am going to model a scenario in which the cash flow is invested back into stocks, and another scenario where the cash flow is invested back into more rental properties. (Note: I will NOT model a scenario in which the cash flow goes to pay off the mortgages. This is an obviously sub-optimal strategy that does not deserve much consideration, and you can prove it to yourself with this simple thought experiment: would you take out a loan at 3.75% interest if you knew you could make 9.5% interest by investing that borrowed money? The answer is obviously yes. So why would you ever use available cash to pay down that loan ahead of schedule? You wouldn’t. In this discussion, we’re optimizing for net worth — in other words, determining the most lucrative long-term investment strategy — and therefore, accelerating the payoff of cheap, fixed-rate mortgages is a self-evidently bad strategy.)
But before we can invest the cash flow, we have to pay taxes on it. Like all other income, rental income is subject to annual income taxes. Luckily, the rules are pretty favorable — you get to deduct all your expenses, so only NET income is taxable. (Further reading: The Powerful Tax Advantages of Rental Properties.)
But the yearly cash flow already calculated in the model is NOT the same as the net taxable income. We need to make two adjustments to annual cash flow in order to arrive at the taxable income.
First, we need to SUBTRACT depreciation. Depreciation is a “paper expense” that is claimed on your taxes each year, and represents the gradual deterioration in value of the underlying asset. (Never mind that real estate doesn’t actually depreciate; this is nonetheless how it’s treated by the IRS.) Being able to deduct depreciation reduces your taxable income each year, but it’s not a true expense and is therefore not part of the cash flow model in the Analyzer.
For rental properties, the IRS calls for a “straight-line depreciation” over 27.5 years, and dictates that only the building value can be depreciated (not the land it sits on.) I will assume that 20% of the value of our SRPU is land — that’s a typical ratio — which leaves $80,000 to depreciate over 27.5 years, or $2,909 each year.
The second adjustment we need to make is to ADD principal pay-down. While the interest portion of mortgage payments are deductible, the portion used to pay down the loan principal is not. That principal portion DOES count against the cash flow calculated in the Analyzer, however — so to arrive at taxable income, we have to add it back in.
After making those adjustments, I’ll assume a 25% tax rate on the taxable income. This rate would depend on how much other income you earn in a given year, and could be higher or lower depending on your tax bracket — but 25% is a reasonable average to use.
Here’s what those adjustments look like over the first several years, just to give you an idea – again, taxable income is the cash flow, MINUS the depreciation, PLUS the principal pay-down, and then taxes owed are 25% of that amount:

At this point, we’ve now calculated the “true” annual cash flow after income taxes are paid. That is the amount we will assume is reinvested each year. Here’s how the value of that “cash on hand” increases if we reinvest in stocks, assuming the same 9.5% total annual returns that we used earlier in the stocks calculation:

As you can see, that cash flow is now being put to good use! Instead of having $12,314 after five years, we have $14,761. What happens if we keep going, and continue to invest the after-tax cash flow of this rental property into that same stock fund over the full 40 years? Take a look:
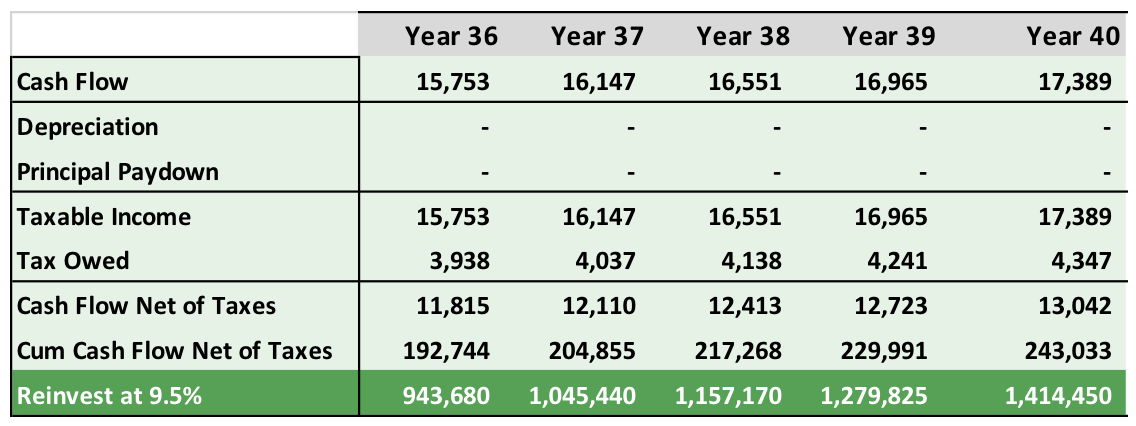
WOWZA! At the end of 40 years, you’d have over $1.4M invested in that stock fund, or ~$350K more than you’d have investing in stocks alone. (You’d also have a fully paid-off property worth $268K – but we’ll get to that side of the equation in Step 4.)
Clearly, reinvesting the cash flow is much better than stuffing it under your mattress. (Duh.) But if rental properties are so good, why wouldn’t we use the cash flow to buy ANOTHER rental property – wouldn’t that increase our returns even more?
Let’s find out. I will make the following assumptions in modeling this “2-property” scenario:
The second rental property (“P2”) will be just like the first one. In other words, we’ll just buy another SRPU. While it’s true that home prices may have appreciated by the time P2 is purchased, it’s really the RATE of return that matters most here — so for the sake of simplicity we’ll use the exact same set of numbers for P2.
P2 will be purchased as soon as possible. We will reinvest P1’s cash flow into a stock fund until we have accumulated $28,000, at which point we will use that cash to buy P2. The math shows this will happen early in Year 8 of our simulation.
Then, keep reinvesting in stocks. From that point forward, we will continue to invest the after-tax cash flow of BOTH properties into stocks.
When those assumptions are run through the scenario combobulator, it kicks out these numbers:

By purchasing a second rental property, we would exit the 40-year period with nearly $1.6M in our investment account! (Not to mention TWO fully paid off properties.) Which begs the question…
You: “So, um…Eric, I hate to ask this, but…what if I bought a THIRD rental property? Would that make my total returns even BETTER?”
Me: “Stands to reason that it would. I’ll run the math on that scenario too – but this is the last one! If we keep going like this, we’ll never get to the end of the post. OK?”
You: “Yeah yeah, get on with it.”
Once again, I’ll make the same assumptions: that P3 is just like the previous properties; that the cash flow from P1 and P2 is invested in stocks until we’ve accumulated another $28,000 (which will be in Year 12, as it turns out); and that after P3 is purchased, the cash flow from all three properties will be reinvested in stocks thereafter.
Go go gadget combobulator!

Once again, we’ve increased our returns: after 40 years, you would have close to $1.7M invested, plus three (nearly) fully paid off properties.
But we’re not quite finished calculating rental property returns yet. In Step 4, we’ll look at the value of the houses themselves.
STEP 4: Adjust Equity for Closing Costs and Taxes
In the scenarios above, I mentioned that you’d have one (or two, or three) fully paid off properties at the end of the 40-year period. We have already calculated the future value of those properties – we did that earlier in Step 2. But in order to access that home equity, you have to sell the home, which means you’ll have to pay closing costs and taxes.
Reminder: we did NOT account for the tax costs of stock investing – income taxes on dividends, and capital gains when the positions are sold – because these costs are present in BOTH the stock and rental scenarios. However, because the costs of selling a home are unique to the rental scenarios, it’s necessary to subtract these in order to make a fair comparison to stock returns.
Closing Costs: I will assume that 8% of the value of the properties will be eaten up by broker fees and other closing costs. The broker fee is usually 6%, and there are some other costs & fees – so I believe 8% to be a fair estimate.
Taxes: In addition to closing costs, there will be tax implications of the sale. You would owe two types of taxes: depreciation recapture tax and capital gains tax.
Depreciation recapture is tax charged on the cumulative amount of depreciation you have claimed in previous tax years. This is like the IRS saying: “Hey, you tricked us! You said the house was depreciating in value, but then you sold if for more than you bought it for. That proves that it wasn’t depreciating after all! I guess we’ll have to take back all those deductions you claimed over the years.” Recall that after 27.5 years, the house is fully depreciated, so depreciation recapture on the SRPU would apply to the full $80,000 of depreciable value we started with. The tax rate on depreciation recapture is capped at 25%, so that’s what I’ll use in my calculations.
Capital gains tax would apply to the portion of the sale price that was a “gain” over the original price you paid. For our SRPU, that’s anything over $100K, and I’ll use the 15% capital gains tax rate (which is the current rate unless your annual income is greater than $450K in a year.)
Let’s see how all of Step 4 works using the first SRPU. After 40 years, the mortgage is fully paid off and the property is worth about $268K. But you won’t walk away with $268K if you sell it:

As you can see, those costs take a pretty big bite out of your home equity. But given how much the cash flow has earned you over those years, this equity is just icing on the cake. Remember that in the 1-property scenario, you would have $1.4M invested in your stock fund at the end of 40 years by reinvesting the property’s cash flow; this additional $201,750 means that, in total, you’ve turned $28K into over $1.6M, as compared to only $1M had you invested that same original $28K in stocks.
The Final Comparisons
Phew! To recap: we’ve done all the math, reviewed all the assumptions, and modeled four different ways to deploy an initial investment of $28K:
Stocks
1 Rental Property
2 Rental Properties
3 Rental Properties
What’s the final verdict, then? Here are the final questions we need to answer now that all the numbers are tabulated:
What is the final value of the investment in each scenario?
How do the scenarios compare at different points in time – i.e. 3 years out, 5 years out, 10 years out, etc.?
What if we change some of our underlying assumptions? Would that dramatically change the results, and undercut the conclusion?
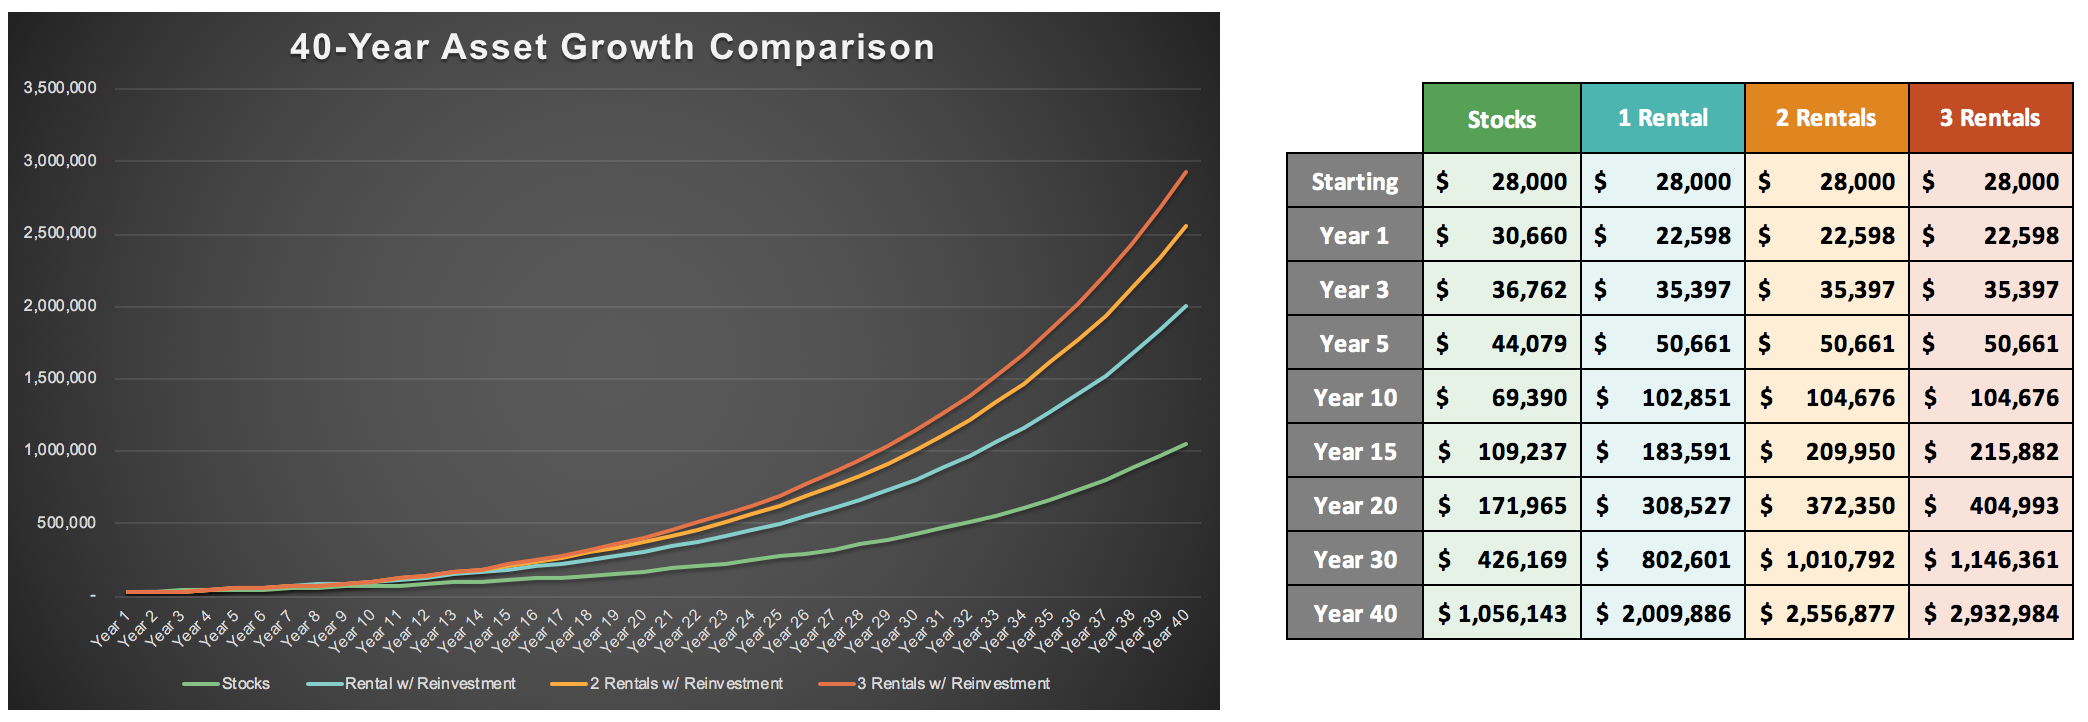
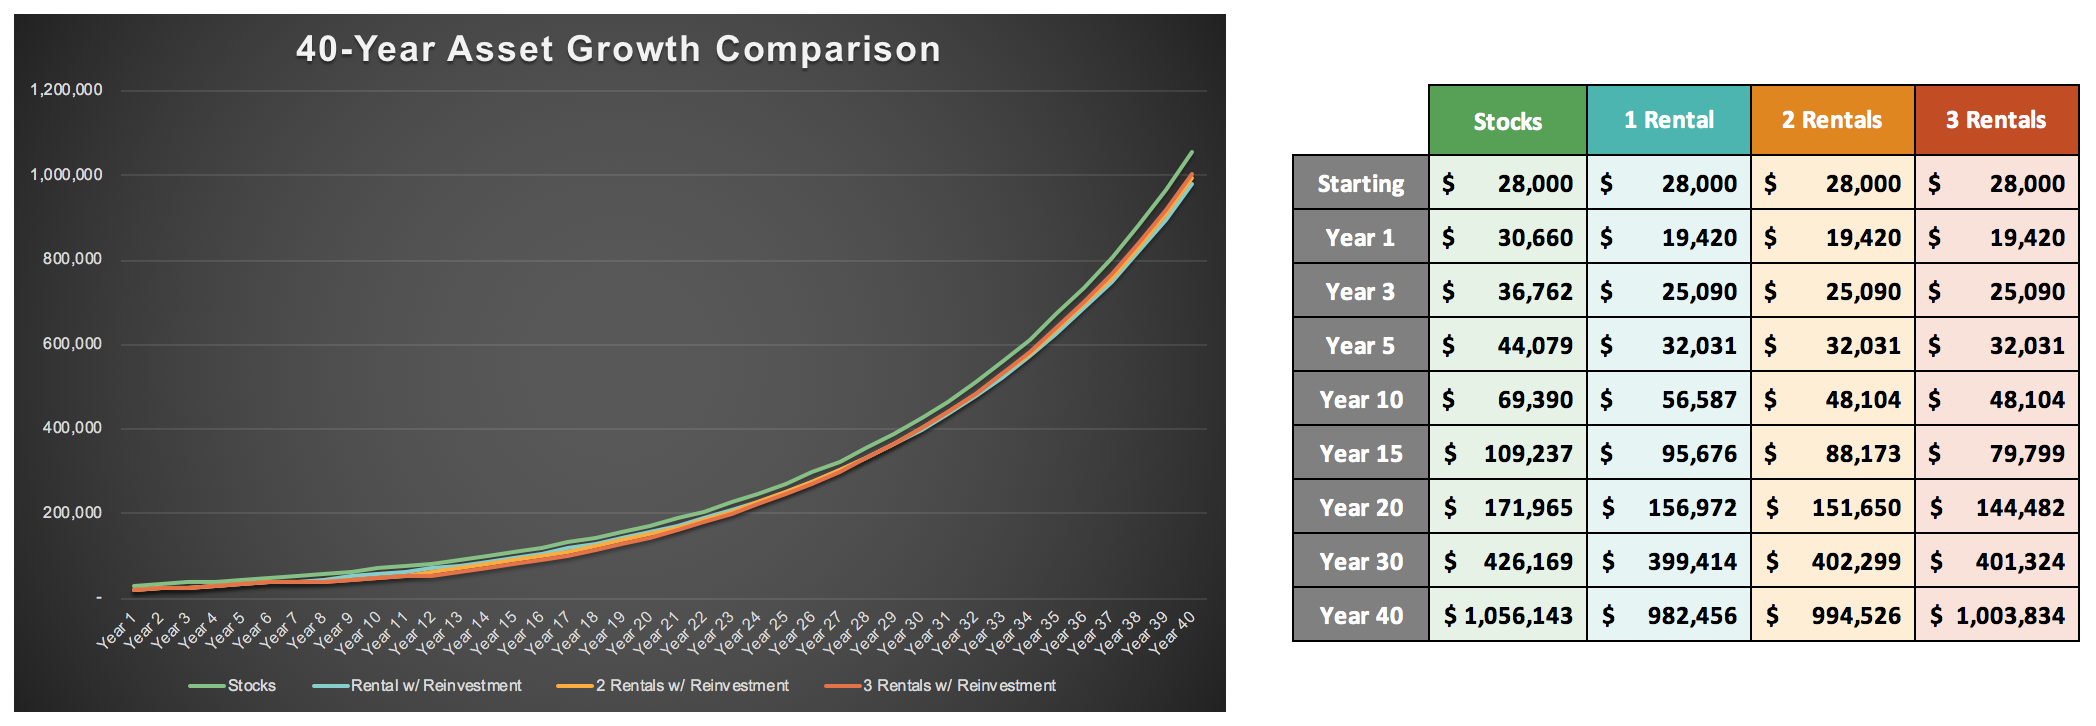
Using all the numbers and assumptions I’ve outlined above for each scenario, here are the final results. Remember, these numbers represent after-tax “walk away with” money after the rental properties are sold, plus the final value of stock investments (not adjusted for income or capital gains tax in any scenario):

The conclusion is clear: over the long-term, rental properties beat stocks. By a lot.
But what about shorter timeframes? After 1 year, stocks are well ahead of rentals, because the closing costs eat up all the profits in the rental scenario (and then some – you’re left with less than $22K of your original $28K investment.) For this reason, buying a rental property and selling it a year later is clearly a losing proposition.
Even after 3 years, though, stocks are still ahead of rentals, and after 5 years, they’re about even. Does this mean that if your investment time horizon is less than 5 years, you’re better off in stocks?
This depends on your risk tolerance. Remember that we’re assuming a steady annual increase of 9.5% in our stock modeling. That’s not real life, of course – in some years, stocks go up 20%, in other years they go down 15%. Your actual returns over any given 5-year period in the stock market will be somewhat volatile. You could end up with much more than the $44K indicated here, or you could end up with less than you started with.
However, your 5-year returns in the rental scenario will be much less subject to this volatility. Home prices do not fluctuate as quickly as the stock market, and regardless of what home prices do, most of your rental returns in the first 5 years are in the form of cash flow anyway. This means that your range of possible results with a rental property will be in a much narrower band surrounding the $45K projected in this scenario.
Once you get to Year 10 and beyond, however, there’s no contest – rental properties start to pull ahead significantly, especially if you buy several.
What if the Underlying Assumptions Change?
But WHY are rental properties better? What’s driving their advantage? Asked a different way: what would have to change in our assumptions to erode their advantage over stocks?
Now that we’ve built this combobulator, it’s very easy to adjust a few levers and see how it impacts our final numbers. Let’s run a few “what if” scenarios and see if rental properties maintain their lead using different assumptions.
WHAT IF: future stock returns are lower or higher than the historical averages suggest? Here’s what our numbers look like if inflation-adjusted stock returns average only 3% instead of 7%:
Reduce Stock Returns to 3%

Here, the advantage of rental properties is even MORE significant. What if we turn the knob the other way, and assume stocks will appreciate 10% per year in inflation-adjusted terms?
Increase Stock Returns to 10%

Here, stocks have pulled even with the 1-Rental scenario, and is only slightly behind the other scenarios. Therefore, we can see that as we turn UP the stock returns, the advantage of rental properties is eroded. Keep in mind, though: it is VERY unlikely for stocks to return nearly 50% more than their historical averages (10% vs. 7%) over any 20-year period, never mind a 40-year period. The chances of this happening over a 40-year period are functionally zero, and therefore don’t threaten our conclusion that rental properties are the better investment.
WHAT IF: inflation is lower or higher than the historical average? In our simulations, inflation is built into both stock appreciation and the rental numbers (because we tie home price appreciation, rent increases, and expense increases to the inflation rate). What if inflation dropped to 0%?
Reduce Inflation to 0%

Rentals still hold an advantage, though a proportionally smaller one. And what if inflation increased to an average of 8% per year over the entire 40-year period? (This is extraordinarily unlikely, but what if it did?)
Increase Inflation to 8%

Higher inflation juices rental property returns even more when compared to stocks. (When people say that rentals are a “good hedge against inflation”, this is what they’re talking about.)
WHAT IF: home price appreciation stalled, and lagged behind inflation? (This can’t really happen over the long-term, or homes would get cheaper and cheaper in real teams, which would cause demand to increase, which would drive up prices.) But just for fun, what would happen if home prices didn’t appreciate at all, while inflation continued at 2.5%, taking both rent prices and home expenses up with it?
Reduce Home Price Appreciation to 0%

That doesn’t make much difference at all, because as we’ve already seen, home equity is just the icing on the cake in the rental scenarios. Most of the value comes from the cash flow, and the ability to re-invest that cash flow.
WHAT IF: rent increases lagged inflation? (Similarly, this can’t really happen over the long-term either: rent would get increasingly affordable relative to home-buying, which would increase demand, which would increase rents.) But let’s run the scenario anyway – what happens to our numbers if rent increased only 1% per year on average, while inflation went along at 2.5% per year, dragging home expenses higher with it?
Reduce Rent Growth to 1%

Well, that clearly made a difference — stocks now fall in the middle of the rental property scenarios. But again: for rent growth to consistently lag behind inflation for 40 years running is not a plausible scenario. And even if it DID happen, rentals would be just as good an investment as stocks.
So far, it looks like changing any of our multi-year modeling assumptions doesn’t change the conclusion. Whatever (reasonable) assumptions we make about the rate of inflation, the rate of stock returns, or the rate of home price appreciation, rental properties are a better investment.
But what about that SRPU we started with? We could go back to our SRPU numbers and tweak those as well. For example…
WHAT IF: our SRPU rented for only $900, instead of $1000? This lowers our initial cap rate from 6.64% to 5.59%, and cash-on-cash returns from 8.82% to 5.08%. This change will apply to ALL the rental properties in our scenarios (including the second and third ones, where applicable.)
Lower Starting Rent to $900

That made a huge difference! Just $100 a month in starting rental value brings stocks much closer to the rental scenarios, though rentals still hold a meaningful advantage. If we turn the knob the other way, and increase starting rent to $1,100, cap rate increases to 7.69% and cash-on-cash jumps to 12.57%.
Raise Starting Rent to $1100
Now, rentals are absolutely CRUSHING stocks. This reinforces something I teach my coaching clients all the time: the single most important metric to stay focused on is cash-on-cash returns. This is the driver behind the huge swings we observe in our model when initial rents are lowered or raised by small amounts. The difference between 5% and 12% cash-on-cash returns is enormous.
WHAT IF: maintenance & capex is more expensive than my model suggests? Let’s increase the Year 1 assumptions for these costs by 50%, from a total of $2,000 per year to $3,000 per year. (That is a LOT, but let’s see what happens — and again, this change will apply to all the rental properties.)
Increase Maintenance & Capex Expenses by 50%

This cuts into the rental scenarios’ lead, but it’s still significant. And that rate of maintenance expenses is already MUCH higher than what I actually experience in my portfolio.
WHAT IF: vacancy was higher than expected? Again, my portfolio runs at about 3% vacancy now, so I think the 5% estimate we previously used is already conservative. But what if vacancy shot up to 10%?
Raise Vacancy Rate to 10%

Even a 10% vacancy rate isn’t enough to move the needle very much.
WHAT IF: the interest rate on my loan was higher than the 3.75% I used in the model? Interest rates are at historic lows, but they may go up in the future. If my loan interest rate was 6%, or 8%, would rentals still be the better investment?
Raise Mortgage Interest Rate to 6%

That made a significant difference, though the rental scenarios are still clearly ahead. But…
Raise Mortgage Interest Rate to 8%
We finally found a lever that changes the game. For nearly a decade, we all got used to historically low interest rates — but now they’ve come off those lows. It’s worth remembering that throughout all of the 1990’s, rates fluctuated between 8% and 10% — and prior to that, they were even HIGHER. I’ve written about how these higher mortgage rates pose a challenge to investors, but unless they climb significantly above 8%, rentals will still be about as good as stocks.
And rentals have a trump card: if mortgage rates ever fall again in the future, you can always re-finance your loans at those lower rates, which would have an immediate and significant impact on your returns, and leave stock returns (once again) in the rear view mirror.
Conclusion
If you made it this far, I offer you a hearty congratulations — even the combobulator is tired! But I believe the conclusions of this analysis are powerful, and important for investors to understand.
Here are the key takeaways:
Assuming you can get properties that perform at least as well as the rental property example (SRPU) I use in this article, then rental properties offer significantly greater long-term returns than the stock market.
The two main factors that drive this advantage are 1) the power of cash flow when compounded through reinvestment, and 2) the availability of low-cost mortgages.
Did I miss anything? Do you have a critique of my approach? A different way of thinking about stocks vs. rentals? Leave me your thoughts in the comments!
About the Author
Hi, I’m Eric! I used cash-flowing rental properties to leave my corporate career at age 39. I started Rental Income Advisors in 2020 to help other people achieve their own goals through real estate investing.
My blog focuses on learning & education for new investors, and I make numerous tools & resources available for free, including my industry-leading Rental Property Analyzer.
I also now serve as a coach to dozens of private clients starting their own journeys investing in rental properties, and have helped my clients buy millions of dollars (and counting) in real estate. To chat with me about coaching, schedule a free initial consultation.