Making the Grade: How to Analyze Rental Property Neighborhoods
Last updated: 2025
I was always good in school. But as a rental property investor, I’m strictly a B/C student. By that I mean that I buy all my properties in B and C neighborhoods.
While there are various schemes used by investors as shorthand to describe neighborhoods, the most common is to group neighborhoods into four types, A through D, where A is the best neighborhood and D is the worst. Pretty simple.
All rental markets have these different types of neighborhoods, whether they are high-priced big cities like New York City, or more affordable towns like Dayton, OH. (Not sure how to choose a market? Read this.) An A neighborhood in these two places would of course look very different, but the basic dynamics are the same: A neighborhoods are nicer places to live, and therefore have higher home prices and more affluent residents.
In this post, we’ll explore the four types of neighborhoods, and consider where rental property investors should focus, depending on their goals and risk tolerance.
But first, a couple of quick caveats:
There is no governing body that regulates these letter grades, and they don’t appear on any official map. So there is some subjectivity with this – but broadly speaking, investors agree on the important characteristics of A, B, C, and D neighborhoods.
Some investors will use the same 4-letter scheme to describe properties, separate from neighborhoods, allowing for things like “a C property in a B neighborhood”. I’m going to ignore the property rating scheme for the purposes of this post, and focus only on neighborhoods. Though there are always exceptions, properties tend to fit in with their neighborhoods – there are really no A properties in D neighborhoods, for example.
The Four Types of Rental Property Neighborhoods
So what does each neighborhood type look like? And how do you determine whether a given neighborhood is A, B, C, or D?
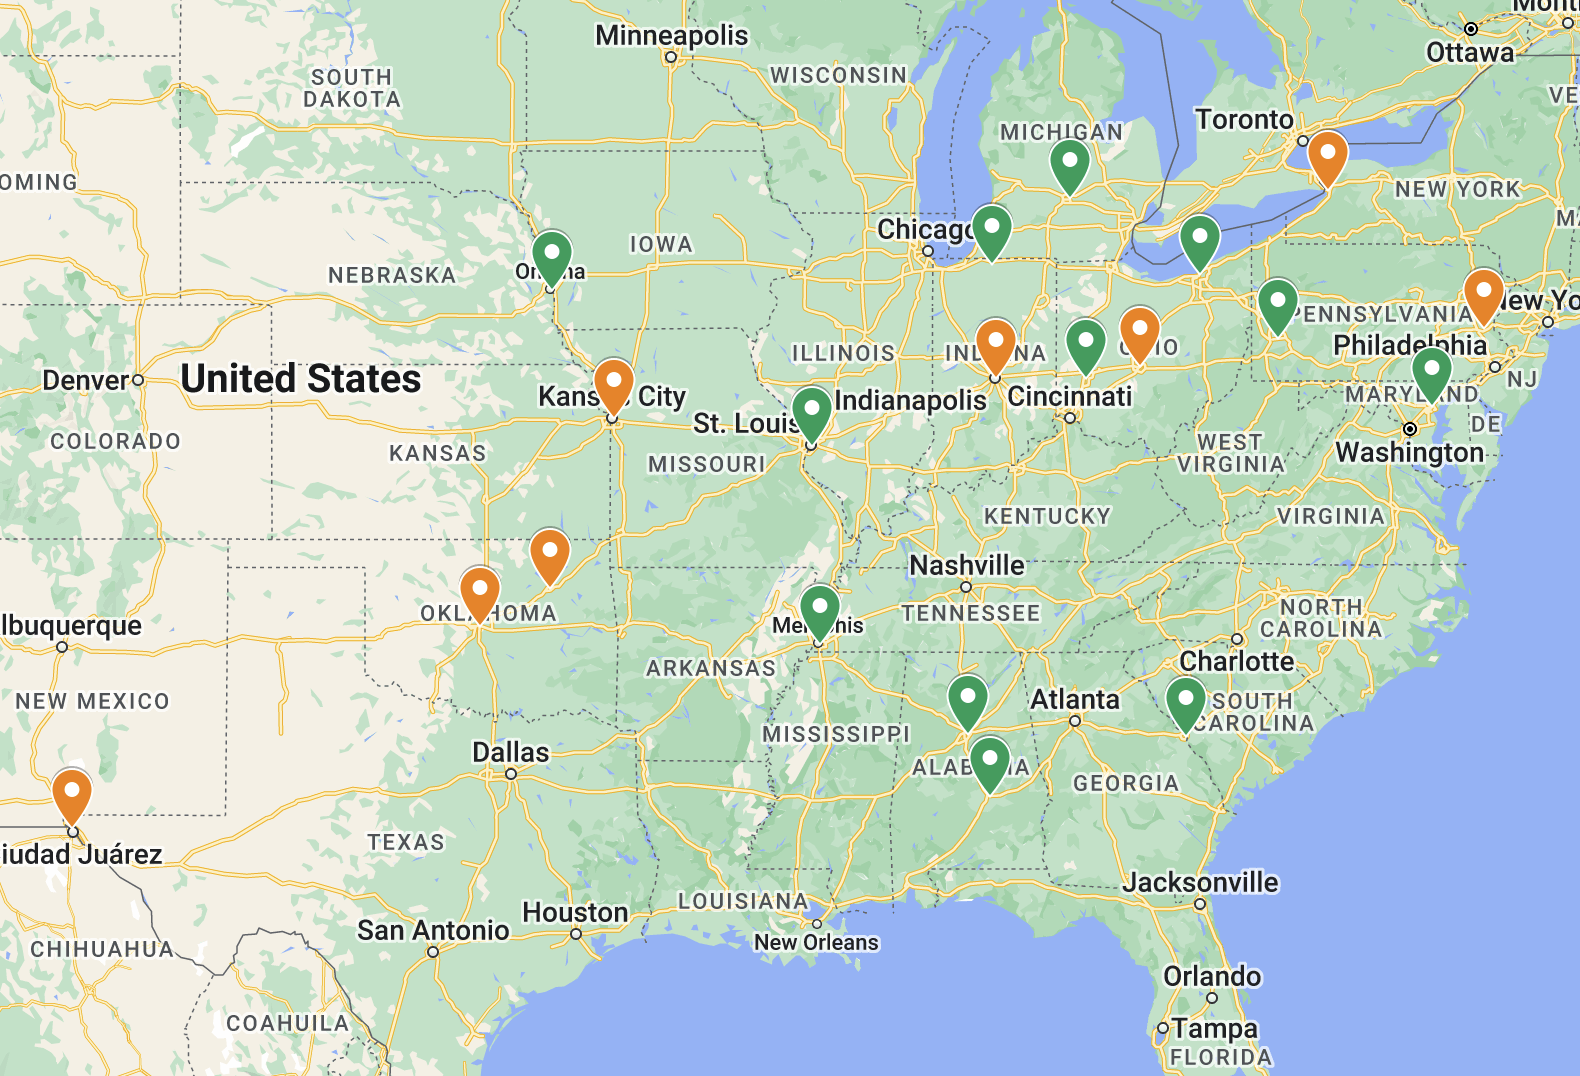
Some people will offer advice like: “use Google Maps to find the Starbucks and Panera Bread locations, and those are A neighborhoods.” Others will show you pictures of homes to illustrate the neighborhoods. Still others will tell you it’s all about the local schools. While these approaches may be directionally accurate, I prefer a more data-driven approach.
Wouldn’t it be better if you could simply know some basic data about a neighborhood, and use that data to figure out what type it is? Ideally, you’d want to know things like:
Median home value
Median Rent
Median Year homes were built
Percent of residents who rent vs. own
Median Income
Poverty Rate
Percent HS and College Grads
Remarkably, all of this data is publicly available, by city, neighborhood, and even zip code. One site with tons of this data is City-Data.com — here, you can view nearly any metric by census tract on a heat map, which is a great way to visualize different neighborhoods within a city.
Just for fun, let’s look at some data in my primary investment market, Memphis TN. I pulled the data for Memphis as a whole, and then two zip codes that are representative of the best and worst neighborhoods in the area – in other words, an A and a D neighborhood:

*Note: these figures are from the time original publication in 2020
This makes clear the types of data you’re likely to see in an A neighborhood:
Higher home prices and rents
Newer homes (sometimes)
Residents who are predominantly homeowners (rather than renters), and who have higher incomes, lower poverty rates, and higher educational attainment
By comparing any neighborhood or zip code to the larger metro area of which it is part, it is pretty easy to tell at a glance whether it is an A, B, C, or D neighborhood. Of all these metrics, the easiest and most reliable one to use is median home price, and you can use the following rule of thumb:
A Neighborhood: Significantly (50%+) above metro-area median
B Neighborhood: Slightly above metro-area median
C Neighborhood: Slightly below metro-area median
D Neighborhood: Significantly below metro-area median
But wait, you say – don’t A neighborhoods also have better schools? Better bars and restaurants? Better roads and/or transportation services? Better access to parks and recreation? Better…everything?
Yes, they do. But residents understand all those considerations when they choose where to live, and it all flows through to these basic numerical data points. One of the reasons A neighborhoods have higher home prices is because they have better schools; but you don’t need to worry about the schools, you really just need to look at the home prices.
One other caveat: not all zip codes are completely homogeneous neighborhoods. For example, in 38127 – my example of a D neighborhood above – about half the zip code is really a C neighborhood. To get to that level of granularity, it’s best to zoom in on Zillow to examine home and rental prices, talk to a local broker or property manager, and/or google to see if you can find resources or maps published by those local experts that break down the sub-neighborhoods within your chosen market.
Now that you know how to identify neighborhoods, how should you decide where to buy your rental properties?
Considerations for Rental Property Investors
There are a number of factors to consider when deciding what type of neighborhood you’d like to invest in. But it boils down to a risk versus reward calculation: an A neighborhood offers the lowest financial rewards and the least risk; every step you take into less desirable neighborhoods increases both your potential ROI and your risk.
First, let’s take a look at the rewards. I plotted my Memphis portfolio -- 16 actual, real-life properties -- to illustrate how Cap Rate and Cash on Cash returns correlate with neighborhood type. (If you’re not clear on what those metrics are, read this first.) While this is based on Memphis, dozens of cash-flow rental markets will have very similar figures.
The results are clear and striking:

Again, keep in mind that the dividing lines between these neighborhood types is much fuzzier than this chart implies. But the overall picture is still accurate, and leads to these two important conclusions:
Cap Rate increases significantly as you move down from A neighborhoods
Cash on Cash increases DRAMATICALLY as you move down from A neighborhoods
Why is the curve for Cash on Cash so much steeper? Because the higher your initial cap rate, the greater the power of leverage to multiply your returns. I call this the “Magic of Mortgages”, which you can read all about here.
So if the returns are so much better, why not just invest exclusively in C (or even D) neighborhoods? Some investors do – but there are risks to consider.
Let’s use this helpful Neighborhood Matrix to examine some of those risks:

Tenants: Tenants who rent in A neighborhoods tend to be higher quality and lower risk. (To be very clear, “higher quality” here means “quality tenant”, NOT “quality person”.)
The primary implication of a riskier tenant is financial — there is an increased chance of late payment, non-payment, eviction due to non-payment, or bankruptcy (which can significantly slow the eviction process, depending on state laws.) While any tenant can fall on hard times, these situations are more likely to impact tenants with limited financial means, and there is good data to support this.
It is also commonly argued that these higher-risk tenants are more likely to be “problem tenants” in other ways, separate from their ability to pay rent. What kinds of problems? Well, they might fail to maintain the property as well; they could make unreasonable demands of your property manager; they could break their lease early; they could sue you and/or your property manager for negligence. All of those could potentially cost you money. However, I have yet to see any compelling data or evidence that proves these problems are more prevalent among lower-income tenants – and I have not found this to be true in my portfolio. In my view, the vast majority of people in ALL neighborhoods are just trying to live their lives the best they can, and I don’t put much stock in arguments that don’t have data and evidence to back them up.
The best way to minimize financial risks with tenants is to have a strong tenant screening process. This becomes especially important if you decide to invest in D and C neighborhoods. Tenant screening is one of the many important things your property manager will be responsible for, which is why using an established, reputable, high-quality property manager is so critical.
Upkeep: Your maintenance costs are likely to be lower in A neighborhoods, for two primary reasons. First, housing stock in D and C neighborhoods tends to be older. (Like all rules, there are exceptions to this.) And older homes generally require more maintenance. In fact, I have closely examined maintenance costs by the age of the home in my portfolio, and the expected patterns bears out.
Second, remember that maintenance costs as a percent of the home’s value is really what’s important, rather than the gross dollars per home. A toilet, HVAC unit, or roof will cost about the same to replace in a $50K home as in a $150K home. But as a percentage, those costs will be much higher for the $50K home, and this is what matters to your ROI.
Resale: Because A/B neighborhoods have a much higher percentage of owner-occupants, selling those homes will generally be easier because you’ll be able to market them to BOTH people looking to buy a primary residence, as well as other investors. In C neighborhoods, and especially D neighborhoods, renters predominate, which means the person who buys your home is probably going to be another investor – and that’s a much smaller pool of potential buyers.
Conclusion
Determining the type of neighborhood(s) you want to invest in is one of the major decisions you’ll make as a rental property investor. This is essentially a calculation of risk versus reward.
So what’s right for YOU? Well, one warning: investing in D neighborhoods is not for novices, and is definitely not what I recommend for most investors. The houses may look incredibly cheap, and the returns impressive on paper, but it’s not for the faint of heart. If you want to go this route, tread carefully, and be sure you’re getting reliable guidance from local experts.
Also, while some investors prefer A neighborhoods because of their low risk profile and potential for appreciation, the cash returns just aren’t that great. So if you’re looking for cash flow, you’ll want to avoid A neighborhoods as well.
That leaves B and C neighborhoods, which I believe offer the best balance of risk and reward for most investors. As you can see from my portfolio, there is a large range of options even within those neighborhoods: a $50K home in a C neighborhood is quite different from a $140K home in a B+ neighborhood. You may also choose to define your goals as a mix of neighborhood types in order to achieve some diversification – for example, 10% A / 60% B / 30% C.
As for me? I currently have 11 houses in B neighborhoods, and 5 in C neighborhoods. My experience so far with C properties gives me confidence that the higher returns in C neighborhoods are worth some additional risk. Therefore, I’m planning to skew my future acquisitions more toward C neighborhoods, in order to get closer to a 50 / 50 mix.
2022 Update: I have indeed focused my recent acquisitions on C neighborhoods, and it has worked out quite nicely. For details, check out Property #17, Property #18, and Property #19, as well as all my other Property Spotlights.
About the Author
Hi, I’m Eric! I used cash-flowing rental properties to leave my corporate career at age 39. I started Rental Income Advisors in 2020 to help other people achieve their own goals through real estate investing.
My blog focuses on learning & education for new investors, and I make numerous tools & resources available for free, including my industry-leading Rental Property Analyzer.
I also now serve as a coach to dozens of private clients starting their own journeys investing in rental properties, and have helped my clients buy millions of dollars (and counting) in real estate. To chat with me about coaching, schedule a free initial consultation.