Monthly Portfolio Report: May 2020
One of my goals with Rental Income Advisors is to be as transparent and data-driven as possible with my clients and my readers. I also think the best way to build confidence in a new investor is to actually show the numbers, to prove that rental property investing really does work as advertised.
For those reasons, I publish a monthly report on my portfolio’s performance. I hope that this chronological history paints a clear picture of what it’s like to be a remote landlord. It’s also a great exercise for me to be sure I’m staying plugged in to all my numbers.
Here is the update for May 2020.
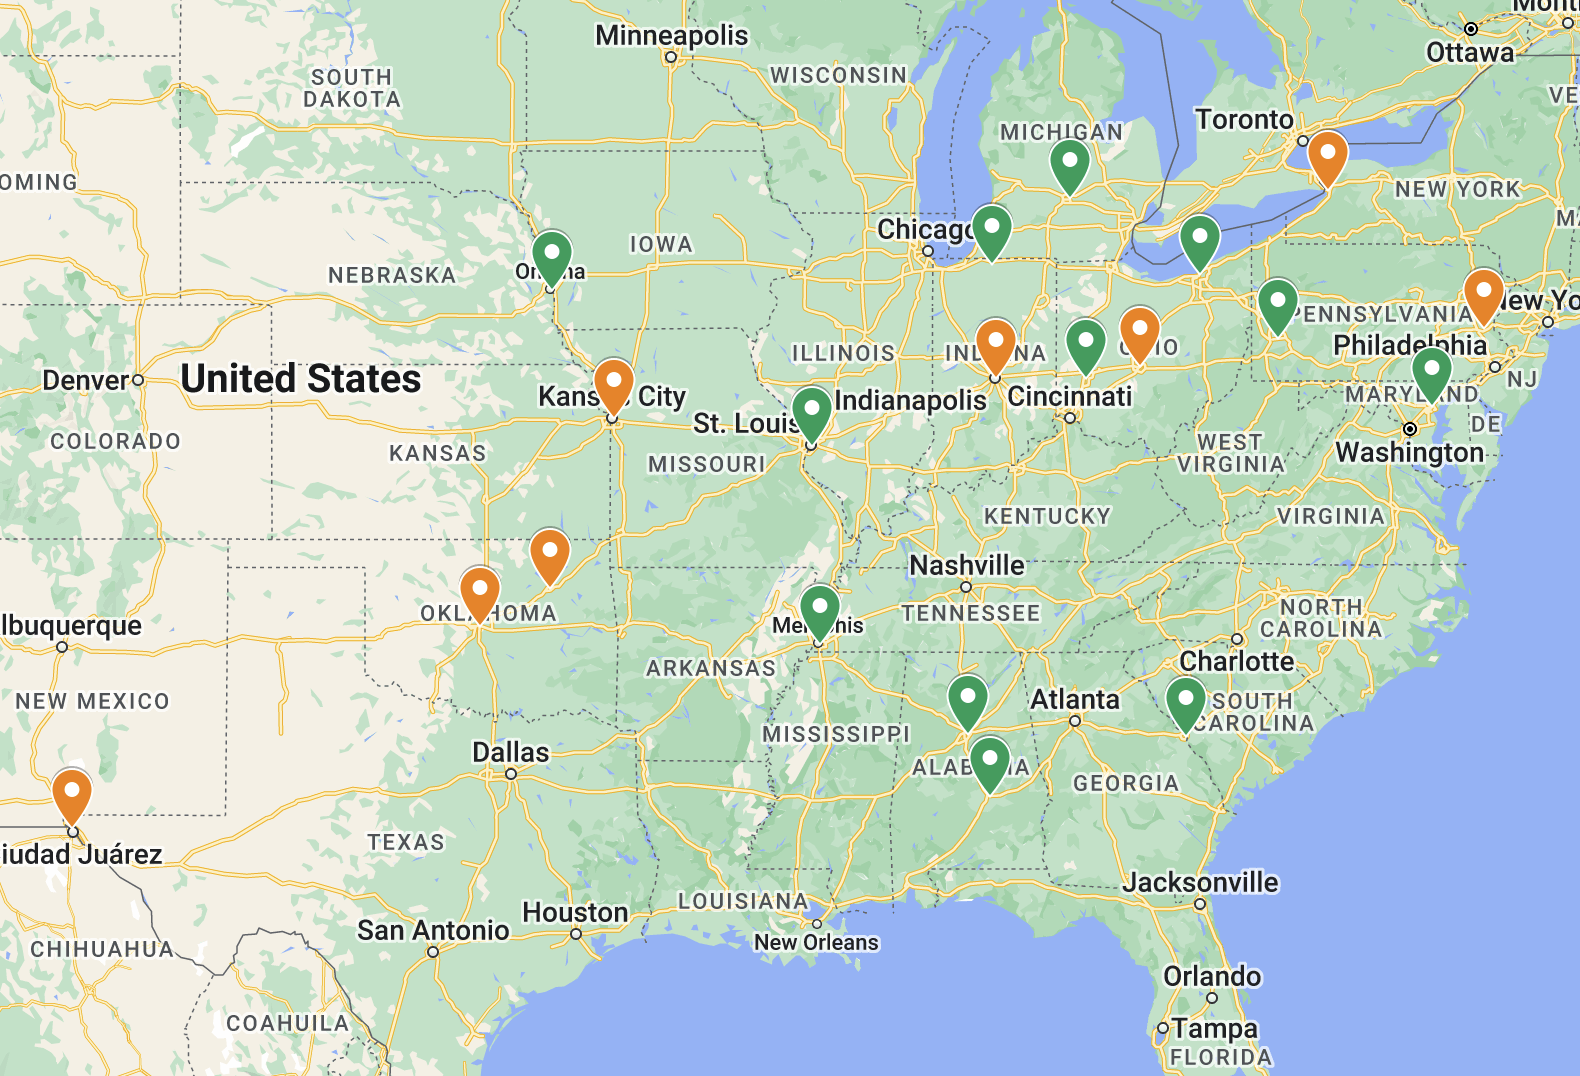
Property Overview

Maintained full occupancy this month. I do have one vacancy for June, as I’m in the middle of a turn there after the tenant vacated at the end of May. I’m hoping to get that re-rented quickly in time for July 1st. Otherwise, 13 out of 16 tenants have already renewed/signed leases this year, so I should be able to maintain very strong occupancy for the rest of 2020.
Rents

Fully collected this month. The small bit of extra rent was the reverse of the issue I noted from last month (a missing partial-month payment from a new tenant). I was hoping this would get squared away in May, and it did.
I’ll again note here that Covid-19 has so far not impacted my tenants’ ability to pay rent. Fingers crossed that this continues to be the case.
Expenses
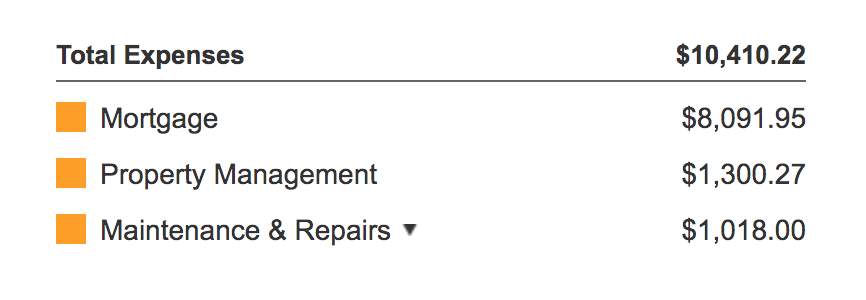
Typical stuff for maintenance this month: an HVAC repair; two electrical issues; a leaky sink; a clogged dryer vent. I was slightly under my monthly allotment of $1,351 for maintenance & repairs.
The Bottom Line

My budget model projects my Memphis portfolio to generate $4,468 per month in positive cash flow, which would yield a 10.17% cash-on-cash return. In May, the positive cash flow was $5,843, almost $1,400 more than expected. So overall, another very good month!
This will be among my best months. But it is not an AVERAGE month, which is why it’s so important to build your financial models based on averages, not best-case scenarios.
For example: June will be less profitable, because I have one property turning over – that means no rent for June, and the expenses of getting the property rent-ready for the next tenant. In this case, that cost will only be ~$800 because this is a brand new house, but a typical turn can easily cost 2-3x that amount.
Finally, here’s the running tally and graph I’ll keep updated each month (not that interesting with only 2 months, but it will get better over time!)

About the Author
Hi, I’m Eric! I used cash-flowing rental properties to leave my corporate career at age 39. I started Rental Income Advisors in 2020 to help other people achieve their own goals through real estate investing.
My blog focuses on learning & education for new investors, and I make numerous tools & resources available for free, including my industry-leading Rental Property Analyzer.
I also now serve as a coach to dozens of private clients starting their own journeys investing in rental properties, and have helped my clients buy millions of dollars (and counting) in real estate. To chat with me about coaching, schedule a free initial consultation.