Monthly Portfolio Report: April 2020
One of my goals with Rental Income Advisors is to be as transparent and data-driven as possible with my clients and my readers. I also think the best way to build confidence in a new investor is to actually show the numbers, to prove that rental property investing really does work as advertised.
For those reasons, I’m going to publish a monthly report on my portfolio’s performance. I hope that this chronological history paints a clear picture of what it’s like to be a remote landlord. It’s also a great exercise for me to be sure I’m staying plugged in to all my numbers.
So here we go – the first monthly portfolio report, for April 2020!
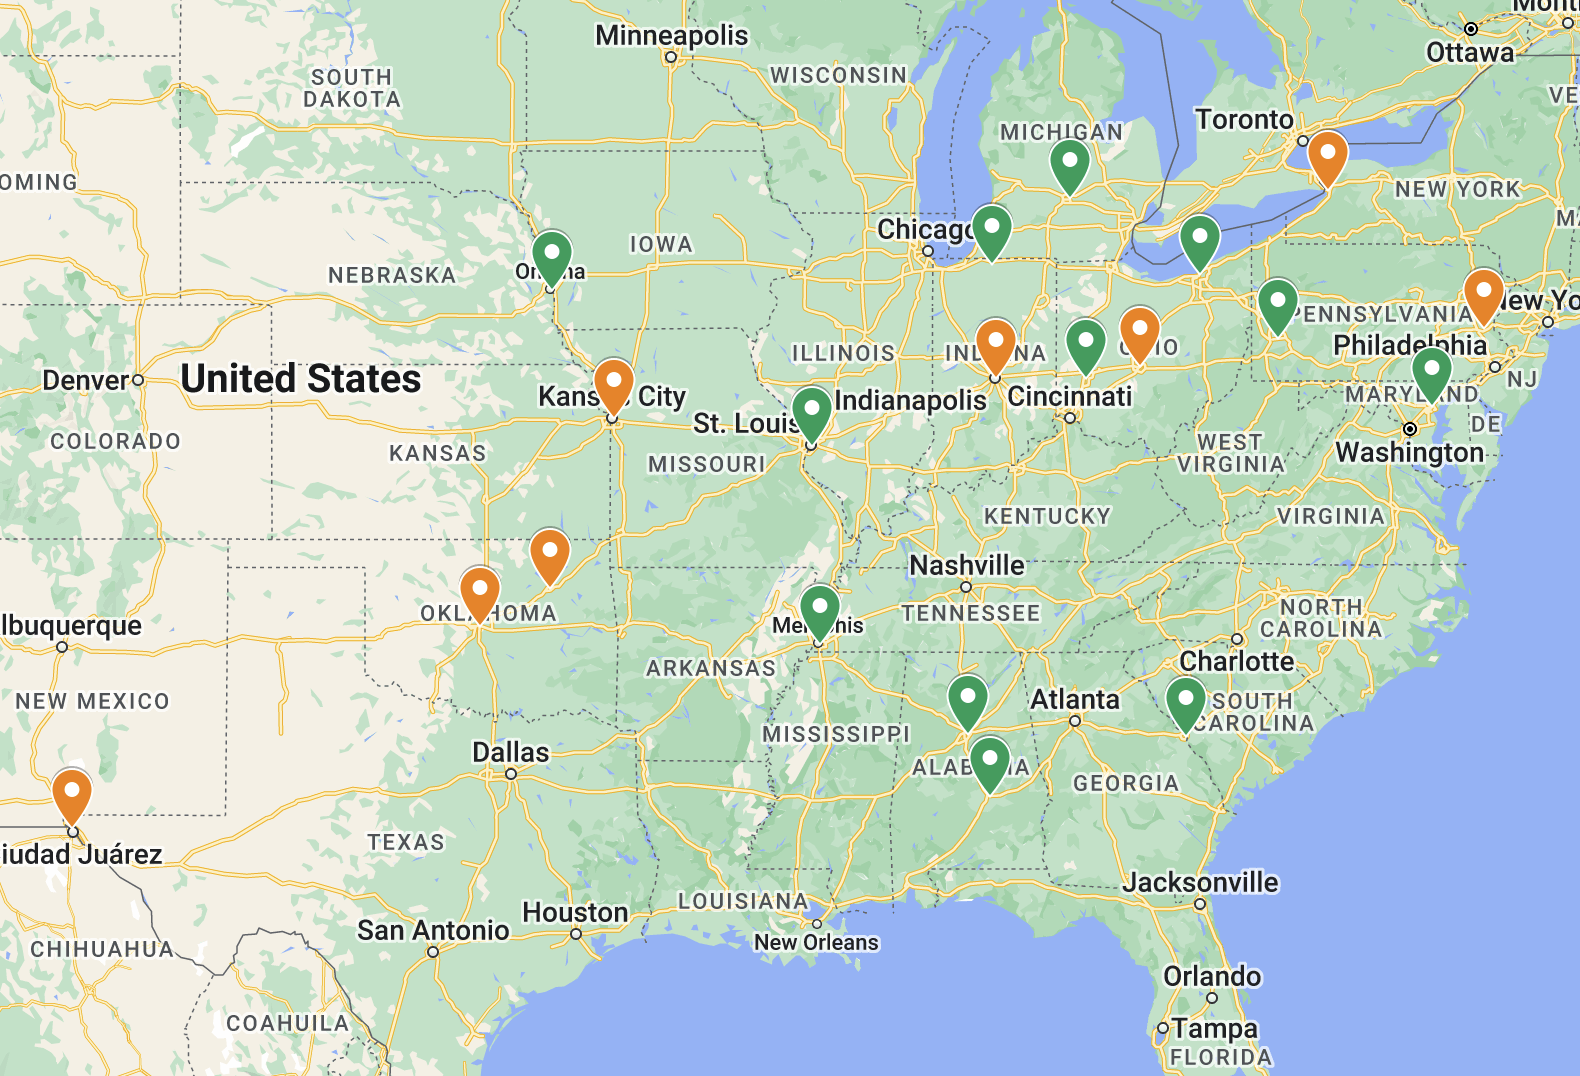
Property Overview

Not much to report here! Being fully occupied is great, of course. I do have one tenant vacating at the end of May, so that will be a guaranteed turn. Otherwise, 12 out of 16 tenants have already renewed/signed leases this year, so I should be able to maintain very strong occupancy for the rest of 2020.
Rents
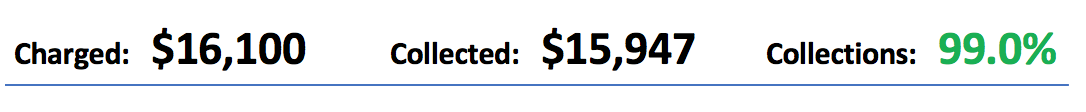
Almost fully collected this month; the small discrepancy was due to a new tenant not realizing they owed a partial month since they moved in a few days before the start of the month. I expect this will get rectified in May.
It’s also notable that Covid-19 has so far not impacted my tenants’ ability to pay rent. Fingers crossed that this continues to be the case.
Expenses

Nothing unusual for maintenance this month: a pest control issue at one house; an electrical issue at another; and a few other minor things. I was slightly under my monthly allotment of $1,351 for maintenance & repairs.
I normally don’t have utility expenses because the tenants are responsible; however, when a property is vacant, I have to pay. This $57 is the last portion I owe from a house that turned over to a new tenant a few months ago.
The Bottom Line

My budget model projects my Memphis portfolio to generate $4,468 per month in positive cash flow, which would yield a 10.17% cash-on-cash return. In April, the positive cash flow was $5,417, almost a thousand dollars more than expected. So overall, a very good month!
However, keep in mind that some expenses – such as taxes and insurance on the 3 properties I own outright, as well as larger maintenance expenses – are not spread evenly across months, so any single month may come in above or below the expected monthly average.
When I get to May’s report, I’ll start a running tally and graph of my monthly cash flow over time, so stay tuned…
About the Author
Hi, I’m Eric! I used cash-flowing rental properties to leave my corporate career at age 39. I started Rental Income Advisors in 2020 to help other people achieve their own goals through real estate investing.
My blog focuses on learning & education for new investors, and I make numerous tools & resources available for free, including my industry-leading Rental Property Analyzer.
I also now serve as a coach to dozens of private clients starting their own journeys investing in rental properties, and have helped my clients buy millions of dollars (and counting) in real estate. To chat with me about coaching, schedule a free initial consultation.