Monthly Portfolio Report: September 2023
One of my goals with Rental Income Advisors is to be as transparent and data-driven as possible with my readers and my coaching clients. I think the best way to build confidence in a new investor is to actually show the numbers, to prove that rental property investing really does work as advertised.
For those reasons, I publish a monthly report on my portfolio’s performance. I hope that this chronological history paints a clear picture of what it’s like to be a remote landlord. It’s also a great exercise for me to be sure I’m staying plugged in to all my numbers.
Here is the update for September 2023. You can also check out all my previous monthly reports and annual reports.
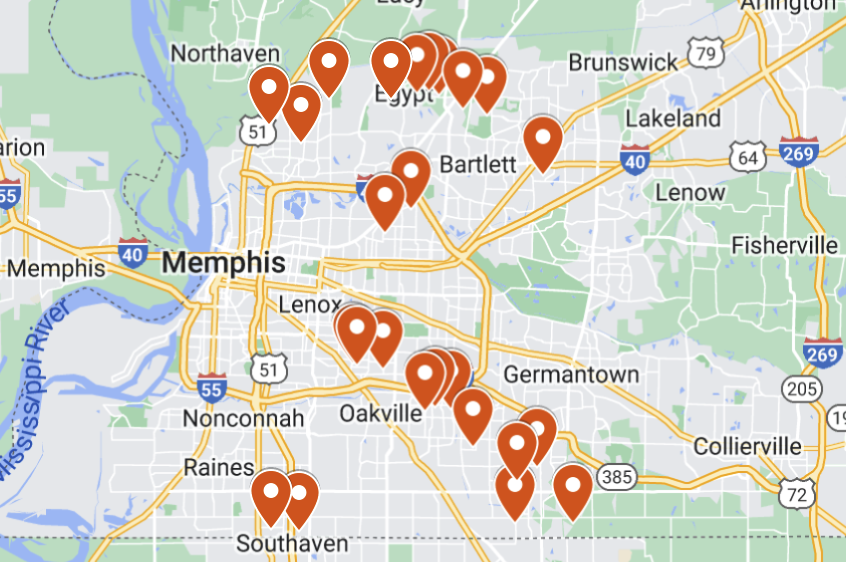
Property Overview

After a very long eviction-bankruptcy, I FINALLY took back possession of Property #20 in September, so it is now officially vacant. I approved the scope of work to get the house ready for its next tenant, at a total cost of ~$4K — those costs are reflected in my September expenses below. The work is nearly done, so all that remains is to get a new tenant placed, which my PM has already been working on for a few weeks.
I also have an ongoing eviction in one unit of my duplex (Property #18), but since that eviction is not finalized, I continue to count it as “occupied, but rent uncollected”. You never know — the tenant may yet be able to get current and avoid eviction.
My tenant at Property #1 renewed for another year with nearly a 10% rent increase, which brings them closer to market rent for their house. I may have an upcoming vacancy at Property #22, where the tenant decided to vacate after I proposed a multi-year plan to increase them closer to market rent (they are paying $850, while market rent is closer to $1200). I still half-expect that they will ultimately decide to renew, since there aren’t really any cheaper options on comparable homes….we shall see.
I also had a few small CapEx items recently, including a new electrical breaker box at Property #9, and a bit of new LVP flooring at Property #2. (I may have more work to do at that property, as there is something causing buckling of the floor throughout the house — still waiting to hear what was found when we went in to replace the most damaged sections.) While these CapEx items aren’t counted as expenses, they’ll be fully incorporated and reviewed in my end of year report.
Rental Income

As mentioned, one of my tenants in my duplex is delinquent on rent, which accounts for the collections shortfall this month.
In last month’s report, I mentioned a high number of late payments in September. Fortunately, those were all collected, and the number of lates returned to normal this month, with all but one tenant fully paid up for October at the time of writing.
Expenses

This screenshot comes from RentalHero, the online accounting tool I use for my portfolio.
Here are the highlights of my expenses this month:
Maintenance & Repairs: Nearly all this cost comes from the turn at Property #20. Thankfully, other maintenance & repair expenses were pretty minimal last month.
Legal Fees: This includes a $350 filing fee for my second eviction at Property #18, and a ~$750 set-out fee for Property #20. (The “set-out” is when my PM sends a team to officially take possession of the property, ensure the tenant has vacated, rekey the locks, etc.)
Tenant Chargeback: I was reimbursed $75 for a previously incurred fee that a tenant was responsible for; when the tenant pays my PM for the charge, I get the refund.
The Bottom Line

My financial model currently projects my Memphis portfolio to generate $8,662 of positive cash flow in an average month. (This has dropped by a few hundred dollars in the last few months, due to one tenant whose rent was reduced by ~$150 in order to convince them to stay, along with some small adjustments to property tax rates on a few properties.) This month, my cash flow was $7,116, about $1500 below my projected average. A combination of the two ongoing evictions, the costs of a turn, and the legal fees caused me to miss my target this month.
Finally, here’s the running tally and graph I update each month. The dotted blue line indicates my projected average monthly cash flow for my portfolio in each given month. I’m now down more than $5K cumulatively against my targets, but remember that my PM offered to accommodate me for some of the losses during the eviction at Property #20 — so when that reimbursement comes through, it should help quite a bit. (Strong relationships with your partners can make a big difference!)


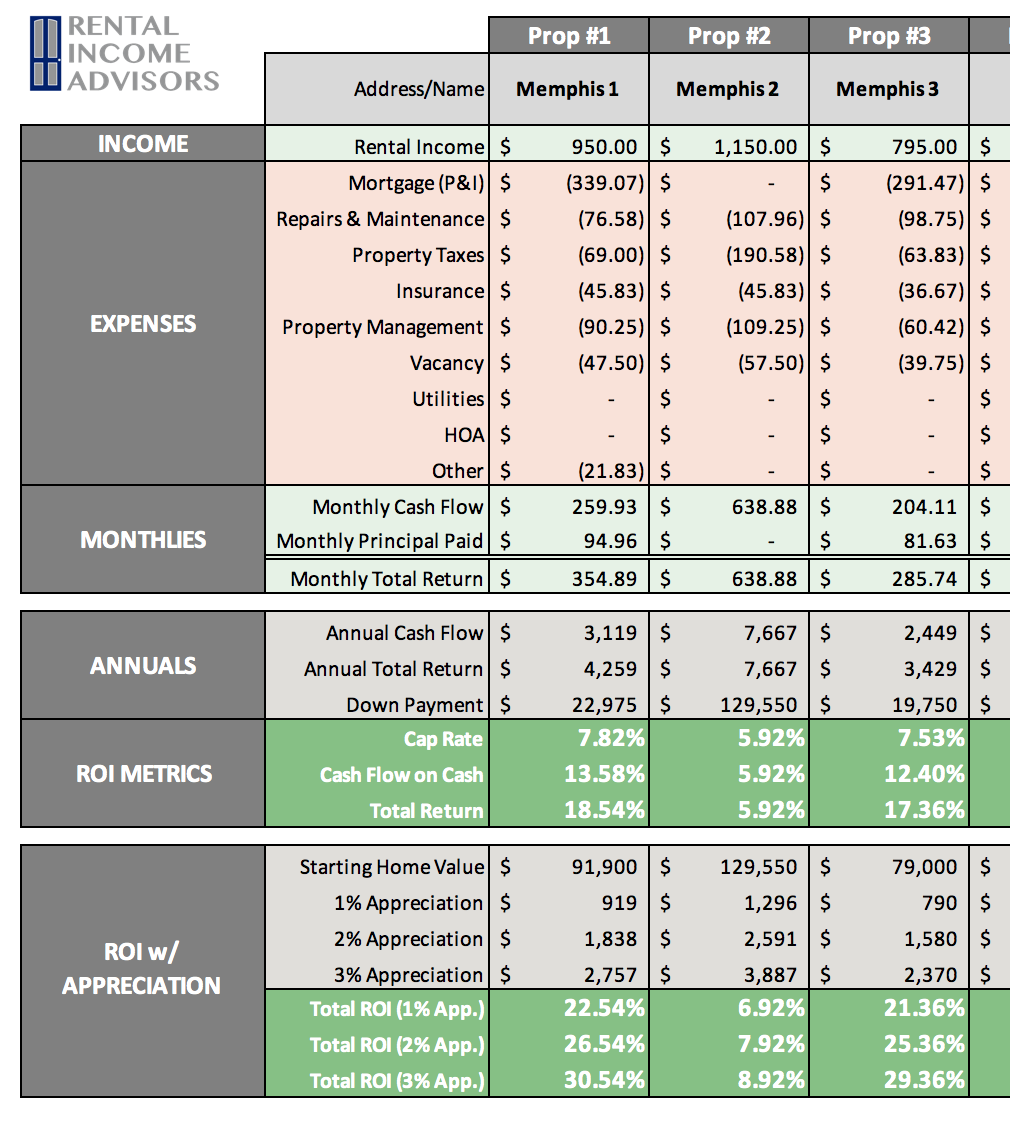
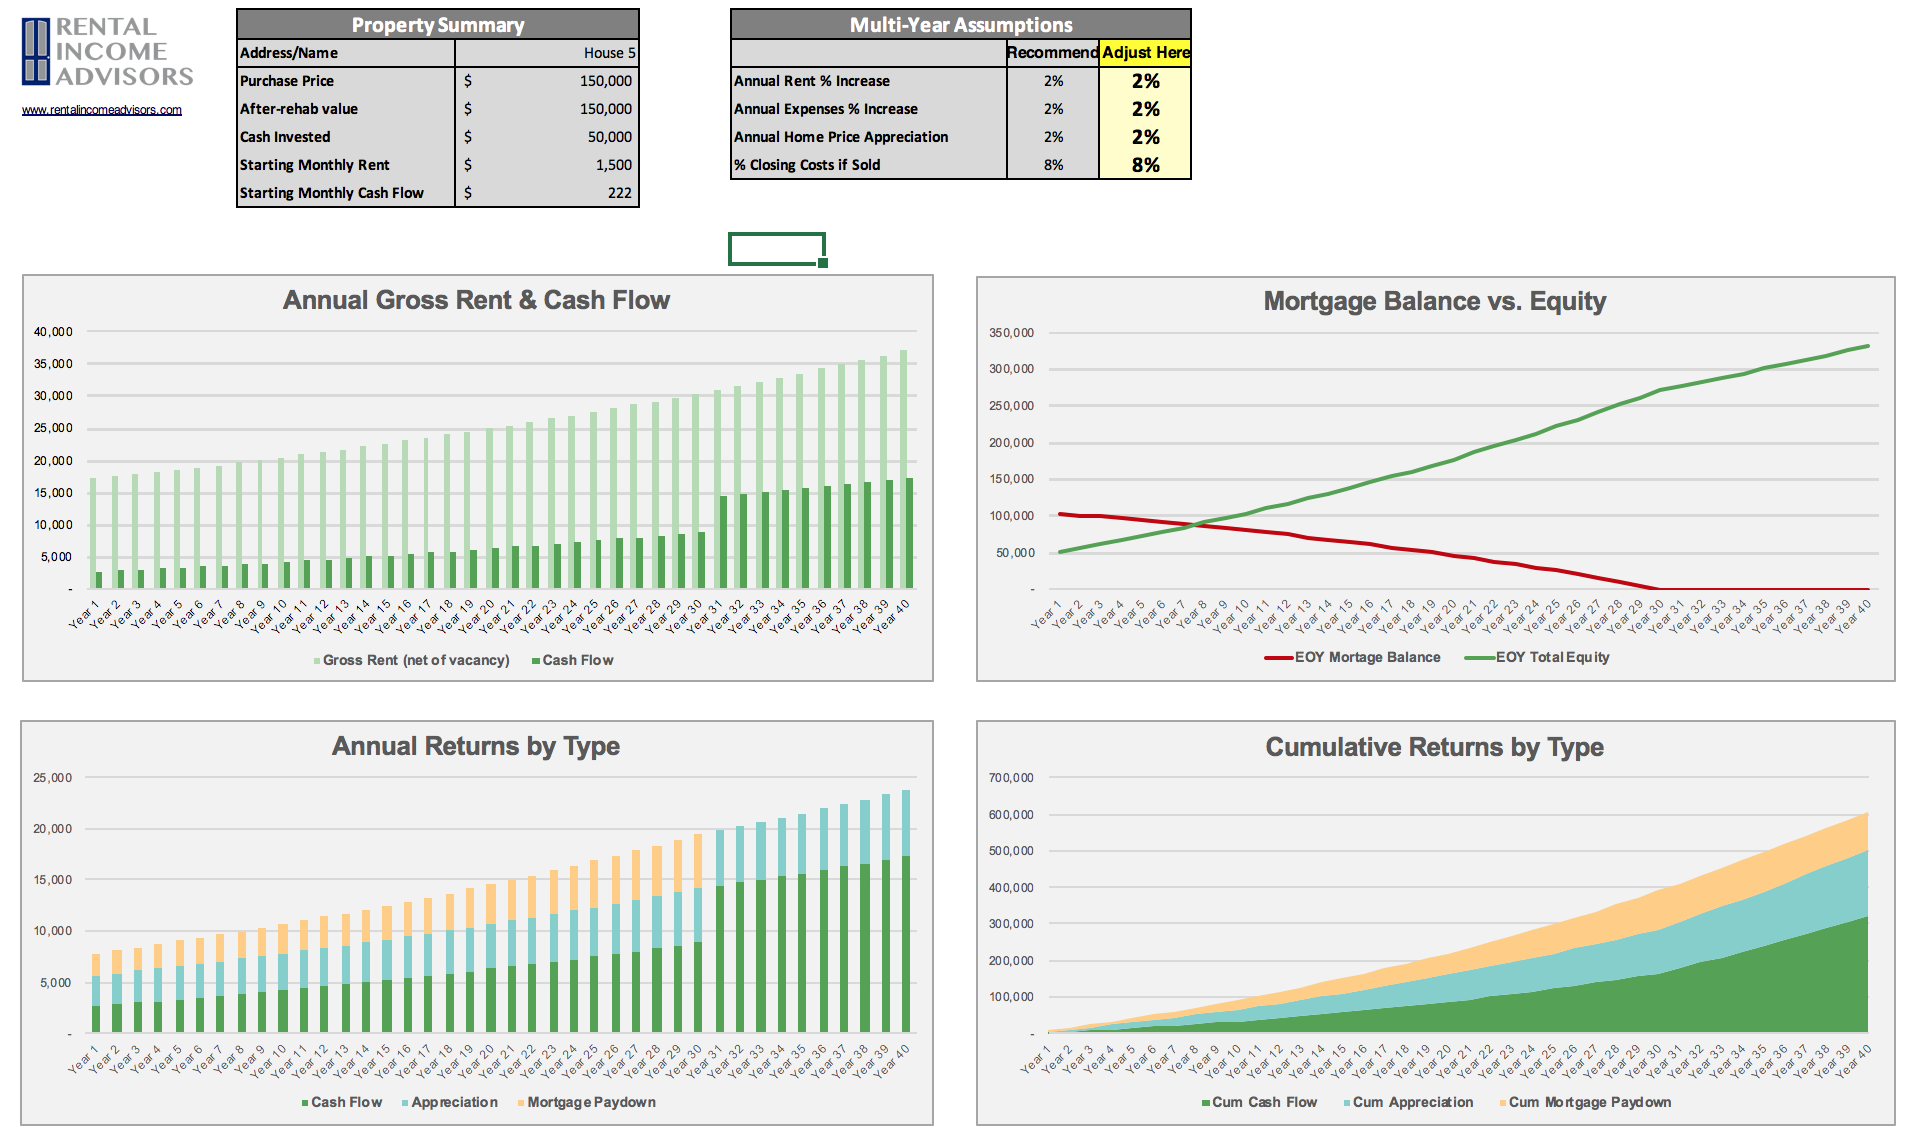
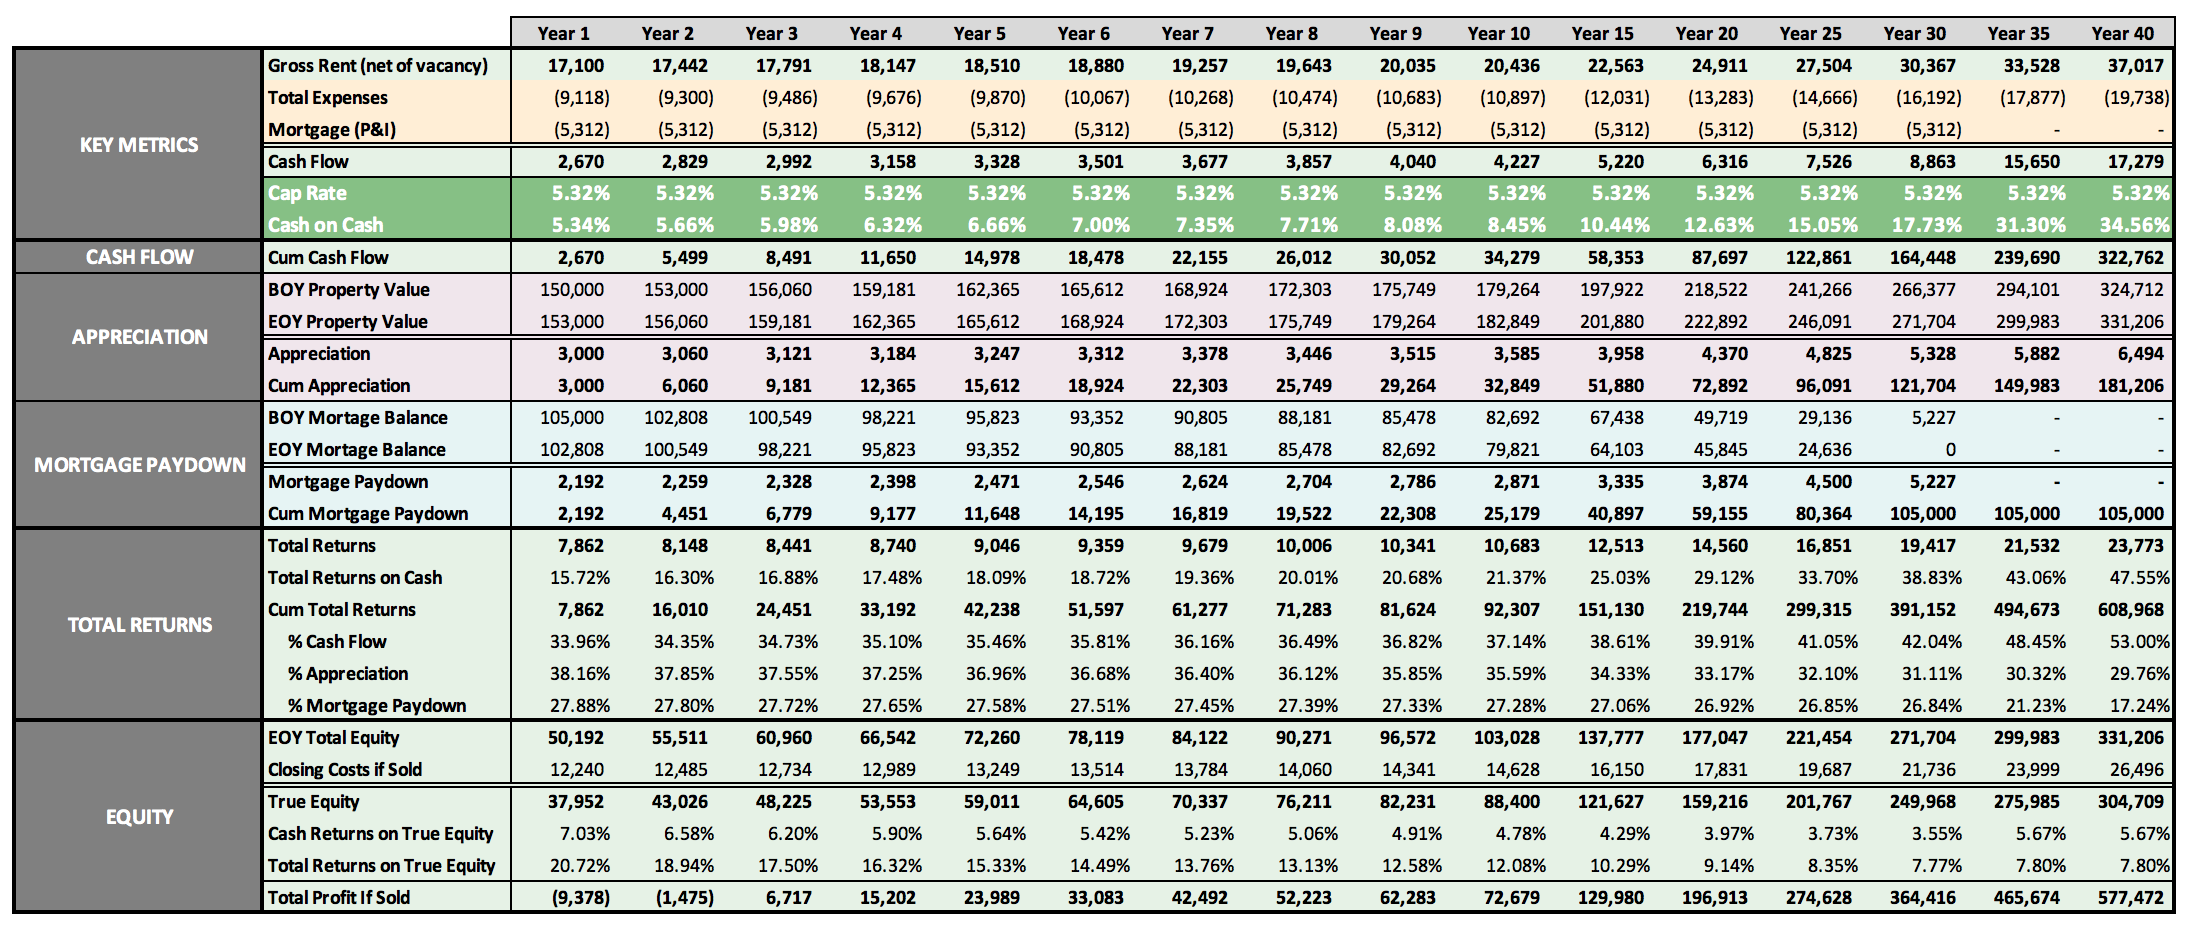
Free Rental Property Analyzer
Need help running the numbers on rental properties? Want to be more confident in your financial projections?
Check out the FREE RIA Property Analyzer. I guarantee this is the most intuitive, elegant, and powerful free tool you’ll find to run the financials on rental properties. I still use it every day, and so do all my coaching clients.
OR
Here’s what the Property Analyzer looks like:
About the Author
Hi, I’m Eric! I used cash-flowing rental properties to leave my corporate career at age 39. I started Rental Income Advisors in 2020 to help other people achieve their own goals through real estate investing.
My blog focuses on learning & education for new investors, and I make numerous tools & resources available for free, including my industry-leading Rental Property Analyzer.
I also now serve as a coach to dozens of private clients starting their own journeys investing in rental properties, and have helped my clients buy millions of dollars (and counting) in real estate. To chat with me about coaching, schedule a free initial consultation.