Monthly Portfolio Report: April 2024
One of my goals with Rental Income Advisors is to be as transparent and data-driven as possible with my readers and my coaching clients. I think the best way to build confidence in a new investor is to actually show the numbers, to prove that rental property investing really does work as advertised.
For those reasons, I publish a monthly report on my portfolio’s performance. I hope that this chronological history paints a clear picture of what it’s like to be a remote landlord. It’s also a great exercise for me to be sure I’m staying plugged in to all my numbers.
Here is the update for April 2024. You can also check out all my previous monthly reports and annual reports.
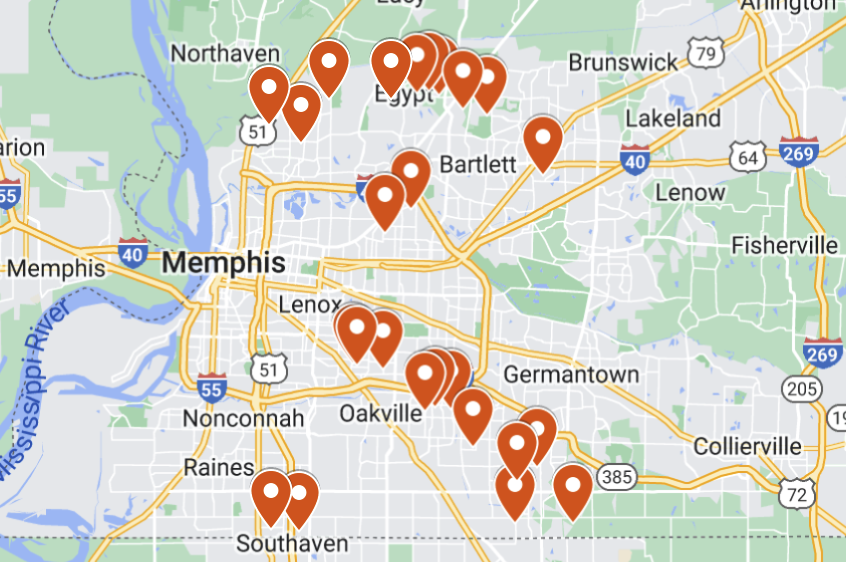
Property Overview

I had one vacancy this month, at Property #23, where I took possession of the house following an eviction. The good news here is that the turn wasn’t terribly expensive (just over $3K), and I also received the evicted tenant’s 2-month security deposit in the amount of $2,190. This softens the financial blow of this turn somewhat, but the eviction still took nearly 5 months so it was costly nonetheless. I hope to have a new tenant placed by June.
As I mentioned in last month’s report, there are two other properties whose tenants have given their notice-to-vacate, one on June 1st and the other on July 1st. Fingers crossed that these turns will also be quick, orderly, and relatively cheap.
Rental Income

I had full collections this month, plus “bonus” collections thanks to the large security deposit I retained at Property #23.
Also, I just passed in important milestone in my portfolio: after some recent lease renewals that contained small rent increases, the fully-occupied monthly rent roll in my portfolio is now over $30K! (It’s $30,031, to be precise.) Of course, any vacancy means a lower amount of rent is charged, as was the case this month.
Expenses

This screenshot comes from RentalHero, the online accounting tool I use for my portfolio.
Here are the highlights for my expenses this month:
Maintenance & Repairs: The costs of the turn at Property #23 are reflected in the “rent ready” category, while the balance of my properties had a host of typical repairs and maintenance issues. There was something new, though: one of my PM’s has started a mandatory program to clean gutters at properties that have them, which costs me $200 per cleaning. I generally opt out of preventative maintenance programs, and I’m still hoping to eventually convince my PM to allow me to opt out of this.
Legal Fees: This was due to a lawsuit brought by a previous tenant challenging the retention of her security deposit. This was for Property #22, and dates back to November 2023. (There are more legal fees coming in May for this.) The suit was settled, though I didn’t know about any of this until after the fact — so I’m still in dialogue with my PM about how to handle the fees, and whether I should be liable for them.
Tenant Chargeback: Several issues my PMs dealt with this month were charged back to tenants, which is the norm if the issue was caused by the tenant, or it is their responsibility to correct it (i.e. drain clogs). When the tenants pay my PMs for the work, I’ll be reimbursed.
Utilities: I received a refund for some of the utilities I paid for during the recent vacancy at Property #13. This is the typical process once the tenant puts the utilities account into their own name.
The Bottom Line

My financial model currently projects my Memphis portfolio to generate $9,256 of positive cash flow in an average month. This month, my cash flow was $9,040, just shy of my target. Even with over $6K in maintenance & repair costs, I nearly hit my goal due to the large security deposit, and otherwise full collections.
Finally, here’s the running tally and graph I update each month. The dotted blue line indicates my projected average monthly cash flow for my portfolio in each given month. April looked a lot like March, which was a happy surprise given I paid for a turn this month. But I’m still $3K below my cumulative cash flow target for the year, with two more turns coming up:


Free Rental Property Analyzer
Need help running the numbers on rental properties? Want to be more confident in your financial projections?
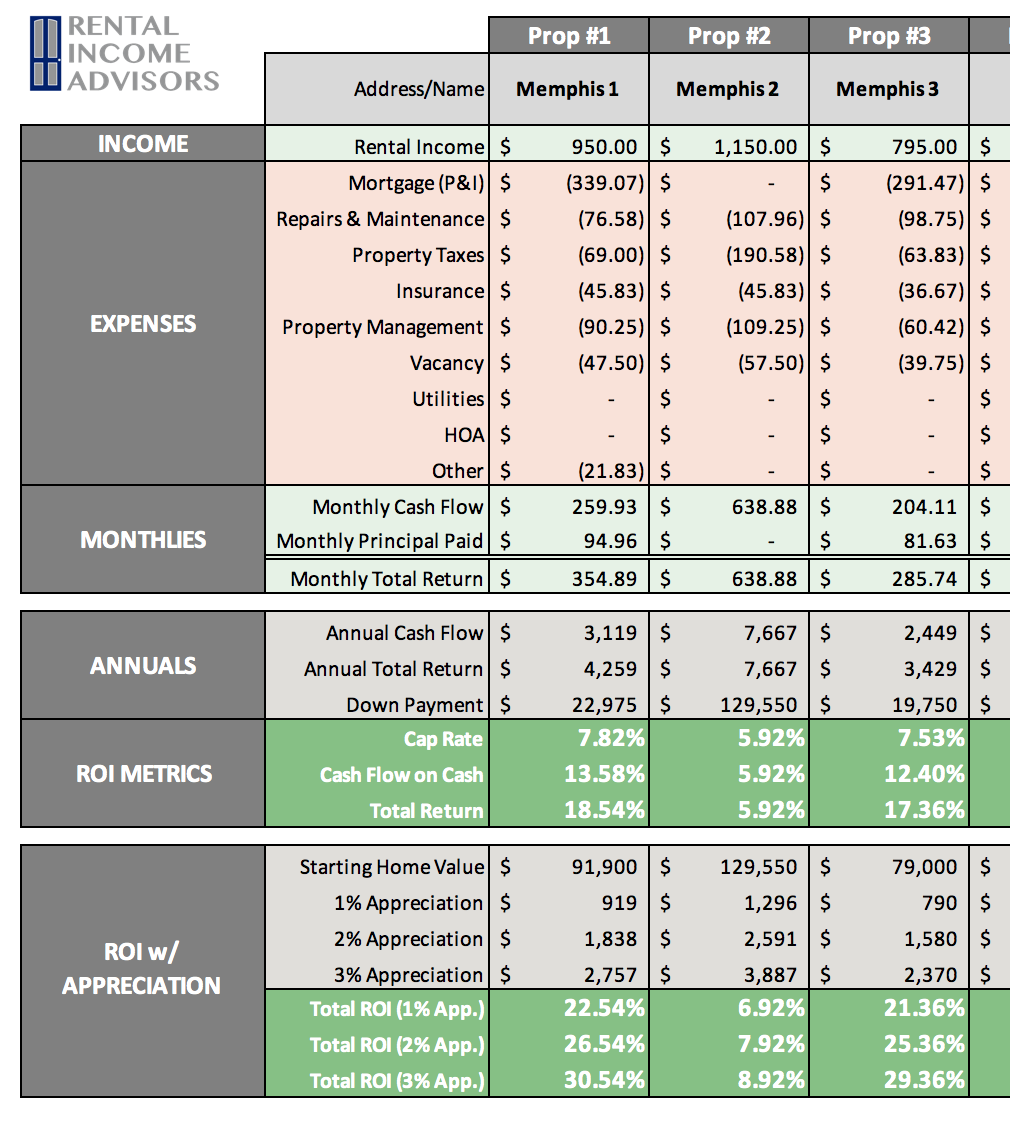
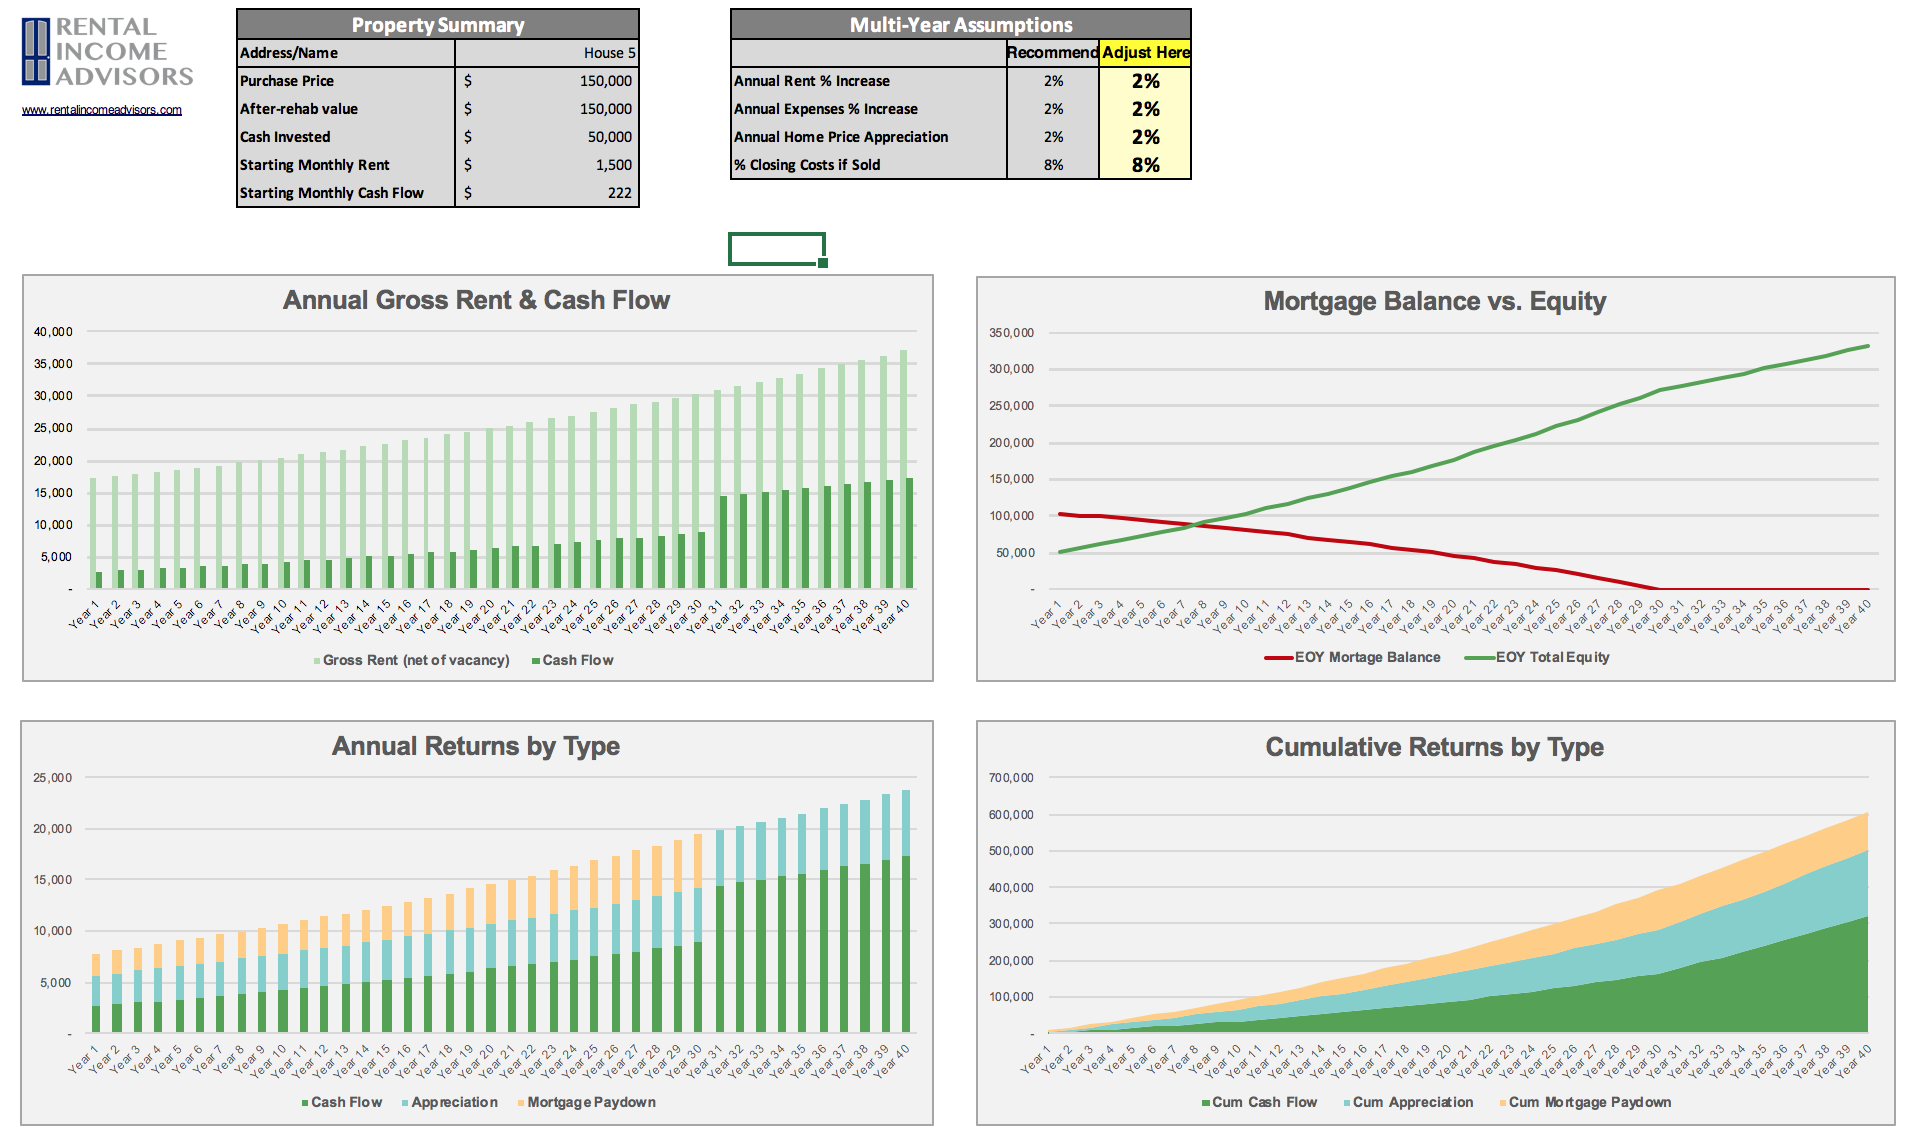
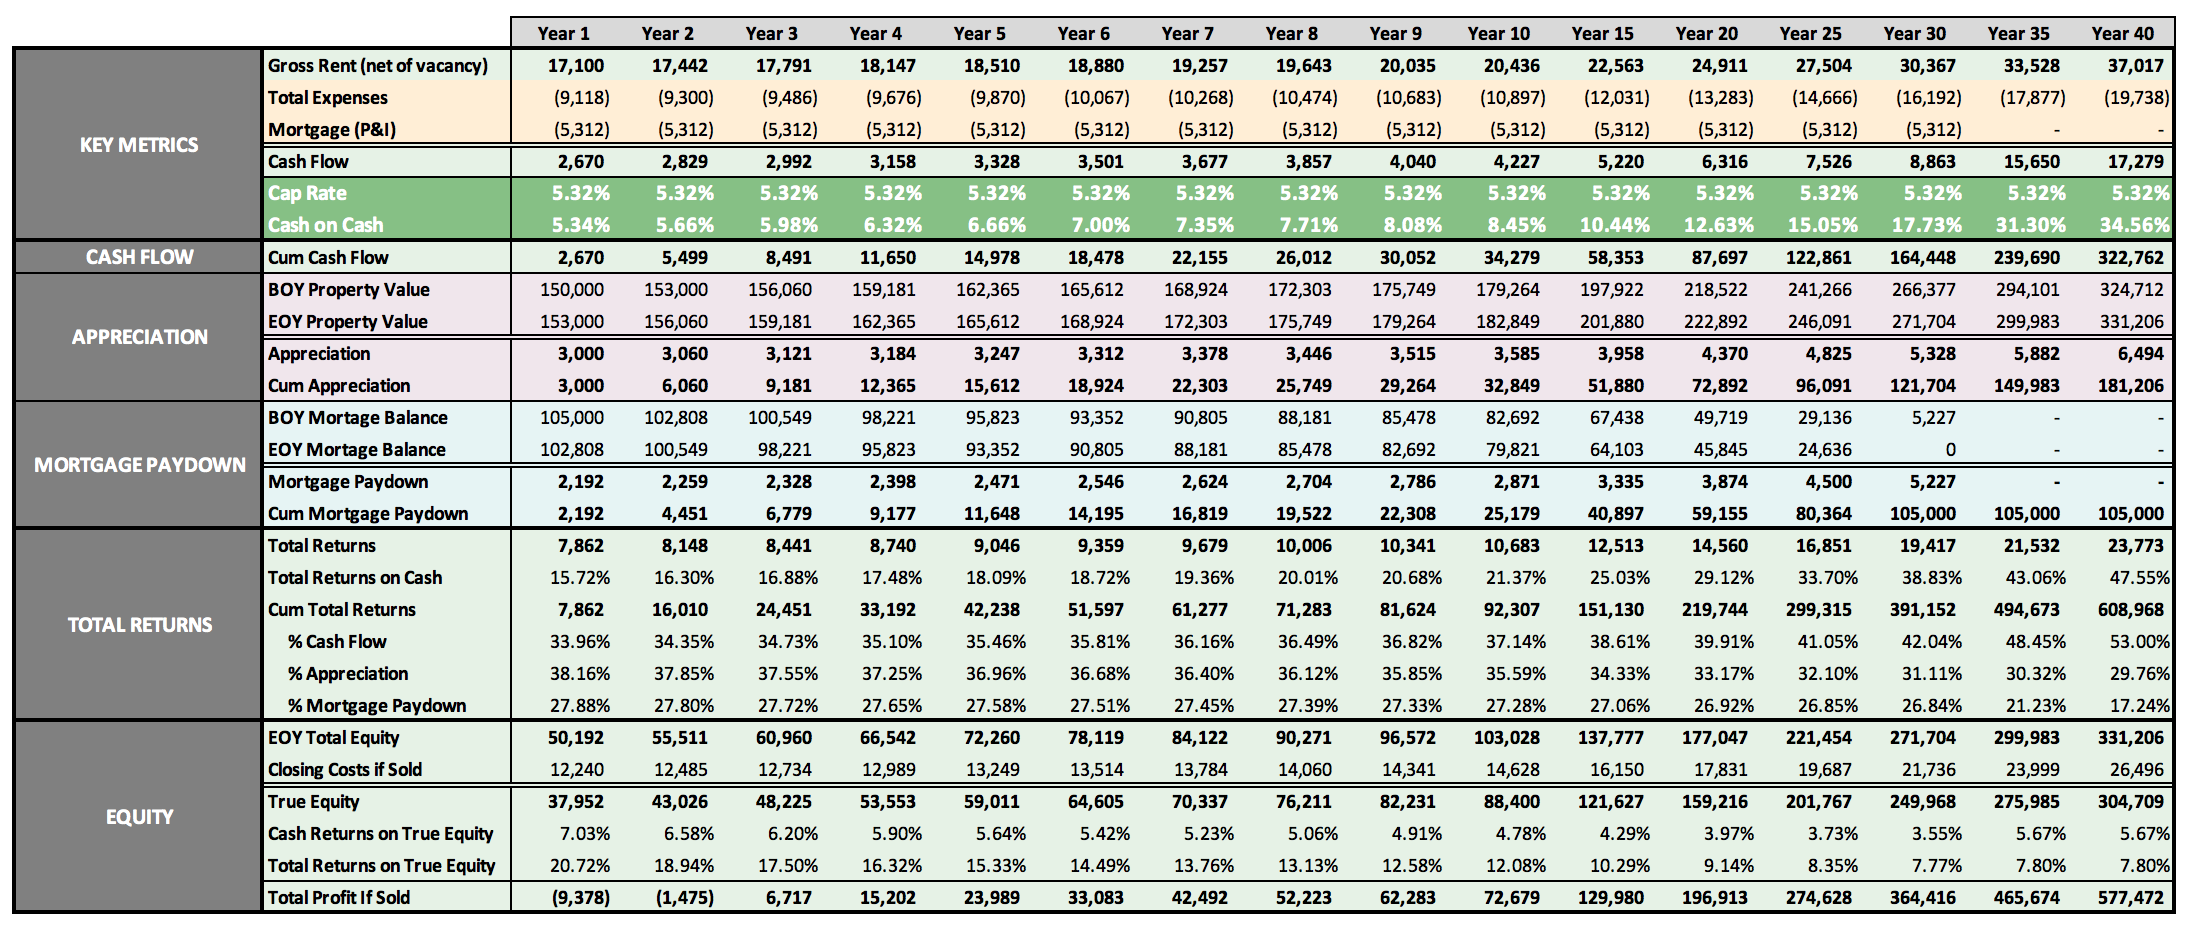
Check out the FREE RIA Property Analyzer. I guarantee this is the most intuitive, elegant, and powerful free tool you’ll find to run the financials on rental properties. I still use it every day, and so do all my coaching clients.
OR
Here’s what the Property Analyzer looks like:
About the Author
Hi, I’m Eric! I used cash-flowing rental properties to leave my corporate career at age 39. I started Rental Income Advisors in 2020 to help other people achieve their own goals through real estate investing.
My blog focuses on learning & education for new investors, and I make numerous tools & resources available for free, including my industry-leading Rental Property Analyzer.
I also now serve as a coach to dozens of private clients starting their own journeys investing in rental properties, and have helped my clients buy millions of dollars (and counting) in real estate. To chat with me about coaching, schedule a free initial consultation.