Monthly Portfolio Report: June 2023
One of my goals with Rental Income Advisors is to be as transparent and data-driven as possible with my readers and my coaching clients. I think the best way to build confidence in a new investor is to actually show the numbers, to prove that rental property investing really does work as advertised.
For those reasons, I publish a monthly report on my portfolio’s performance. I hope that this chronological history paints a clear picture of what it’s like to be a remote landlord. It’s also a great exercise for me to be sure I’m staying plugged in to all my numbers.
Here is the update for June 2023. You can also check out all my previous monthly reports and annual reports.
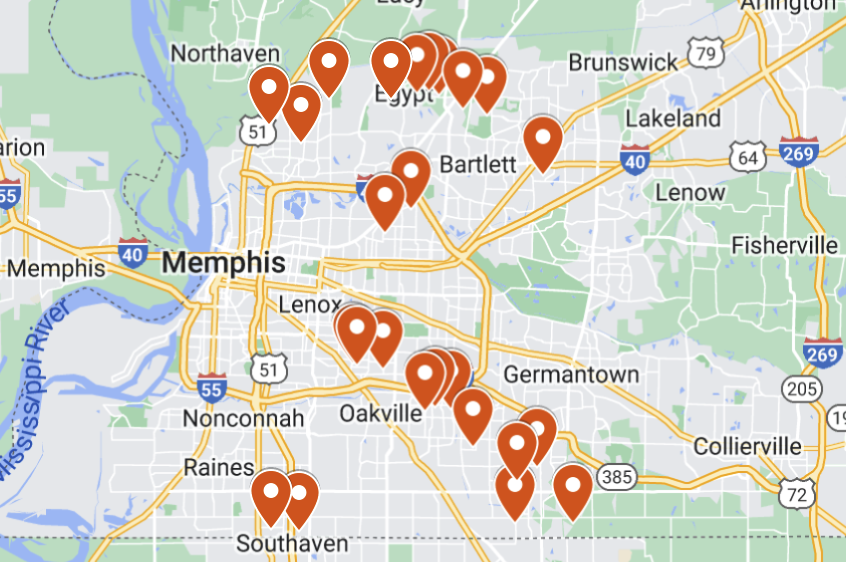
Property Overview

I continue to be at full occupancy, just as I was in last month’s report. I looked it up, and 100% is the highest you can go.
Rental Income

The tenant at Property #20 filed for bankruptcy, which means the eviction proceedings will be extended. This is leading to a $1,095 shortfall in collections each month. As I previously mentioned, though, my PM has agreed to reimburse me for the lost rent during the eviction, so at some point I will see a big chunk of income to offset all those shortfalls.
Separately, I had another tenant fail to pay their full rent in June. This is another relatively new tenant from Property #23 that I bought towards the end of last year. History has taught me that most tenant payment troubles do not lead to eviction, so hopefully that will turn out to the case here as well.
Expenses

This screenshot comes from RentalHero, the online accounting tool I use for my portfolio.
Here are the highlights of my expenses this month:
Maintenance & Repairs: It was an especially quiet month for repairs, which included a few occupied home inspections, a few inexpensive HVAC visits, and a carpentry repair to fix a hole in an attic where birds were getting in.
The Bottom Line

My financial model currently projects my Memphis portfolio to generate $8,903 of positive cash flow in an average month. This month, my cash flow was $11,178, more than $2,000 above my projected average. Despite my relatively poor rent collections, these factors caused me to exceed my pro forma this month:
Full occupancy (vs. 5% vacancy factor in my pro forma)
Low maintenance & repair costs ($1,091 vs. $3,050 in my pro forma)
Finally, here’s the running tally and graph I update each month. The dotted blue line indicates my projected average monthly cash flow for my portfolio in each given month. I’m very close to my cumulative projected cash flow for the year, sitting just $933 below that mark:


Free Rental Property Analyzer
Need help running the numbers on rental properties? Want to be more confident in your financial projections?
Check out the FREE RIA Property Analyzer. I guarantee this is the most intuitive, elegant, and powerful free tool you’ll find to run the financials on rental properties. I still use it every day, and so do all my coaching clients.
OR
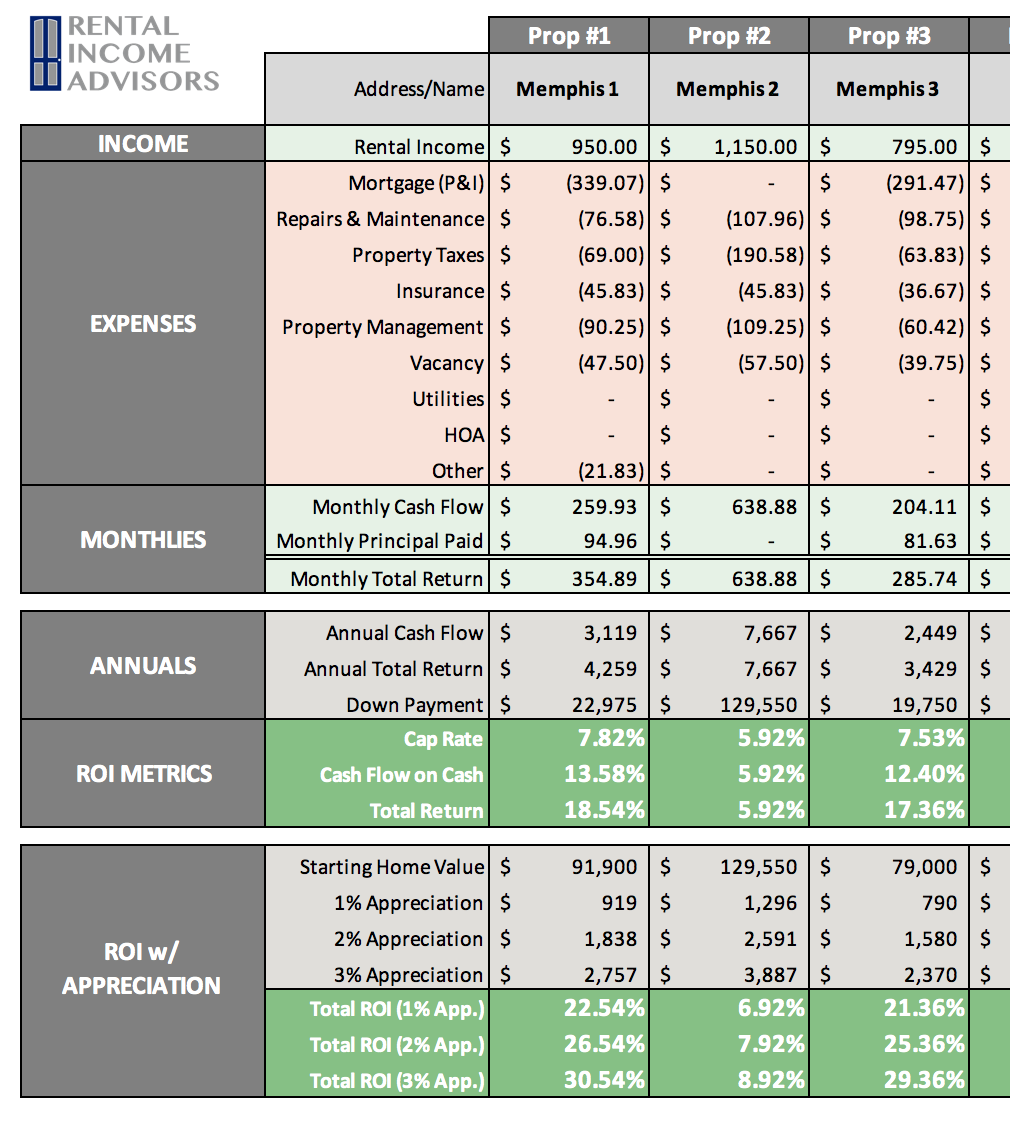
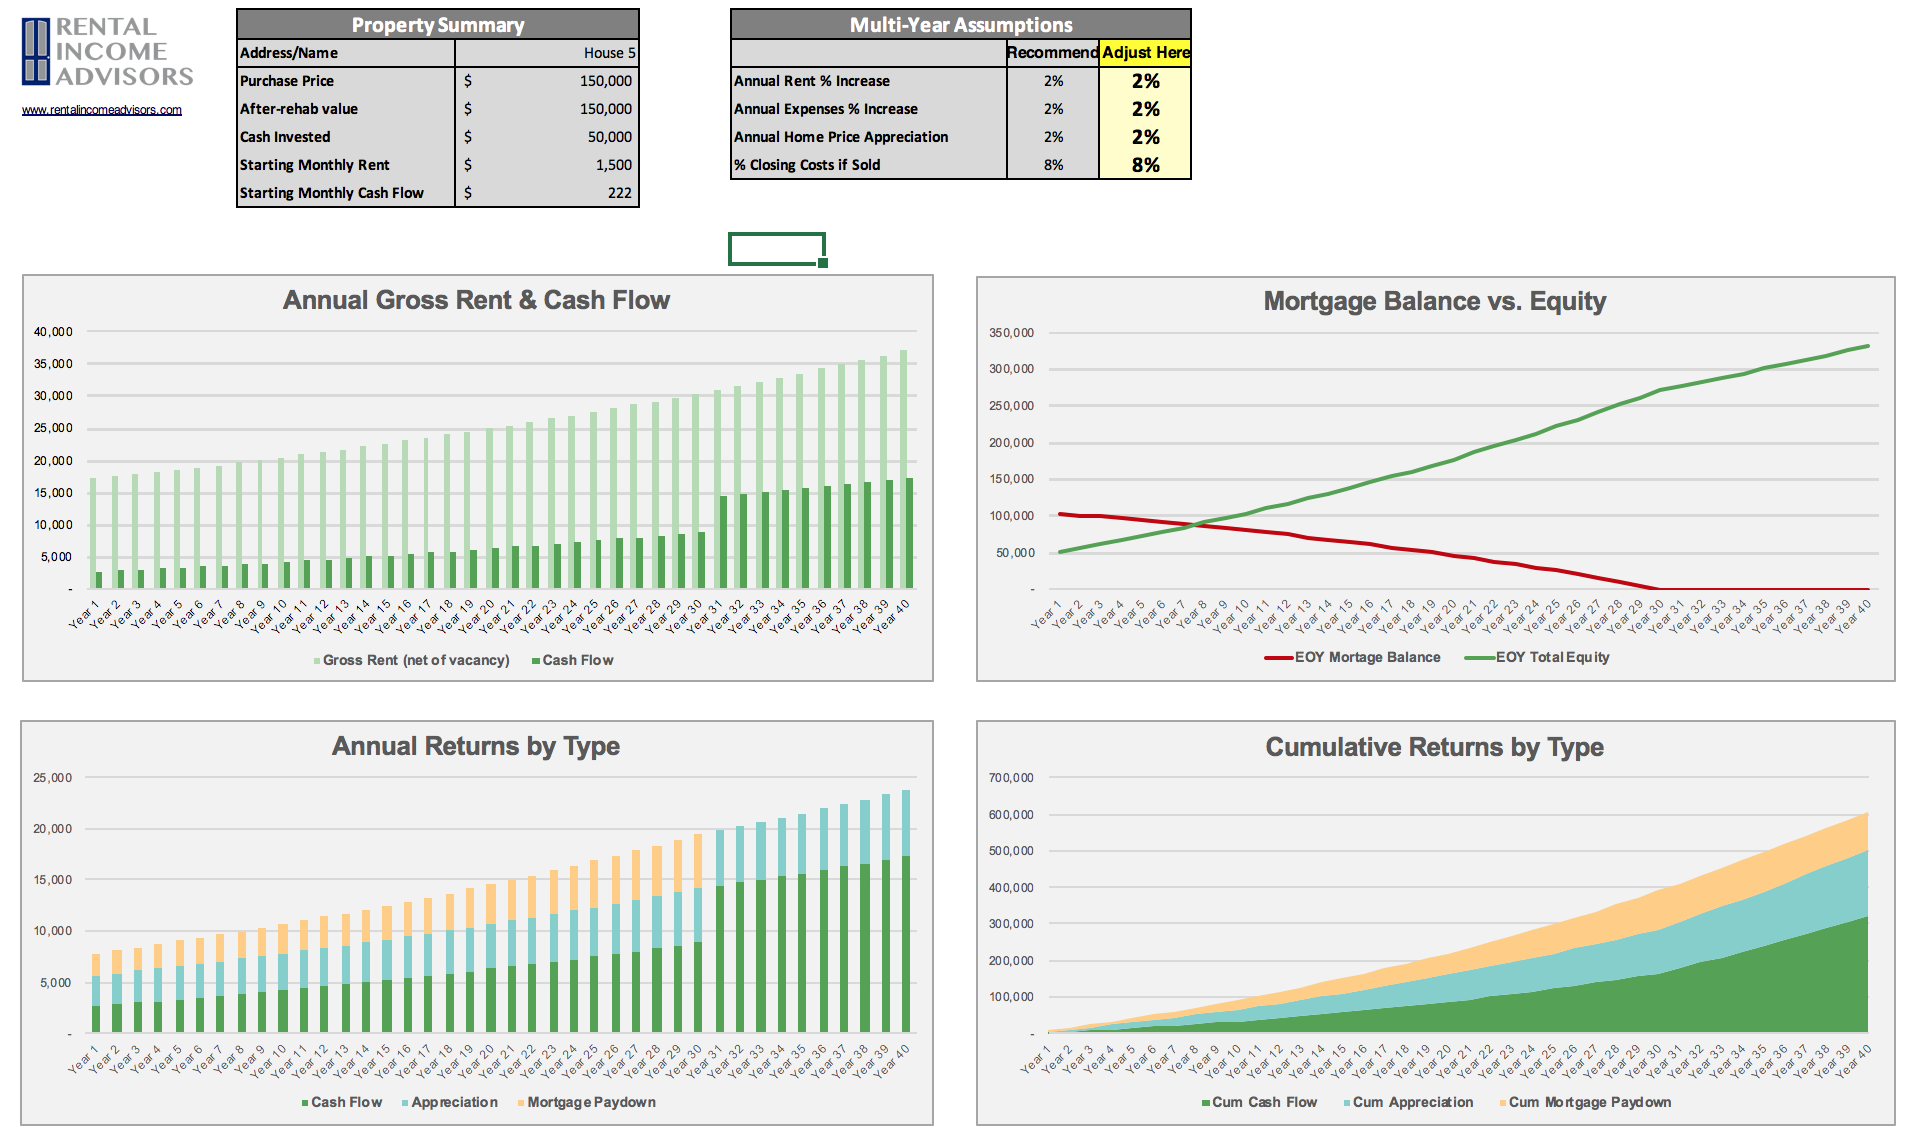
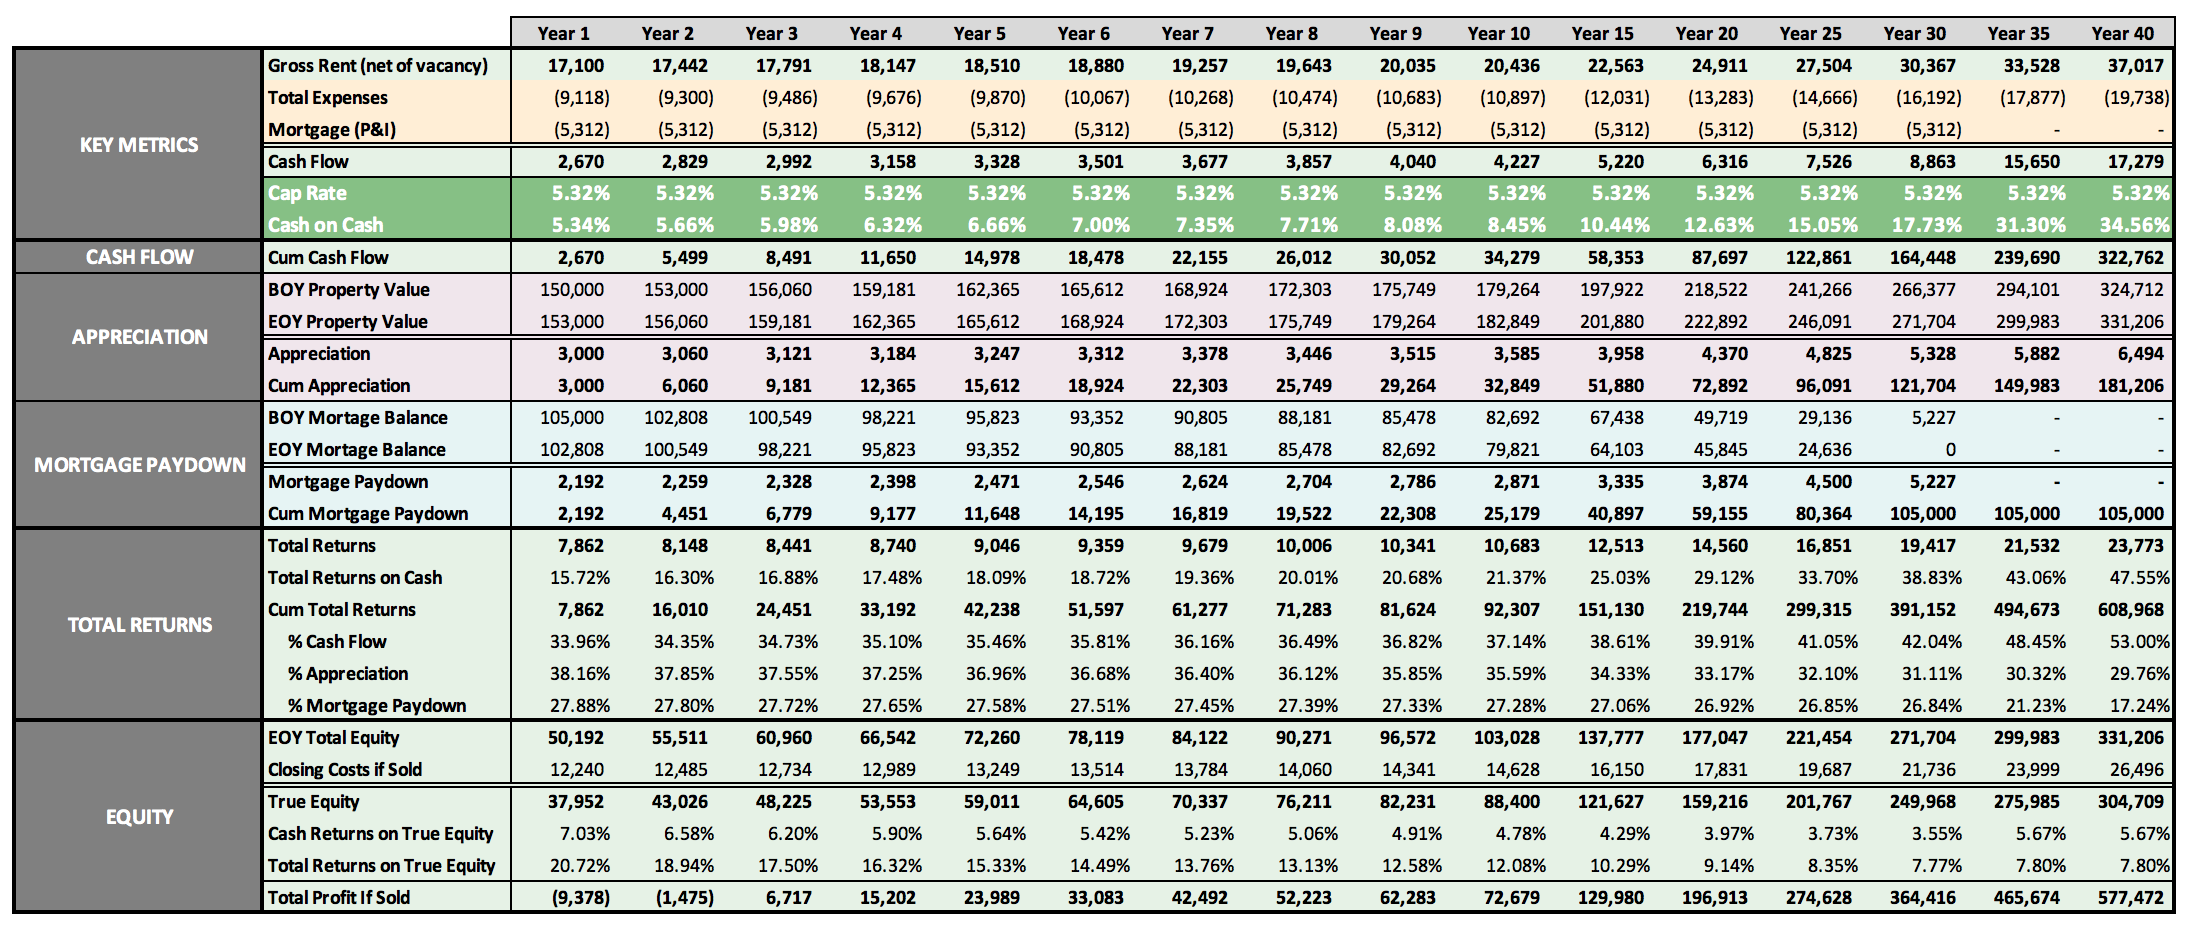
Here’s what the Property Analyzer looks like:
About the Author
Hi, I’m Eric! I used cash-flowing rental properties to leave my corporate career at age 39. I started Rental Income Advisors in 2020 to help other people achieve their own goals through real estate investing.
My blog focuses on learning & education for new investors, and I make numerous tools & resources available for free, including my industry-leading Rental Property Analyzer.
I also now serve as a coach to dozens of private clients starting their own journeys investing in rental properties, and have helped my clients buy millions of dollars (and counting) in real estate. To chat with me about coaching, schedule a free initial consultation.