Monthly Portfolio Report: October 2021
One of my goals with Rental Income Advisors is to be as transparent and data-driven as possible with my readers and my coaching clients. I think the best way to build confidence in a new investor is to actually show the numbers, to prove that rental property investing really does work as advertised.
For those reasons, I publish a monthly report on my portfolio’s performance. I hope that this chronological history paints a clear picture of what it’s like to be a remote landlord. It’s also a great exercise for me to be sure I’m staying plugged in to all my numbers.
Here is the update for October 2021. You can also check out all my previous monthly reports.
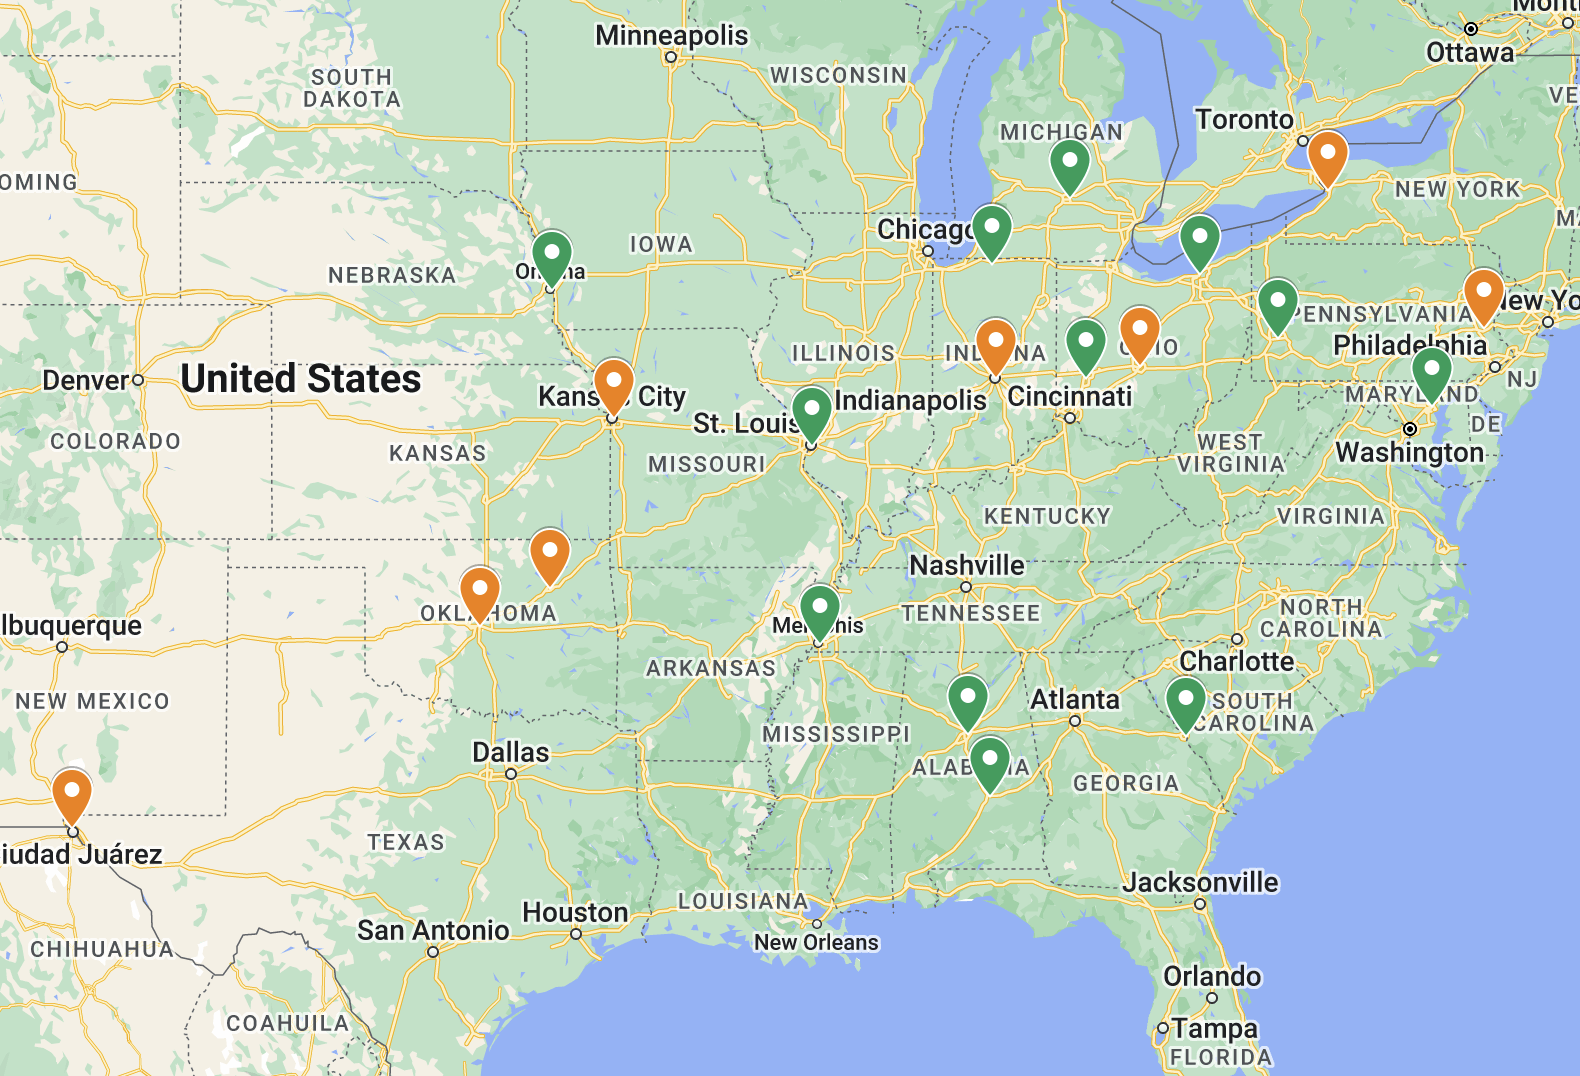
Property Overview

As I mentioned last month, I turned Property #19 starting in October, so I fell to 95% occupied for the month. The tenant vacated on September 30th at the end of their lease, with proper notice. However, because of some damage to the walls that had to be repaired, I retained the security deposit. More on the numbers for this turn below.
The following month in November, I started another turn at Property #17 in November. Here, the tenant broke their lease early due to personal circumstances, so again I’ll have the benefit of retaining the security deposit to offset the costs of the turn.
Let’s take a closer look at both of these turns, including duration and costs.
The Turn at Property #19
This property was in good shape when I bought it in February of this year — in fact, it had a full turnkey rehab in 2014, and had been well-maintained since. In light of that, I was surprised and disappointed that the cost of the turn was $5,600. Here’s where those costs came from:
$3,500 for paint, drywall, doors, and blinds: the tenant left some damage to walls and doors, so repairs and a full paint job were required
$1,000 for exterior work: this included removal of significant vegetation around the perimeter (which improved the curb appeal dramatically), replacing two broken window panes, and installing a missing chimney cap
$1,100 in miscellaneous work: this included installing smart knobs and locks to facilitate showing the house to potential tenants, replacing broken attic stairs, re-caulking the bathrooms, and the final clean
This was all pure expense (no capital expenditures), and I only had a $500 security deposit to offset these costs. It took about a week to get the scope of work and approve it, and then another 3 weeks to complete the work. The silver lining to this turn: the house rented quickly after about 10 days on the market, for an additional $75/month compared to the previous tenant’s rate. The tenant’s move-in date is December 10th.
The Turn at Property #17
This was a turnkey property I bought last year. The tenant had signed a two-year lease, but had to vacate early (at the end of October) due to personal circumstances.
This turn was much cheaper and faster than the other one. Total costs were just under $2,000 — mostly for paint, which was required due to significant scuffing/marking around the house — but I had a $725 security deposit to offset these costs. It took just 10 days to get the work scoped and completed, so the house is already on the market and ready for occupancy. The asking rent is $150/month higher than the previous tenant was paying, so assuming it rents quickly, this will be a very quick and successful turn.
Note that the numbers for this turn won’t be included in this update — that will have to wait for November’s report, because those costs were incurred in November.
Rents

In addition to having several turns in progress, I also encountered some difficulties with collections in October. I hinted at this in last month’s update, when I mentioned that I had two tenants who had not paid by the 20th of the month.
The tenant at Property #6 ultimately paid about half their rent by the end of October, but this still hurt my collections numbers a bit. The good news is that this tenant is now almost completely caught up on both October and November rent. Their payment issues are still a concern, but they are in the clear for the moment.
The other tenant, at Property #9, is having a tougher time. They did not pay any rent in October, so my property manager filed for eviction toward the end of the month, and we are awaiting a court date. In the meantime, the tenant continues to be unable to pay, and has applied for help from a local agency that provides emergency rental assistance. I’ve also offered the tenant a cash-for-keys arrangement, whereby they would leave the property in good condition by the end of November, in exchange for a cash payment from me and cancellation of the eviction proceedings. (Why would I pay a tenant to leave, when that tenant owes me money? Because it’s faster and cheaper than the alternative, which is waiting months for the eviction to move through the courts. It can also be better for the tenant, because they avoid having an eviction on their record, which can make it difficult for them to rent in the future.) I’m still waiting to hear whether the tenant will qualify for assistance, and if not whether they will be accepting the cash-for-keys offer. If all that fails, the eviction will move forward, which may take several more months. I’ll update on this situation next month.
Expenses

Very heavy expenses this month, mostly driven by the turn at Property #17:
Maintenance & Repairs: I split these costs into sub-categories for Rent-Ready and General — and as you can see, most of these costs came from those rent-ready repairs. Just a few other typical maintenance issues (HVAC, plumbing, etc.) at occupied properties this month.
Legal Fees: This was the initial eviction filing fee for Property #9, as discussed above.
The Bottom Line

My financial model currently projects my Memphis portfolio to generate $6,035 of positive cash flow in an average month. In October, the positive cash flow was just $754, way below target.
Finally, here’s the running tally and graph I update each month. The dotted blue line indicates my projected average monthly cash flow for my portfolio in each given month. With this poor month, I’ve fallen back below my TYD cash flow expectations, with only two months left to make up ground.
But I’m still level with the total projected cash flow since April 2020. (And my cash flow now exceeds $100K since that time, which is a nice milestone to note.) Obviously, there are good months and bad months — look at the ups and downs this year! — but the long-term trend line is where it’s supposed to be, which validates that the assumptions I’m making in my financial modeling are sound.


Free Rental Property Analyzer
Need help running the numbers on rental properties? Want to be more confident in your financial projections?
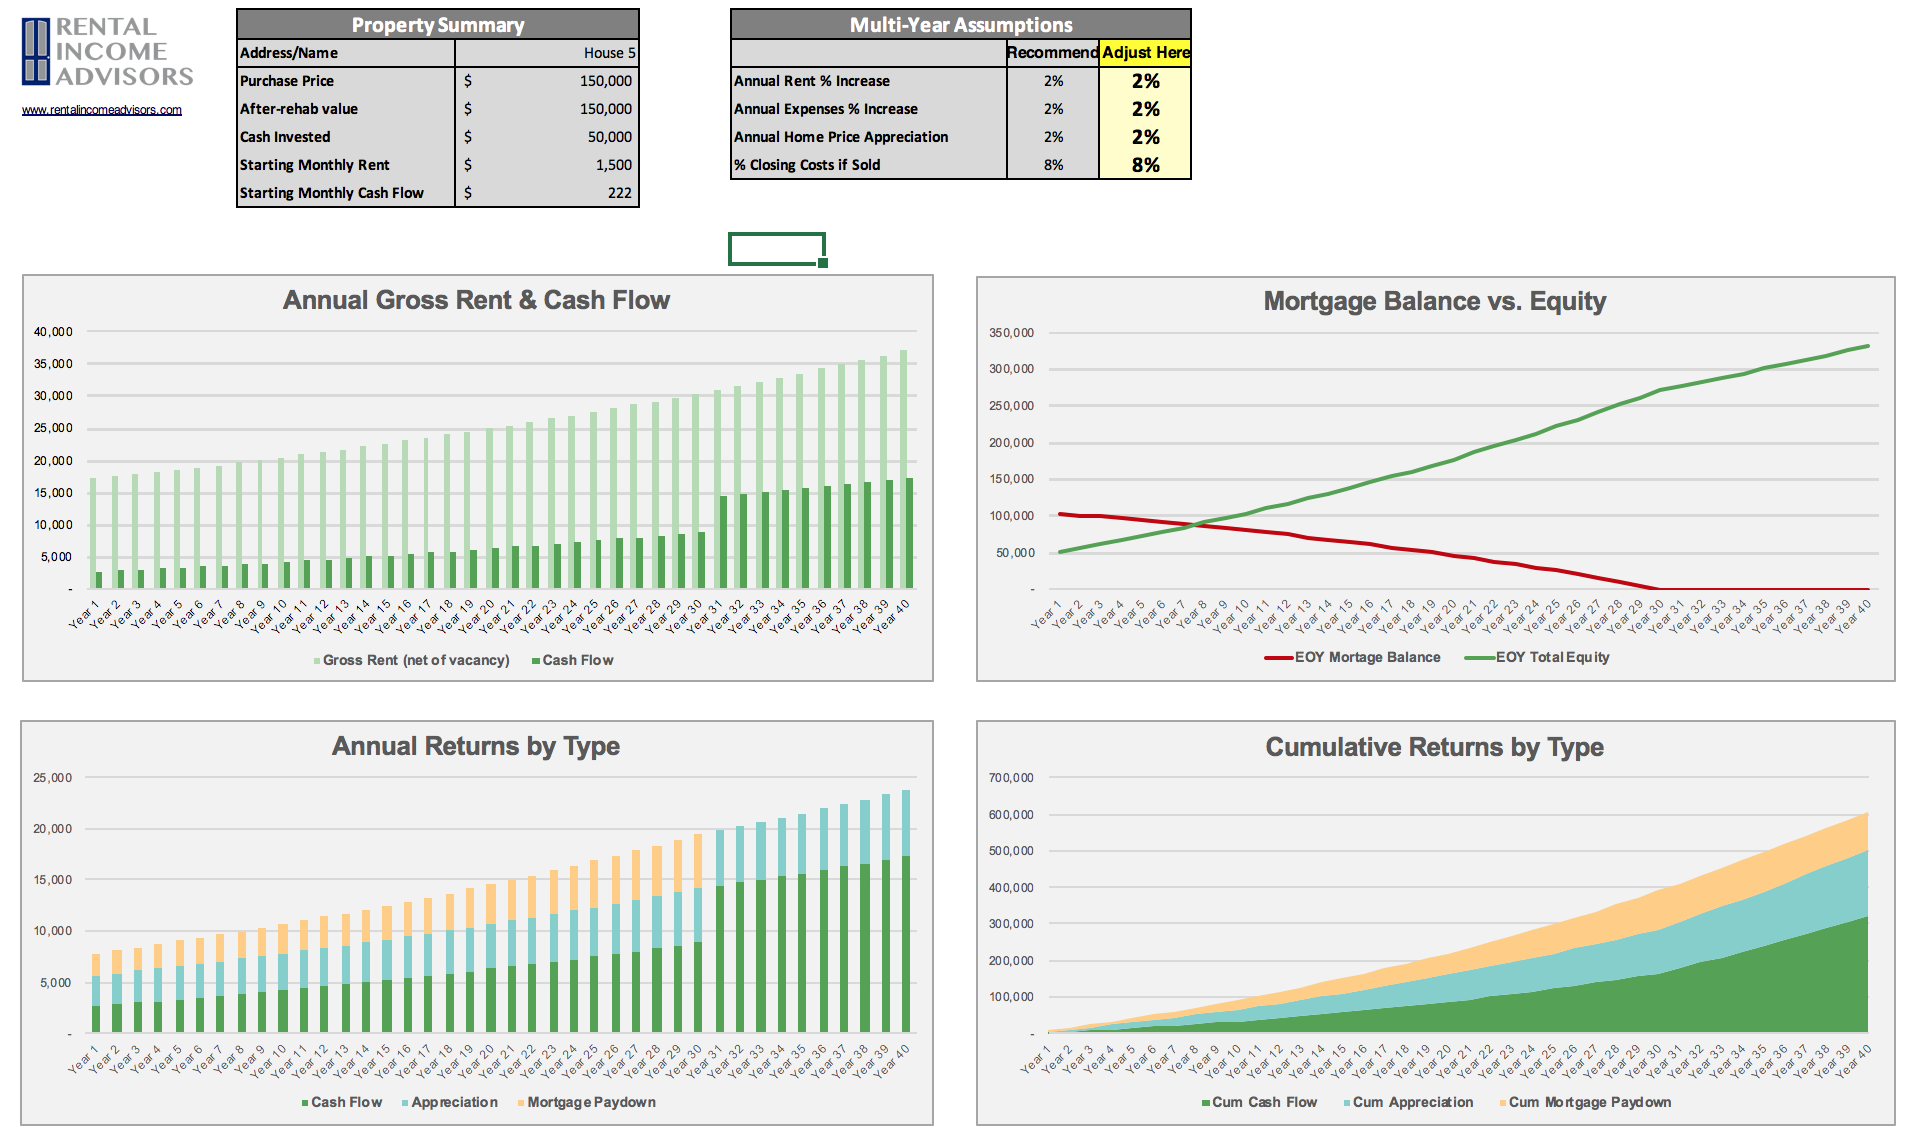
Check out the FREE RIA Property Analyzer. I guarantee this is the most intuitive, elegant, and powerful free tool you’ll find to run the financials on rental properties. I still use it every day, and so do all my coaching clients.
Here’s what the Property Analyzer looks like:
About the Author
Hi, I’m Eric! I used cash-flowing rental properties to leave my corporate career at age 39. I started Rental Income Advisors in 2020 to help other people achieve their own goals through real estate investing.
My blog focuses on learning & education for new investors, and I make numerous tools & resources available for free, including my industry-leading Rental Property Analyzer.
I also now serve as a coach to dozens of private clients starting their own journeys investing in rental properties, and have helped my clients buy millions of dollars (and counting) in real estate. To chat with me about coaching, schedule a free initial consultation.