Monthly Portfolio Report: November 2021
One of my goals with Rental Income Advisors is to be as transparent and data-driven as possible with my readers and my coaching clients. I think the best way to build confidence in a new investor is to actually show the numbers, to prove that rental property investing really does work as advertised.
For those reasons, I publish a monthly report on my portfolio’s performance. I hope that this chronological history paints a clear picture of what it’s like to be a remote landlord. It’s also a great exercise for me to be sure I’m staying plugged in to all my numbers.
Here is the update for November 2021. You can also check out all my previous monthly reports.
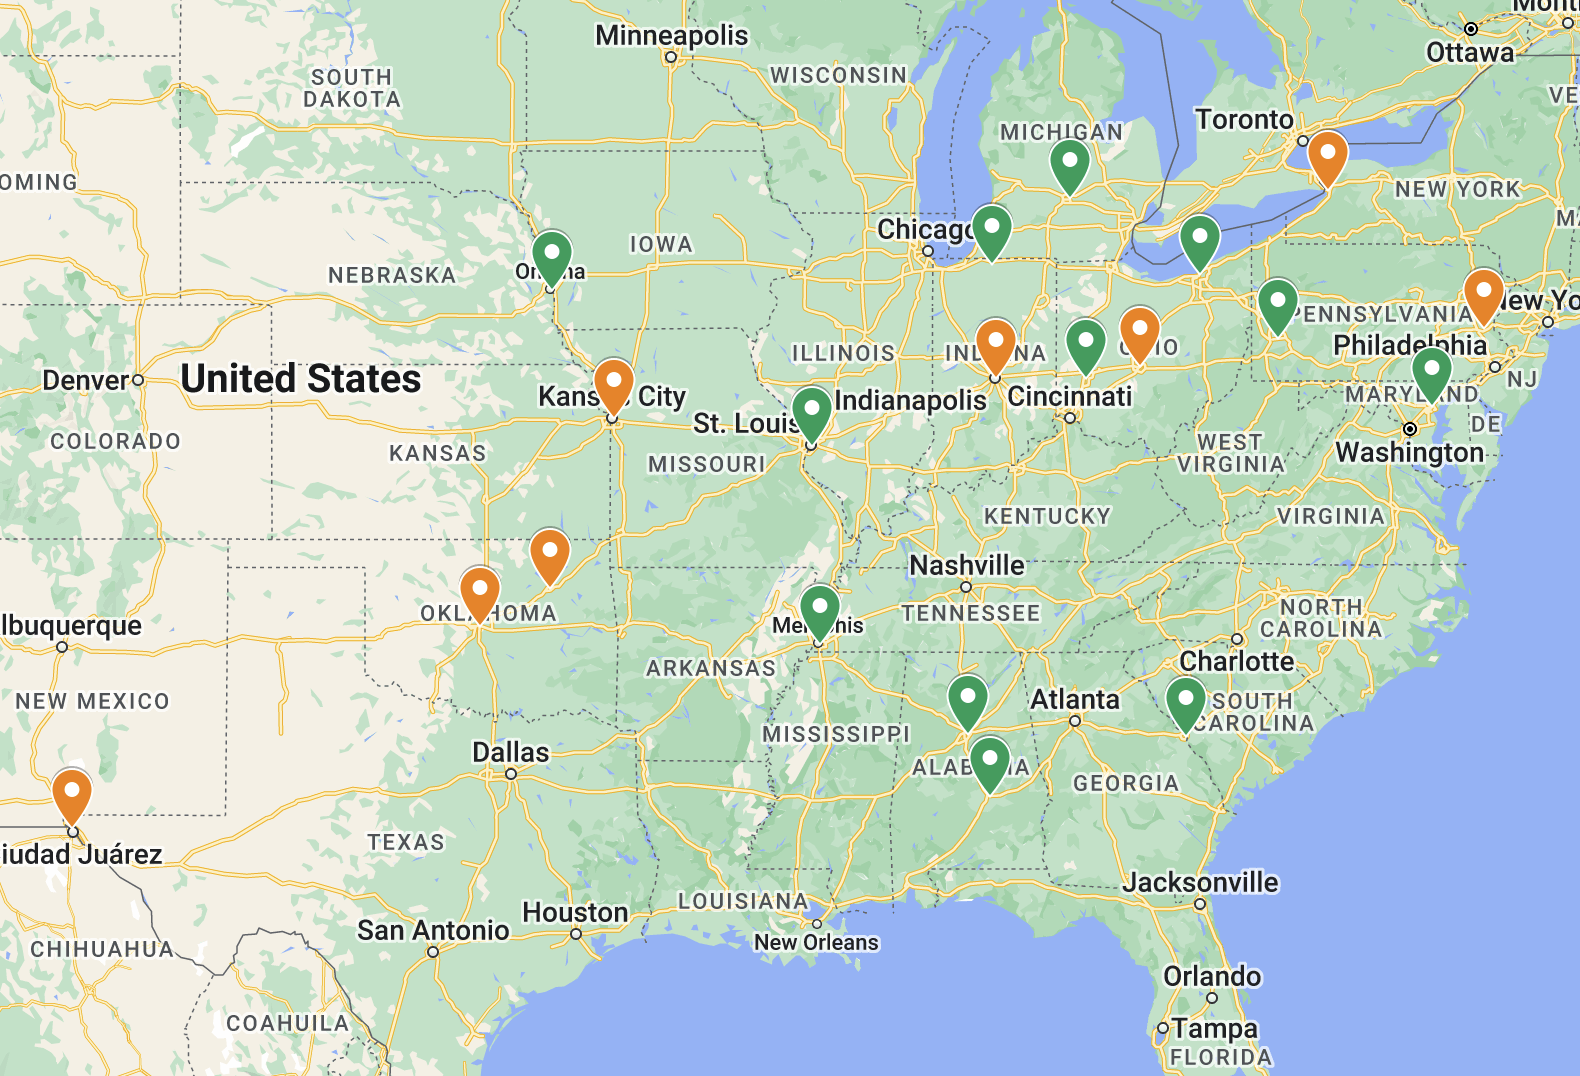
Property Overview

As I mentioned last month, I recently turned both Property #19 and Property #17, and as a result they were both vacant in November, which reduced my occupancy to 90%.
I reviewed the details of both turns in last moth’s updates; only one of the turns’ costs was incurred in November, so only those costs will be reflected in this update.
The good news is that both properties are now re-rented and the tenants have moved in, at rents that are $75/mo. and $150/mo. more than the previous tenants were paying, respectively. So I’m back to 100% occupancy — but it also means these two properties are now set up to exceed their original pro forma targets in the next few years, based on those higher rents (assuming no other issues arise, of course.)
Rents

An update to the tenant payment issues at Property #9 that I described last month: the tenant has refused the cash-for-keys offer, and has so far not taken any steps to apply for available rental assistance from local groups. Therefore, the eviction must remain in process, and I’m still waiting for a court date. It will likely be several months before I am able to take back possession of the house. This is the worst outcome for all parties, but there’s only so much I and my PM can do if the tenant is unwilling to take any steps to help themselves.
The lack of collection of the rent at Property #9 was more than offset by the security deposit at Property #17, and back-rent payed from another tenant who fell slightly behind a few months ago — so I ended up over-collecting this month despite the ongoing eviction.
Expenses

Relatively high expenses this month, driven by a two factors in particular:
Maintenance & Repairs: In addition to a typical month of normal maintenance & repairs costing ~$1K, I paid the turn costs at Property #17 for just over $2K. This cost was somewhat offset by the $725 security deposit I was able to retain due to the tenant’s lease break.
Insurance: Most of my insurance premiums are payed out of escrow by my lenders, and are therefore baked into the “Mortgage” line item. However, there are 3 properties that I own outright without a mortgage, and November is the month when I renew those insurance policies and pay the annual premium — this explains the $1,614.44 expense.
Utilities: I am responsible for utilities while properties are vacant, so I incurred some expense from the two properties being turned in November.
The Bottom Line

My financial model currently projects my Memphis portfolio to generate $6,035 of positive cash flow in an average month. In October, the positive cash flow was just $3,274, nearly $3K below target. Turning several properties at once, combined with an ongoing eviction, has depressed my cash flow significantly in the last two months.
Finally, here’s the running tally and graph I update each month. The dotted blue line indicates my projected average monthly cash flow for my portfolio in each given month. I’m now noticeably behind my total expected cash flow for the year, with not enough time to make up the shortfall. (But I’ll still end up with ~$60K in essentially tax-free rental income this year, so…I’ll take it! ;-)
I’ll do a much deeper dive into my full-year 2021 numbers when I publish my annual performance report in the new year. (Here were my 2020 numbers if you want a refresher before the upcoming sequel...)


Free Rental Property Analyzer
Need help running the numbers on rental properties? Want to be more confident in your financial projections?
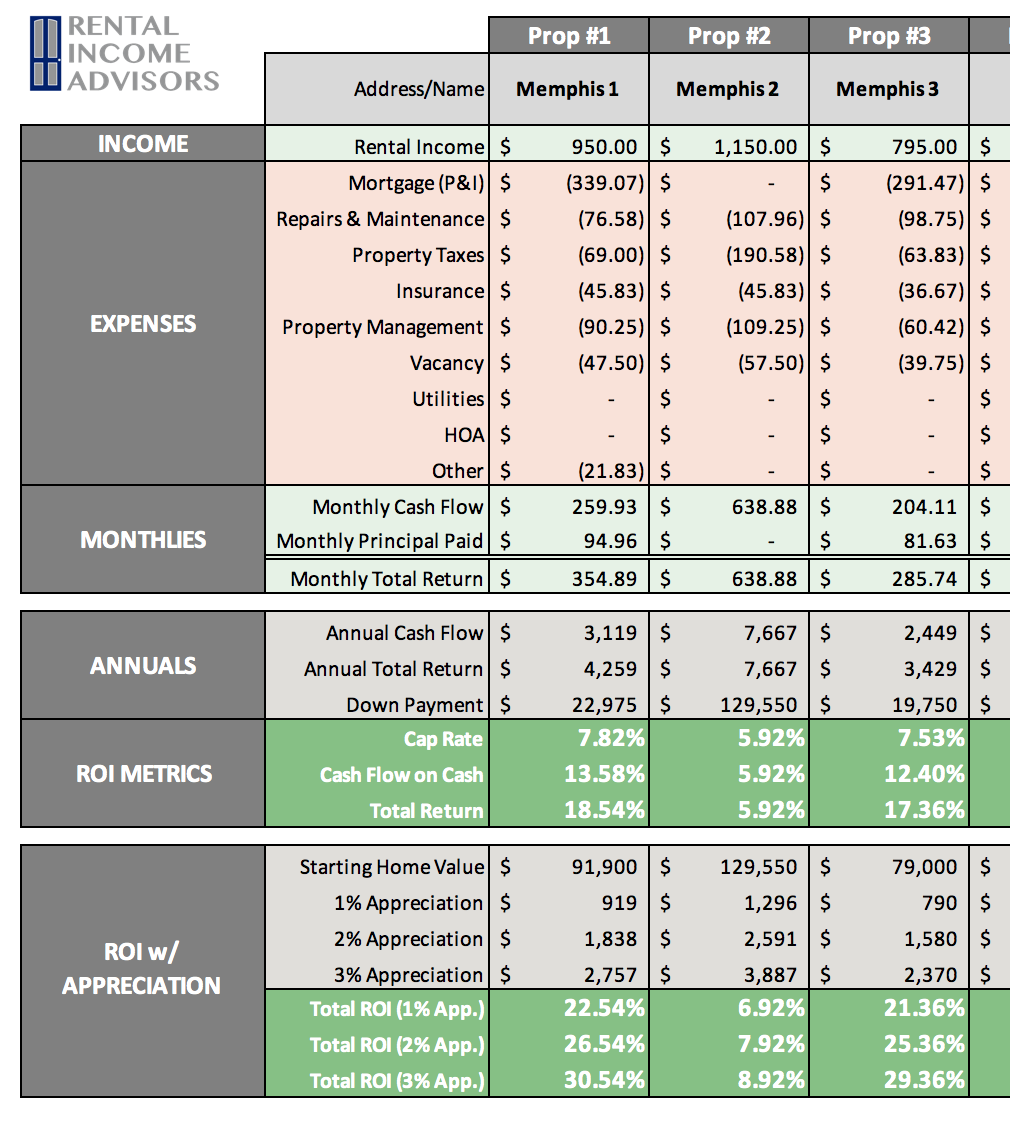
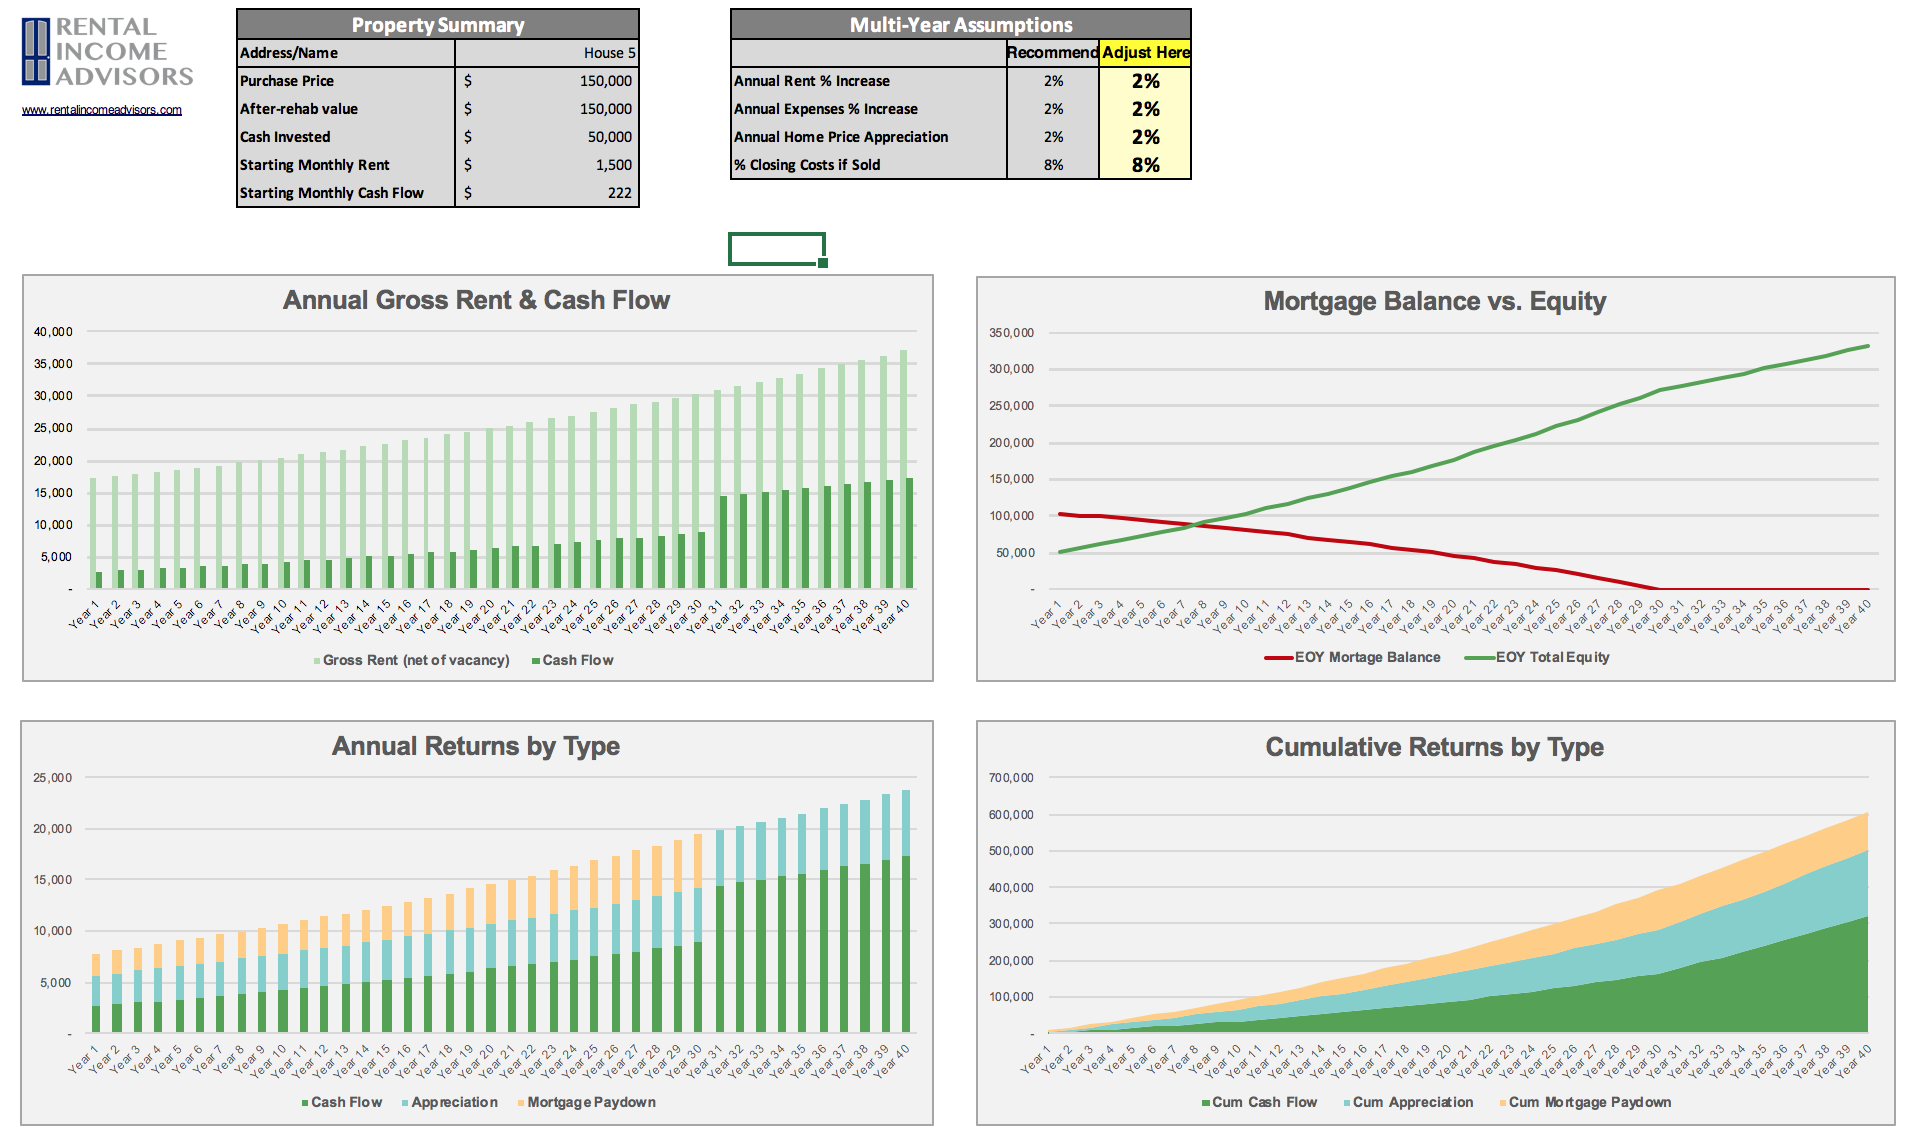
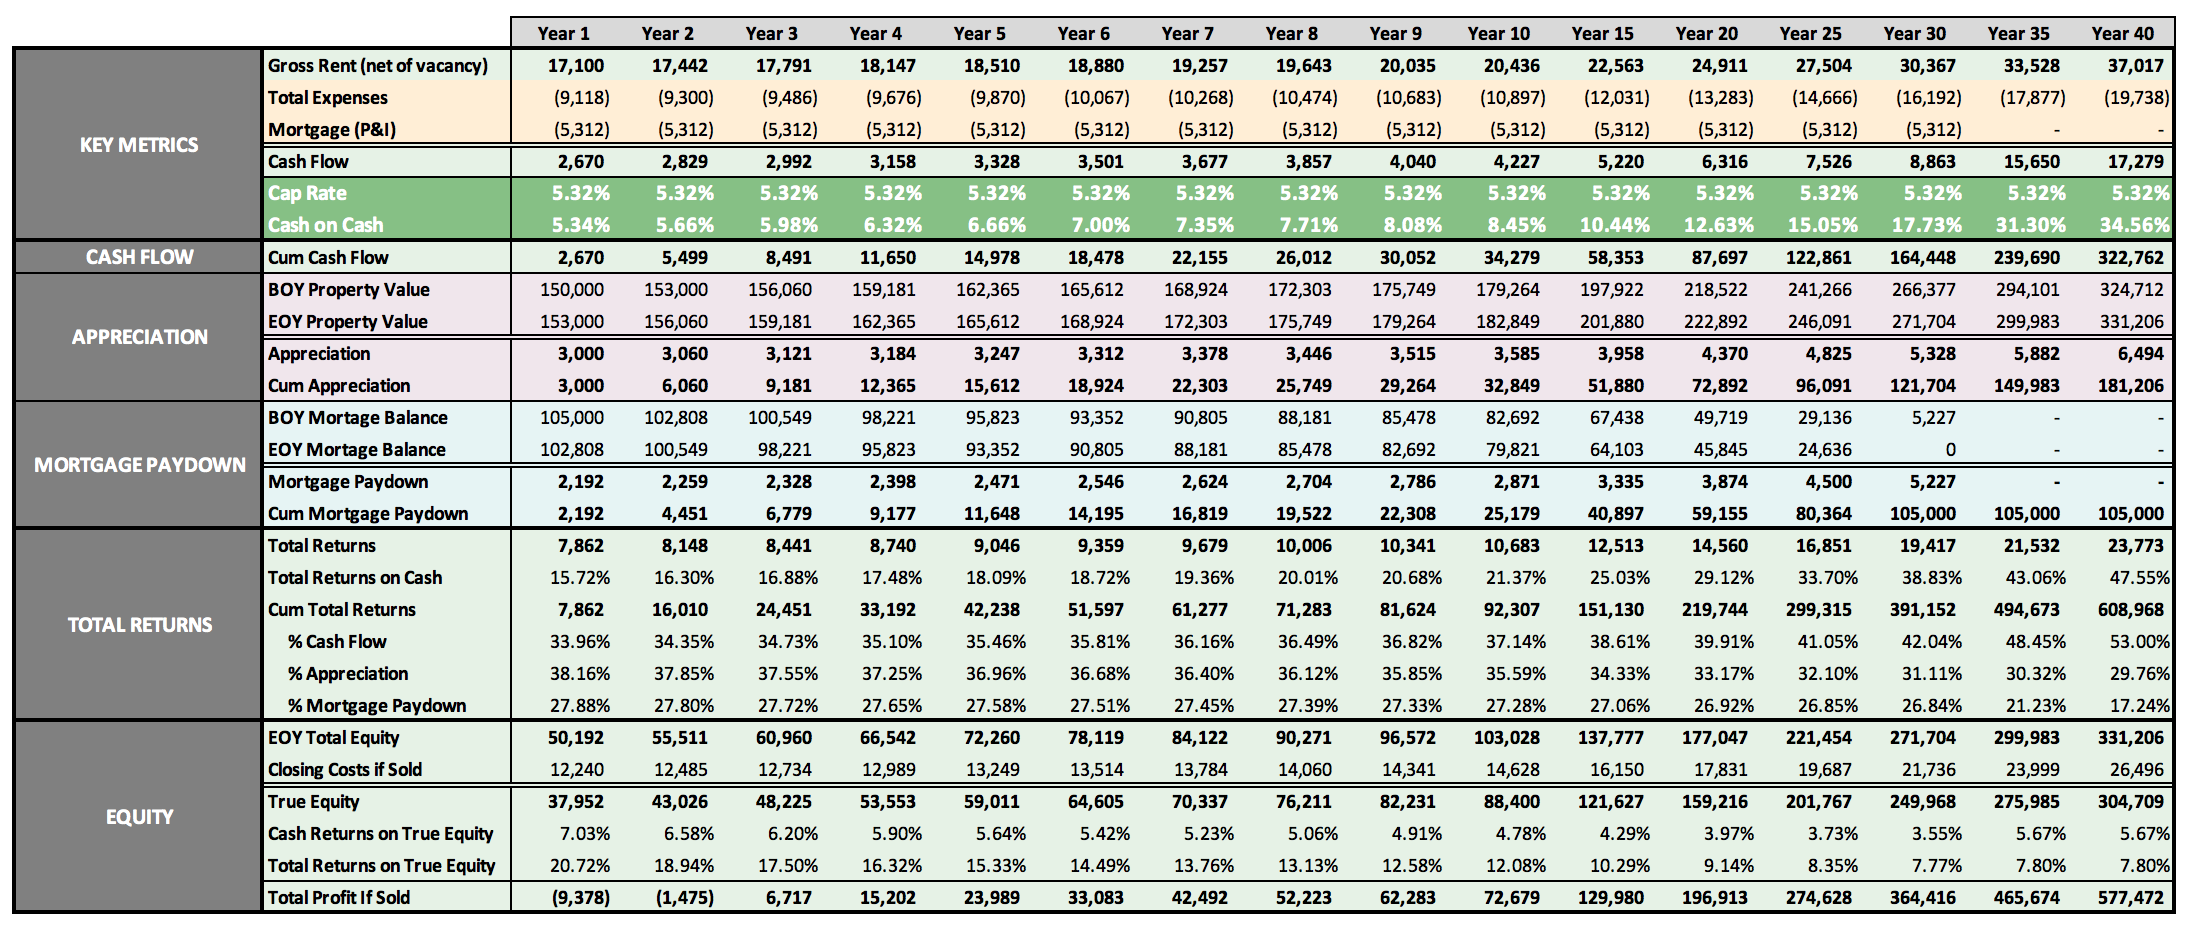
Check out the FREE RIA Property Analyzer. I guarantee this is the most intuitive, elegant, and powerful free tool you’ll find to run the financials on rental properties. I still use it every day, and so do all my coaching clients.
Here’s what the Property Analyzer looks like:
About the Author
Hi, I’m Eric! I used cash-flowing rental properties to leave my corporate career at age 39. I started Rental Income Advisors in 2020 to help other people achieve their own goals through real estate investing.
My blog focuses on learning & education for new investors, and I make numerous tools & resources available for free, including my industry-leading Rental Property Analyzer.
I also now serve as a coach to dozens of private clients starting their own journeys investing in rental properties, and have helped my clients buy millions of dollars (and counting) in real estate. To chat with me about coaching, schedule a free initial consultation.