Monthly Portfolio Report: June 2022
One of my goals with Rental Income Advisors is to be as transparent and data-driven as possible with my readers and my coaching clients. I think the best way to build confidence in a new investor is to actually show the numbers, to prove that rental property investing really does work as advertised.
For those reasons, I publish a monthly report on my portfolio’s performance. I hope that this chronological history paints a clear picture of what it’s like to be a remote landlord. It’s also a great exercise for me to be sure I’m staying plugged in to all my numbers.
Here is the update for June 2022. You can also check out all my previous monthly reports.
Property Overview

As I mentioned last month, I’m in the middle of turning two properties between tenants — so both those properties were vacant this month, and did not generate rent. As I hinted last month, one of them was pretty expensive, and the other one was REALLY expensive. So let’s take a look at the details.
The Turn at Property #16
This is one of my nice/newer homes. It’s a 3 bed/2 bath built in 1997, and lies in a desirable B/B- neighborhood. I purchased it three years ago for $100K; current value is ~$170K, an example of the huge run-up in home prices we’ve seen in the Memphis market (and elsewhere) in the last three years.
The home was in relatively good condition when I bought it. However, it had a lot of carpet, which I knew I would replace with hard-surface flooring (LVP, or luxury vinyl plank, is the preferred choice) the first time I turned the property. LVP is more expensive than new carpet, but it looks better, and is much more durable.
The house also needed a full interior paint job, as well as some other miscellaneous repairs. Much of this is what I call “first turn work” — things my PM will have to do the first time, but hopefully won’t have to do in subsequent turns. This is why I always caution investors that first turns can be more expensive than you expect.
Here is the complete scope of work, with costs, if you want to examine the details. About half the cost ($4K) was flooring, which is categorized as a capital improvement, and therefore does not show up below in my monthly expenses. (I contemplate the impact of Capex at the end of the year in my Annual Reports — see 2020 and 2021.) But the remaining ~$4,600 is pure expense, contributing to the fact that this was my worst cash flow month ever.
I’m happy to have upgraded the floors, and get the rest of the house up to my PM’s standards. Here’s what the finished product looked like as it was marketed for rent:


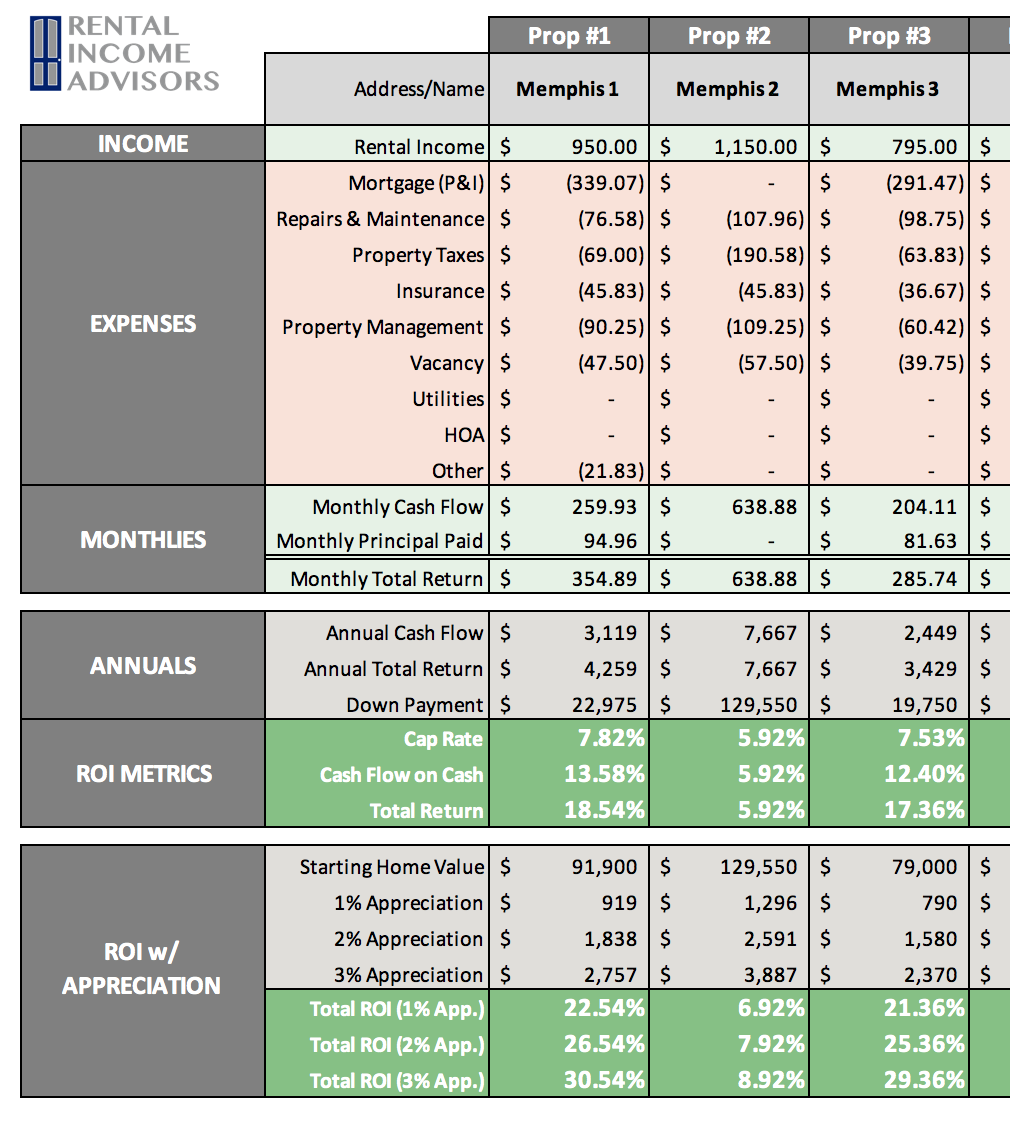
The other piece of very good news here is that I was able to re-rent the home at current market rent, which is much higher than the previous tenant was paying. In this case, the monthly rent went from $982 to $1,395, an increase of over $400/mo. and over 42%. This dramatically changes the future financial potential of the property; in fact, even with $4K of new capital invested into the property, my projected cash-on-cash returns are 18.5% — not too shabby! The new tenant moved in on August 1st.
The Turn at Property #14
This was a large and expensive turn. But the story of that turn starts three years ago when I bought the property. It’s a huge house: 4 beds, 3 baths, and over 2200 square feet, making it an outlier in my portfolio. I bought it in relatively poor condition, with a tenant who had clear hoarding tendencies. Because of the house’s size, condition, and tenant, I knew it would be a very expensive first turn — and I certainly took some risk with the tenant.
In fact, this is not a house I would likely buy today, because I’ve learned to avoid homes this large. On the other hand, I was probably getting too good a price on the house to pass up. I paid just $105K for it, with the tenant paying $1,250 at the time, so it had strong cash flow out of the gates. And I knew I could build equity in the home once I got it fixed up. Today, after the rehab I just completed, the home is worth ~$210K, or about double what I paid for it. (Of course, most of that increase is due to the overall increase in home prices during that period, not the rehab.)
Similar to the turn at Property #16, I made some capital improvements here, including over $6K in new LVP flooring. I also replaced one of the bathroom vanities, the exterior doors, and several other items, totaling ~$8K in capital expenditures.
There was another $8K in pure expense, including a full interior paint job, various repairs, and all the normal “bring to standard” work that is part of first turns. If you’re curious, you can check out the full scope of work.
This was obviously a lot of expense — but it was baked in when I bought the property, so I wasn’t surprised by it. In fact, part of me is very happy to get the work done, because it’s one more property that has been brought up to standard, eliminating some built-in liabilities that I’ve been carrying. And here’s a glimpse at what it looked like when it was done:


I benefited from a large rent increase here as well: the vacating tenant was paying $1,275, but the new tenant who moved in at the end of August is paying $1,695. That’s another ~$400 in pure profit that I’m projected to capture each month going forward.
Rents

Because of the two vacant properties, I charged less rent than usual this month. And I had a shortfall on collections due to the ongoing saga of the tenant at Property #9, who is still apparently seeking some local rental assistance to avoid an eviction due to her non-payment since last October. As I reported last month, I received 3 months of back-rent recently, so I hope the tenant is able to find some further assistance.
In addition to the rent increases related to my turns, I had one additional rent increases take effect this month:
Property #15: Raised from $1250 to $1335 on lease renewal (7% increase)
Expenses

OUCH! That’s a lot of dough. Here are the highlights with my expenses this month:
Maintenance & Repairs: As you can see, almost all of this is driven by the turn (or “rent ready”) expenses already described above.
Mortgage: This is $50 higher than last month due to an annual escrow adjustment on one of my loans. I have quite a few of these coming up, and many will be adjusted higher to cover the cost of higher property taxes in Memphis, which completed its quadrennial (every four years) re-appraisal process last year.
Utilities: This reflects several bills from the vacant properties being turned — I’m responsible for utilities when no tenant is in place.
The Bottom Line

My financial model currently projects my Memphis portfolio to generate $6,668 of positive cash flow in an average month. This month, I had a negative cash flow of (coincidentally) nearly exactly that amount, for a shortfall of over $13K. (Oof, it hurts!) This marks my first negative cash flow month (and a big one, at that) since I started detailed reports over two years ago.
Finally, here’s the running tally and graph I update each month. The dotted blue line indicates my projected average monthly cash flow for my portfolio in each given month. I obviously now have a lot of ground to make up for the year…it will be a tough hill to climb, and I wonder if I’ll ultimately have to increase my assumptions around maintenance & repairs going forward (as I suggested I might have to do in my 2021 Annual Report.) We’ll see where the numbers end up for this year…


Free Rental Property Analyzer
Need help running the numbers on rental properties? Want to be more confident in your financial projections?
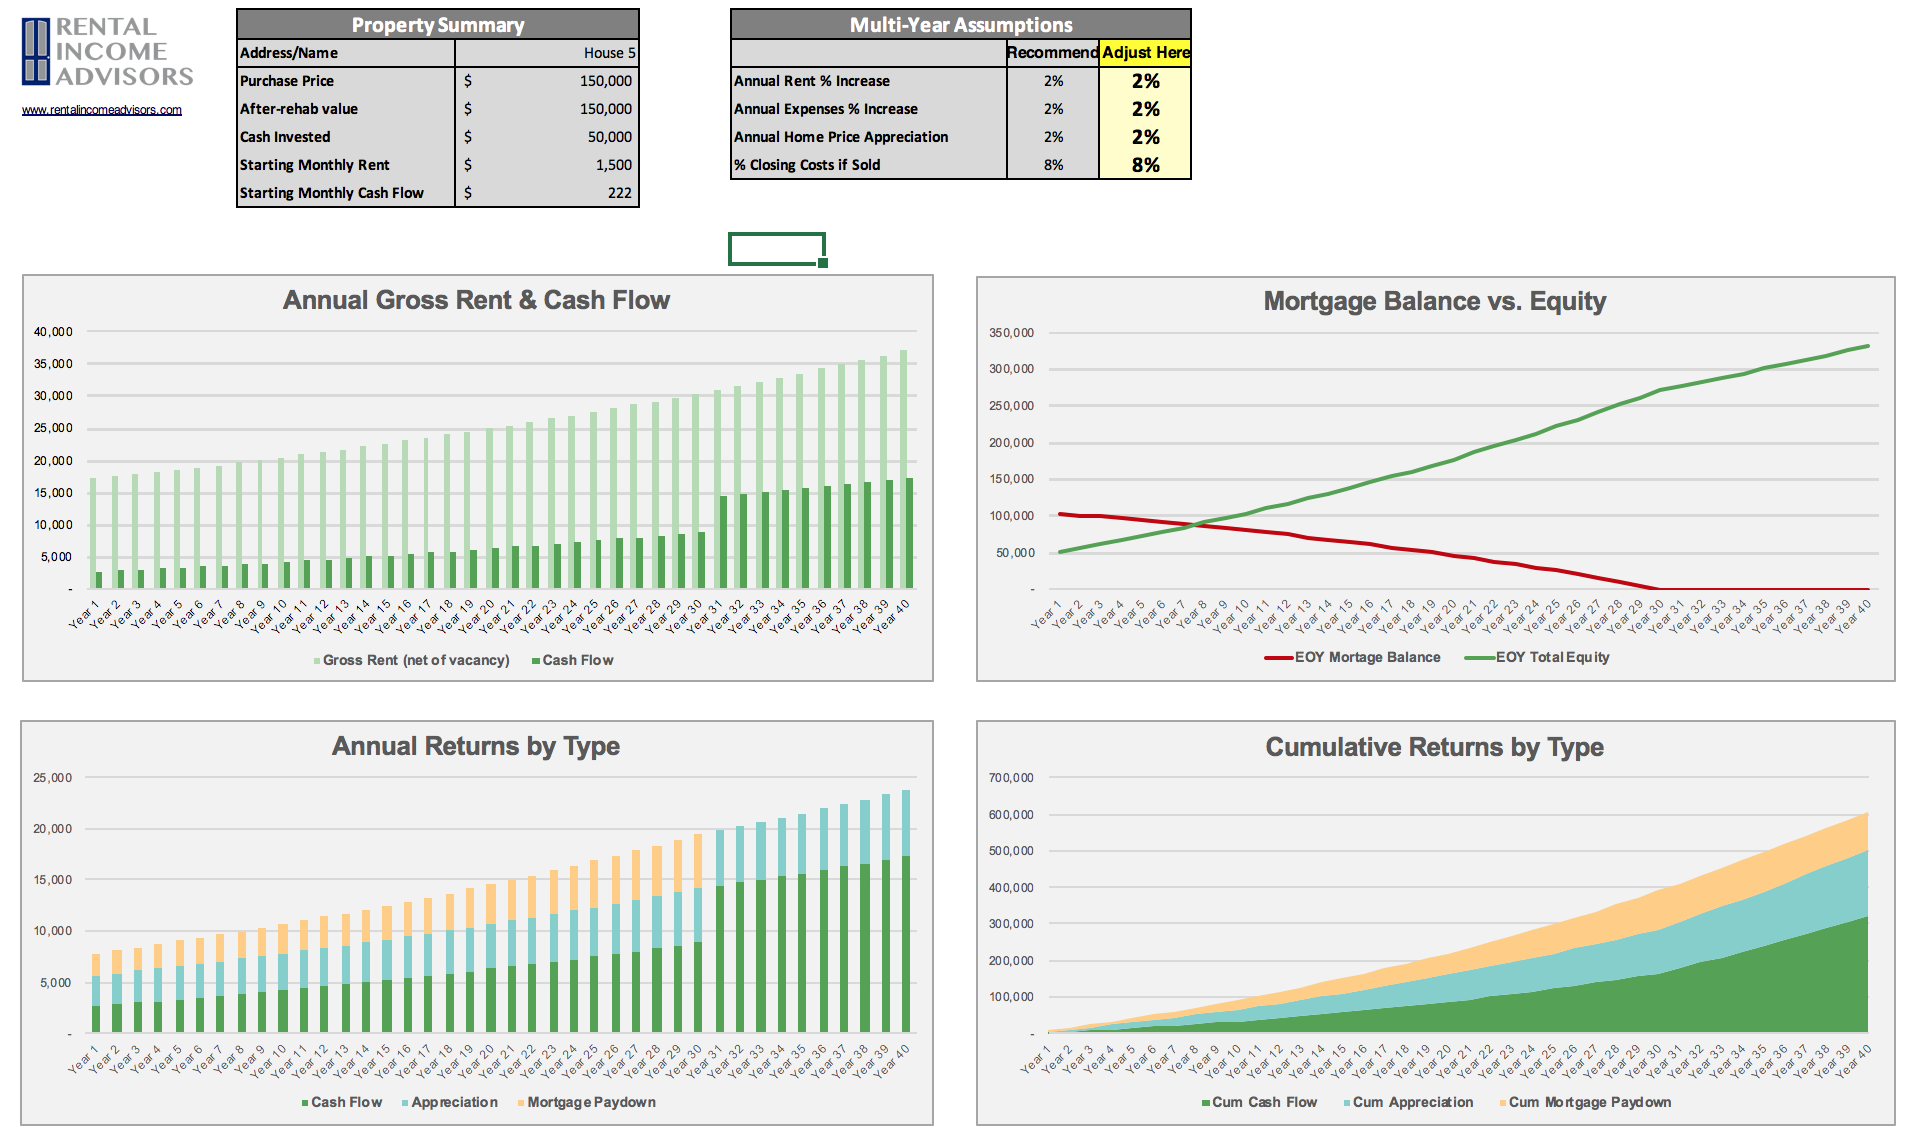
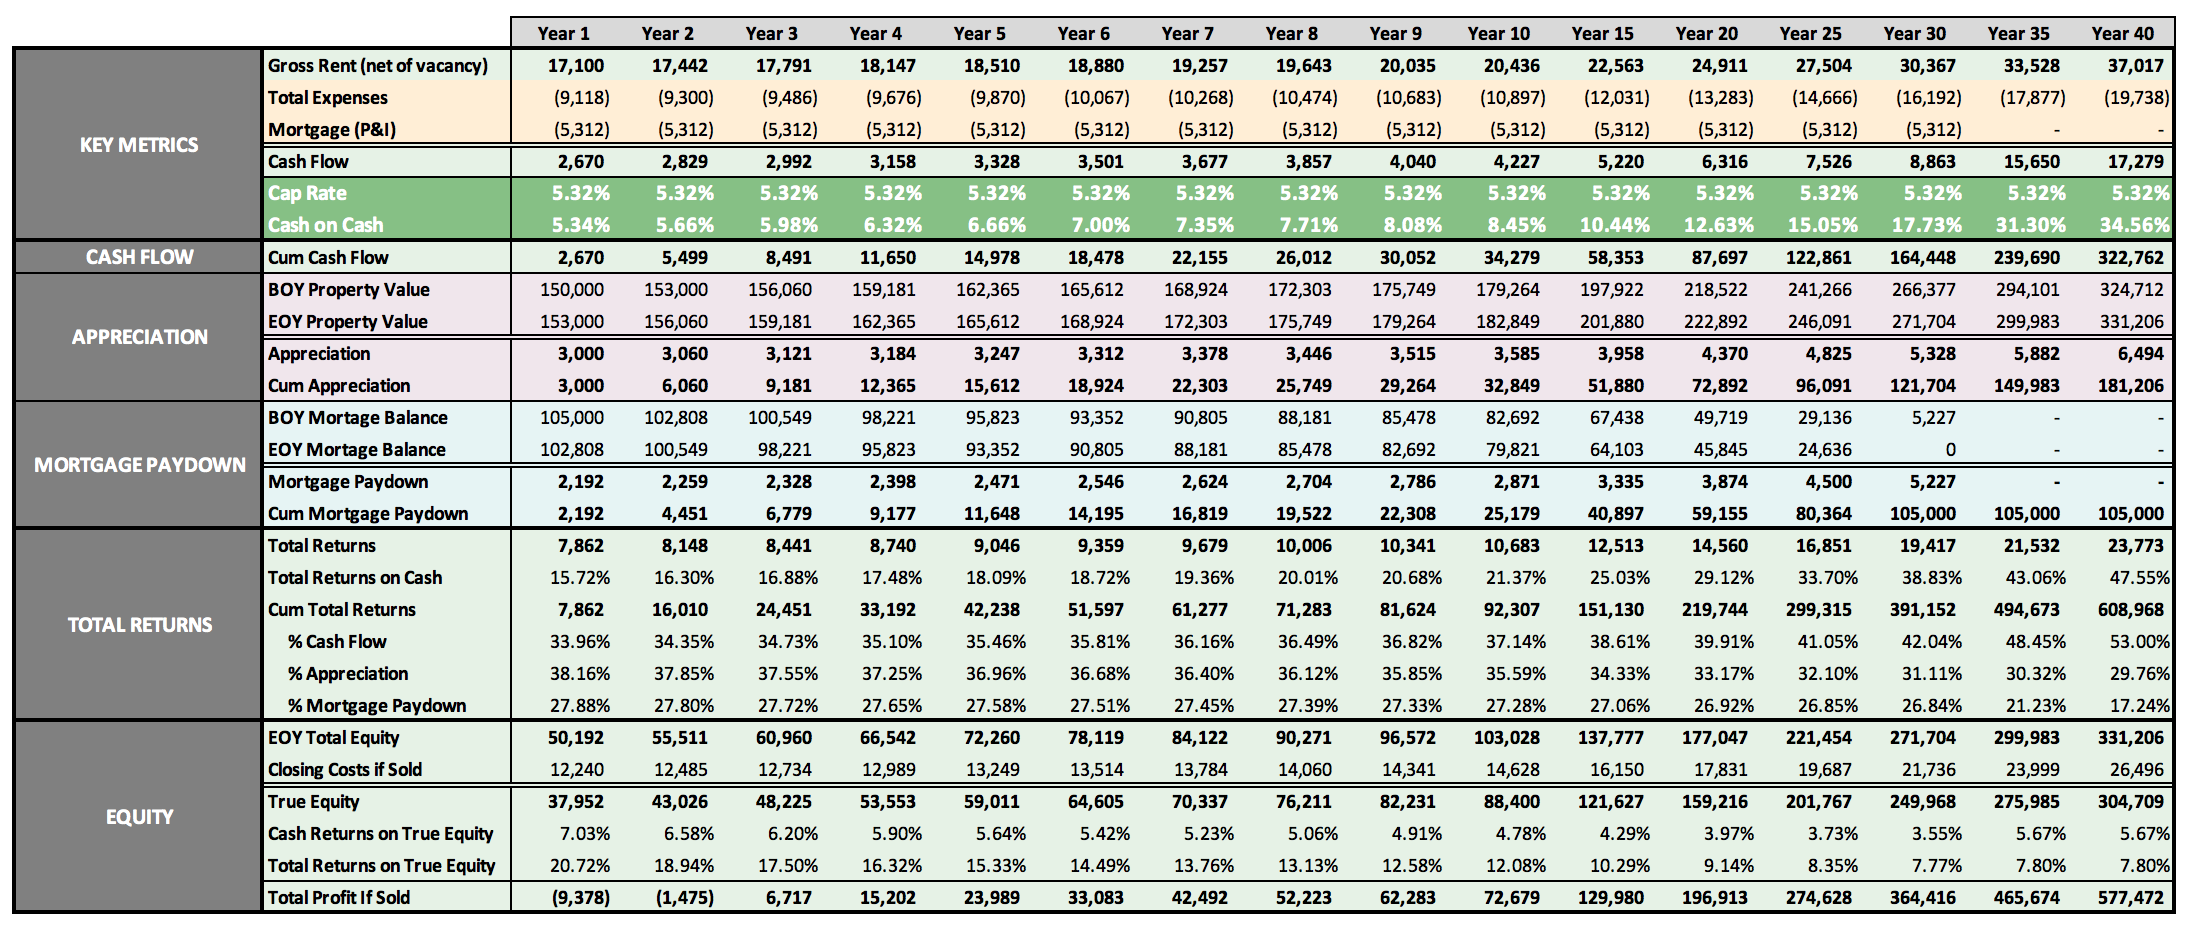
Check out the FREE RIA Property Analyzer. I guarantee this is the most intuitive, elegant, and powerful free tool you’ll find to run the financials on rental properties. I still use it every day, and so do all my coaching clients.
Here’s what the Property Analyzer looks like:
About the Author
Hi, I’m Eric! I used cash-flowing rental properties to leave my corporate career at age 39. I started Rental Income Advisors in 2020 to help other people achieve their own goals through real estate investing.
My blog focuses on learning & education for new investors, and I make numerous tools & resources available for free, including my industry-leading Rental Property Analyzer.
I also now serve as a coach to dozens of private clients starting their own journeys investing in rental properties, and have helped my clients buy millions of dollars (and counting) in real estate. To chat with me about coaching, schedule a free initial consultation.