Monthly Portfolio Report: January 2021
One of my goals with Rental Income Advisors is to be as transparent and data-driven as possible with my readers and my coaching clients. I think the best way to build confidence in a new investor is to actually show the numbers, to prove that rental property investing really does work as advertised.
For those reasons, I publish a monthly report on my portfolio’s performance. I hope that this chronological history paints a clear picture of what it’s like to be a remote landlord. It’s also a great exercise for me to be sure I’m staying plugged in to all my numbers.
Here is the update for January 2021.
Property Overview

In January, Property #13 (which had a tenant turn that I discussed in last month’s update) was half-vacant. This is because the tenant’s security deposit covered 1.5 months of rent — specifically, December and the first half of January. The good news is that a new tenant has already moved in as of the beginning of February, and is paying $200 more than the previous tenant. This was a very happy ending to a broken lease situation where the tenant left the house in poor condition.
I also had some vacancy in Property #18, a duplex I bought with one side occupied and other in need of a rehab. (I discuss all the details of that property in this article.) The rehab went well, and a new tenant moved in on January 22nd, so the unit was 70% vacant for the month. This 0.7 vacancy, plus the 0.5 vacancy from Property #13, yields the 17.8 occupancy number for the month.
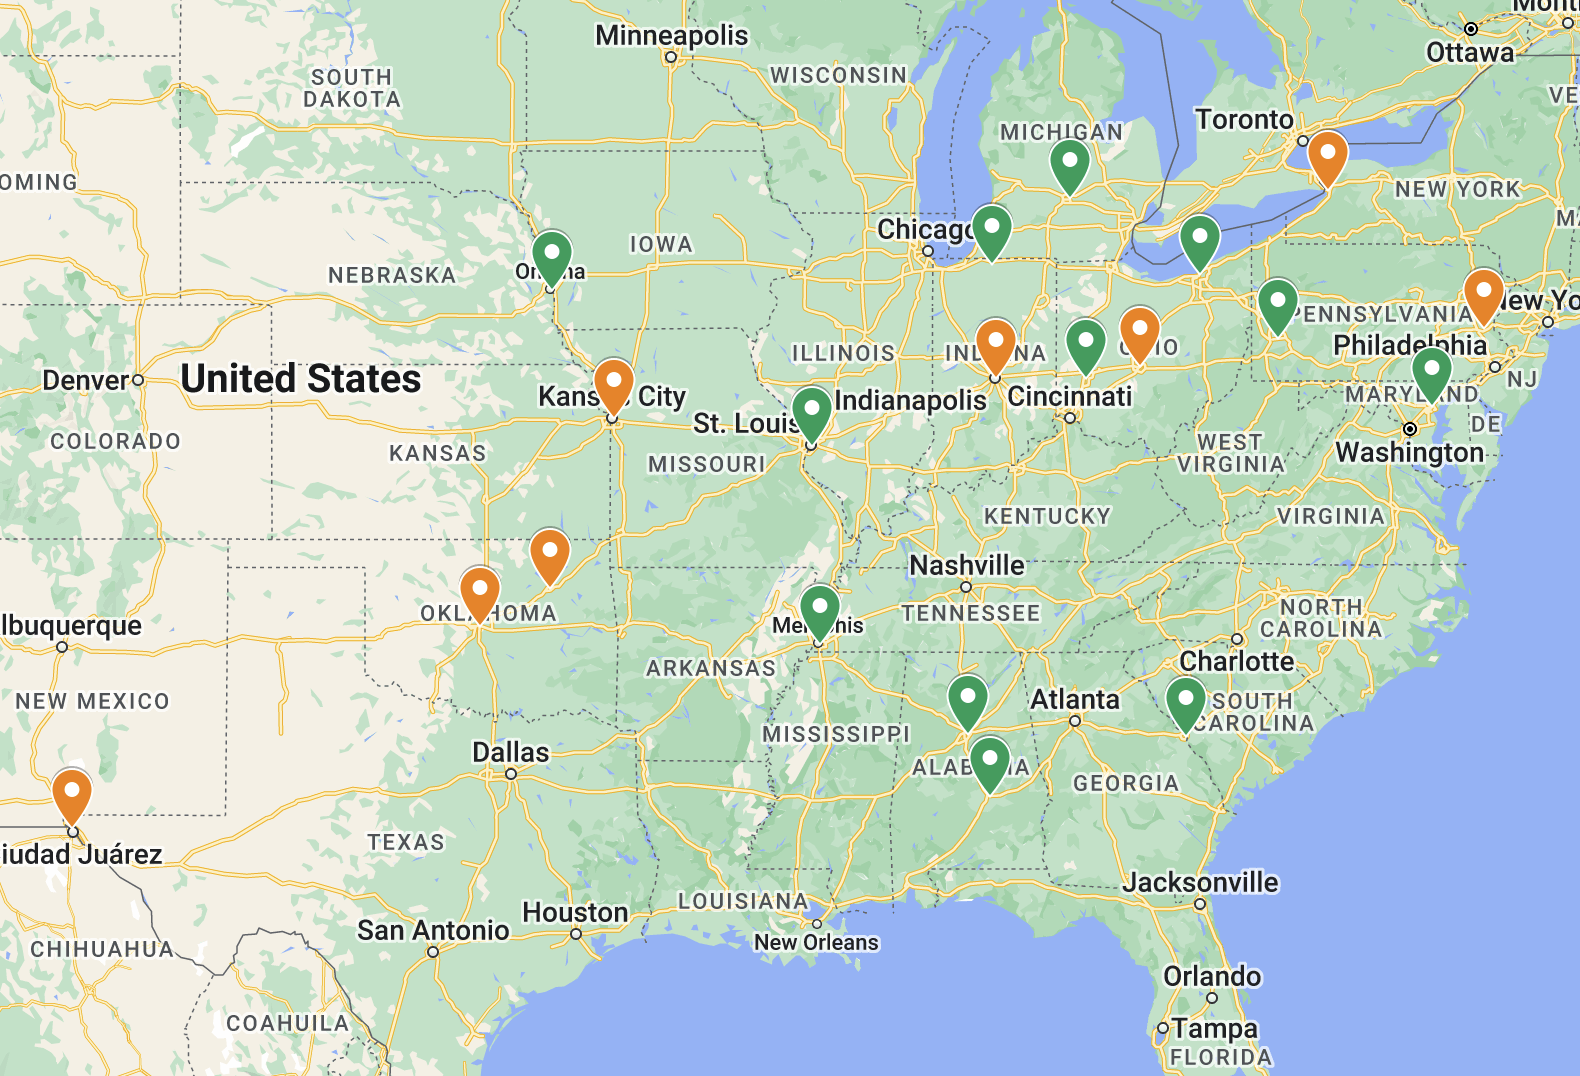
Finally, I’ve just closed on Property #19 in early February. This will be my 20th door in Memphis! This new property is represented by the blue pin on this article’s thumbnail image. Per my normal rule for new properties, I’ll begin to include its numbers in the monthly reports starting with the first full month after closing (which in this case will be March 2021’s monthly report).
Rents

Perfect collections for January. Woohoo! Collections are also looking good for February — just $700 outstanding as of mid-month.
Once I’m back to fully occupancy next month, my monthly rent roll will be nearly $20,000. I’m looking forward to hitting that milestone, along with reaching 20 doors!
Expenses

Expenses looked pretty good this month:
Property Management: This was ~$400 higher than usual due to the leasing fee for the newly rehabbed side of the duplex. Whenever a PM places a new tenant, they charge a leasing fee — in my case, this is 50% of a month’s rent. (Read more on PM functions and fees here: What Does a Property Manager Do?)
Maintenance & Repairs: The biggest expense was $500 at one property where we had to dig up a pipe in the front yard to fix a leak. There were several other expenses as well, but these were offset by $210 in tenant chargebacks that were credited to my account. (This happens when my PM charges a tenant for a small repair, which they can do in some situations under the terms of their lease; I get reimbursed once the tenant makes the payment.)
Utilities: Whenever a property is vacant, the landlord must pay the utility bill. I had two vacant units in January where I was responsible for the utiltiies.
The Bottom Line
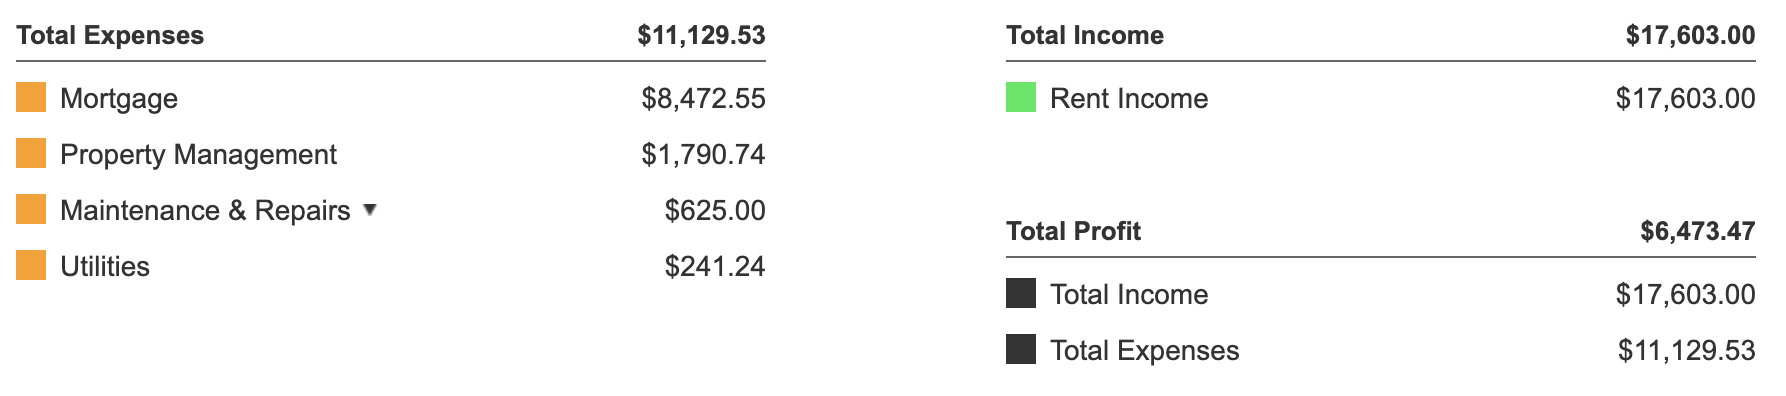
With the addition of both sides of the duplex at Property #18, my financial model projects my Memphis portfolio to generate $5,809 of positive cash flow in an average month. In January, the positive cash flow was $6,473, slightly above that projected average. Though I had some vacancy this month, this was more than offset by my lower-than-budgeted maintenance costs.
Finally, here’s the running tally and graph I update each month. You can see that this month, I climbed back above my projected average monthly cash flow, as indicated by the dotted blue line. Hopefully I can stay on that side of the line in the months to come!
You can also see how much my expected monthly cash flow has increased recently — it’s now almost $6K/month. This is mostly due to the addition of Property #17 and especially Property #18 to the portfolio, as well as the $200 rent increase at Property #13.

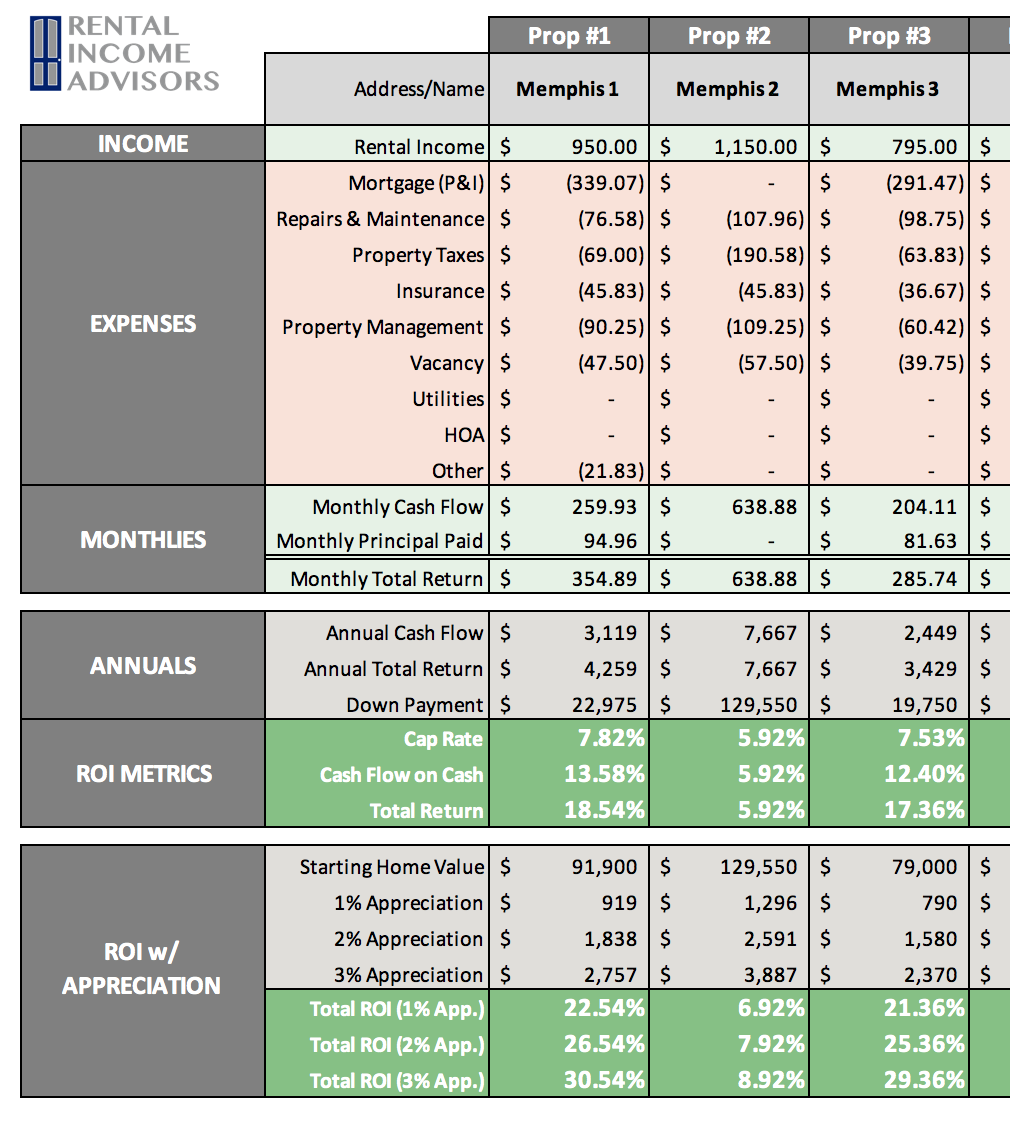
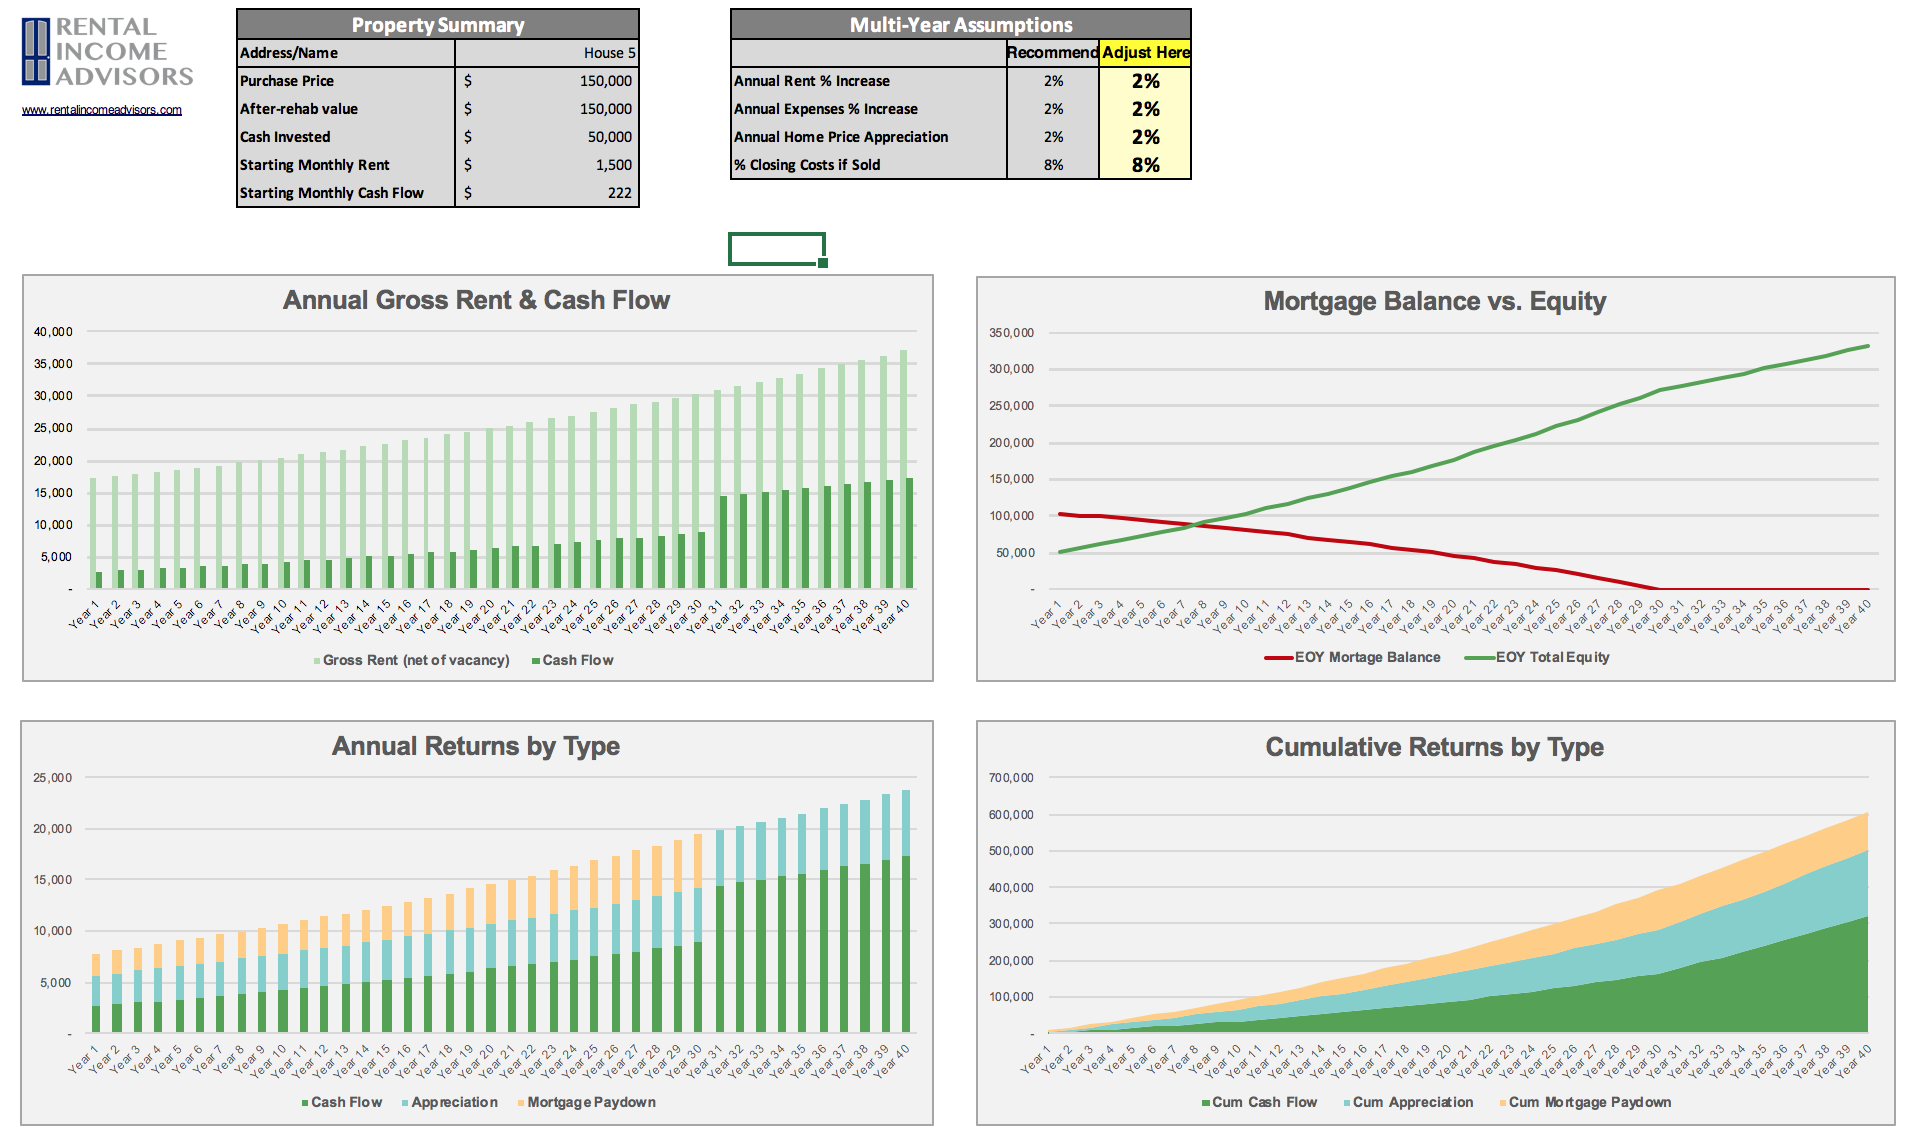
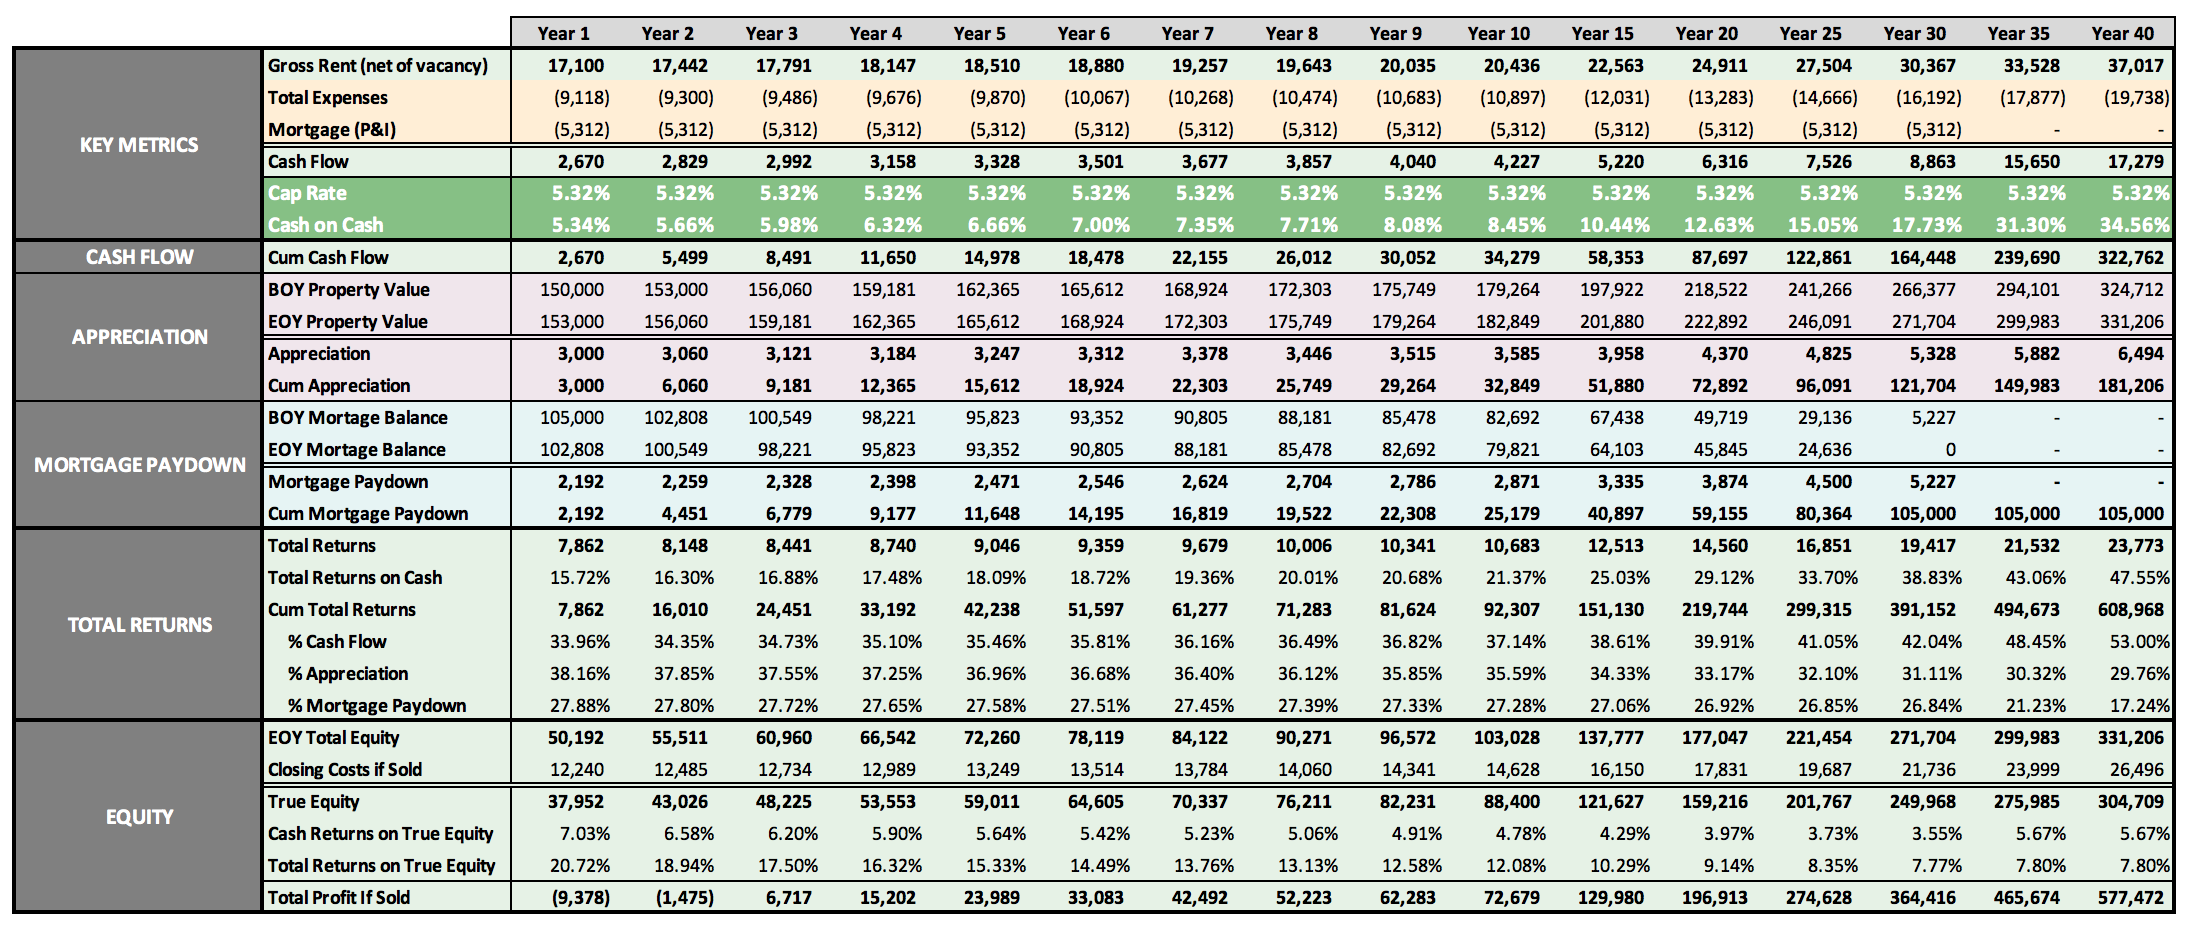
Free RIA Property Analyzer
Need help running the numbers on rental properties? Check out the FREE RIA Property Analyzer. I guarantee this is the most intuitive, elegant, and powerful free tool you’ll find to run the financials on rental properties.
Here’s what the Property Analyzer looks like:
About the Author
Hi, I’m Eric! I used cash-flowing rental properties to leave my corporate career at age 39. I started Rental Income Advisors in 2020 to help other people achieve their own goals through real estate investing.
My blog focuses on learning & education for new investors, and I make numerous tools & resources available for free, including my industry-leading Rental Property Analyzer.
I also now serve as a coach to dozens of private clients starting their own journeys investing in rental properties, and have helped my clients buy millions of dollars (and counting) in real estate. To chat with me about coaching, schedule a free initial consultation.