Monthly Portfolio Report: June 2021
One of my goals with Rental Income Advisors is to be as transparent and data-driven as possible with my readers and my coaching clients. I think the best way to build confidence in a new investor is to actually show the numbers, to prove that rental property investing really does work as advertised.
For those reasons, I publish a monthly report on my portfolio’s performance. I hope that this chronological history paints a clear picture of what it’s like to be a remote landlord. It’s also a great exercise for me to be sure I’m staying plugged in to all my numbers.
Here is the update for June 2021. You can also check out all my previous monthly reports.
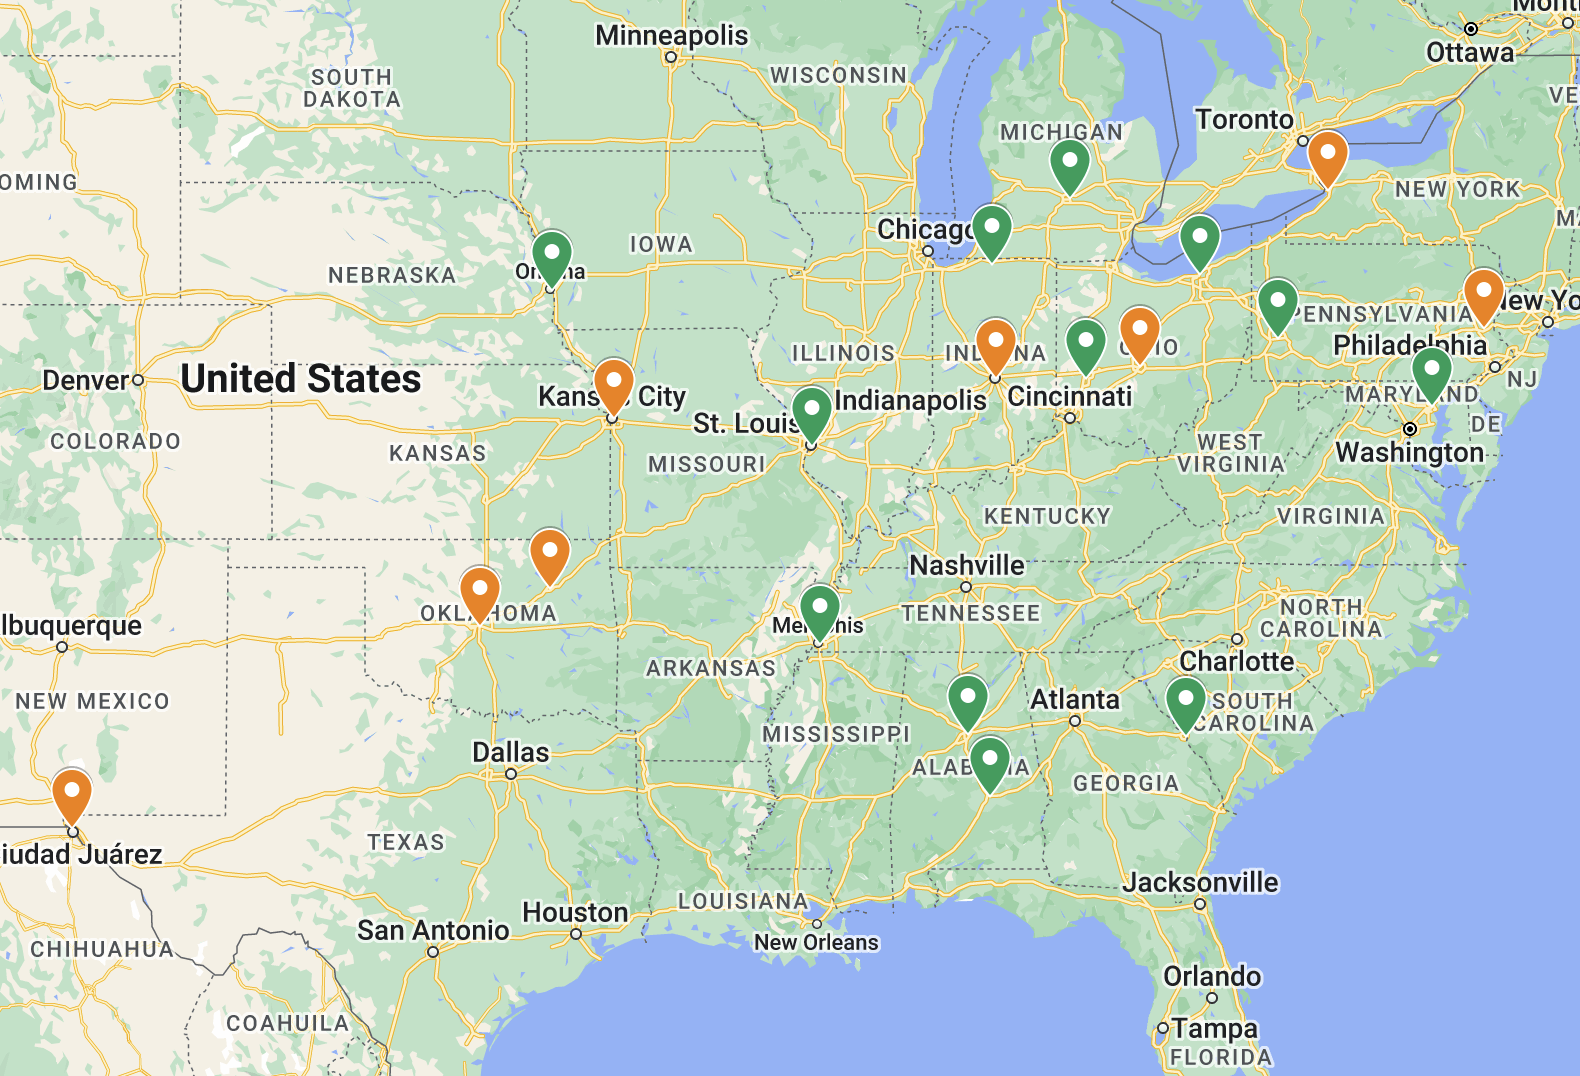
Property Overview

I remained fully occupied this month, with the caveat that June was the last month before I took possession of Property #2, where the tenant was being evicted. For the purposes of these monthly updates, I count that situation as occupied, but with rent uncollected. (By the time I get to tabulating end of year numbers, any month without rent collected counts toward my vacancy rate.)
The house was “officially” vacant in July while it was being turned, and as of mid-August it will occupied with a new tenant. Overall, it was 5+ months from the time the tenant stopped paying rent until the new tenant moved in. Evictions are no fun! But they’re part of the financial model I use to project my returns, so it’s just another part of the business. I’m grateful I have a good property manager to deal with the legal stuff, though!
The one silver lining is that because rents have been rising of late, I was able to place the new tenant at a rate of $825/month, compared to $695/month that the previous tenant was paying. That makes a big difference to the profitability of this house going forward.
Rents

Other than the tenant at Property #2 discussed above, all tenants were fully paid for June.
I do have a tenant at Property #6 who has fallen into a pattern of paying around the 20th of the month, and even had their first payment last month returned for insufficient funds. I’m a bit worried about this tenant, but hopefully they’ll be able to get back on track.
Expenses

A few things require explanation this month:
Mortgage: Banks are regularly re-evaluating escrow payments to be sure they are appropriate to cover insurance and property tax payments. That is why my total mortgage amount may fluctuate from month to month — this is a bit higher than last month, for example, and more changes will take effect in the next few months. But these escrow adjustments do not change the underlying financials of the properties, just how much the bank is “withholding” to cover those fixed costs.
Maintenance & Repairs: A bit higher than average this month — I currently budget ~$1,500 per month — with most of the expenses coming from plumbing and HVAC visits (very typical in the summer). But about $400 of this I’m still hoping to get back from my property manager, based on the mishandled HVAC situation at Property #7 that I mentioned in last month’s update.
Tenant Chargeback: As I mentioned last month, I added a new category in my accounting for Tenant Chargeback. This represents amounts that my PM charges back to my tenant’s accounts, which can happen if the tenant is a no-show for a technician appointment, or if the issue was something the tenant is responsible for (i.e. keeping drains clear). I am charged for these upfront, but once the tenant pays the amount, I’m reimbursed. This month, I received $215 of reimbursement for such issues.
The Bottom Line

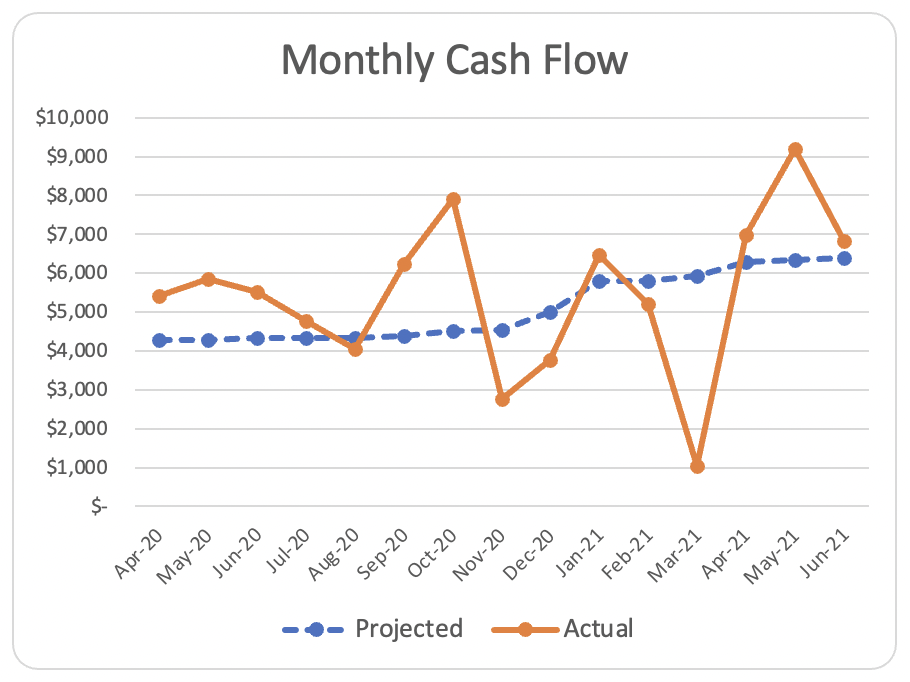
My financial model currently projects my Memphis portfolio to generate $6,394 of positive cash flow in an average month. In June, the positive cash flow was $6,830, just slightly better than that projected average.
Despite one non-paying tenant and slightly elevated M&R expenses, I still exceeded the target due to fully occupancy/collections otherwise, and the lack of any one-time expenses that I pay directly on my un-mortgages properties, such as property taxes and insurance.
Finally, here’s the running tally and graph I update each month. The dotted blue line indicates my projected average monthly cash flow for my portfolio in each given month. It’s been a bit of a bumpy ride this year, but I’m about level with my total projected cash flow year-to-date.
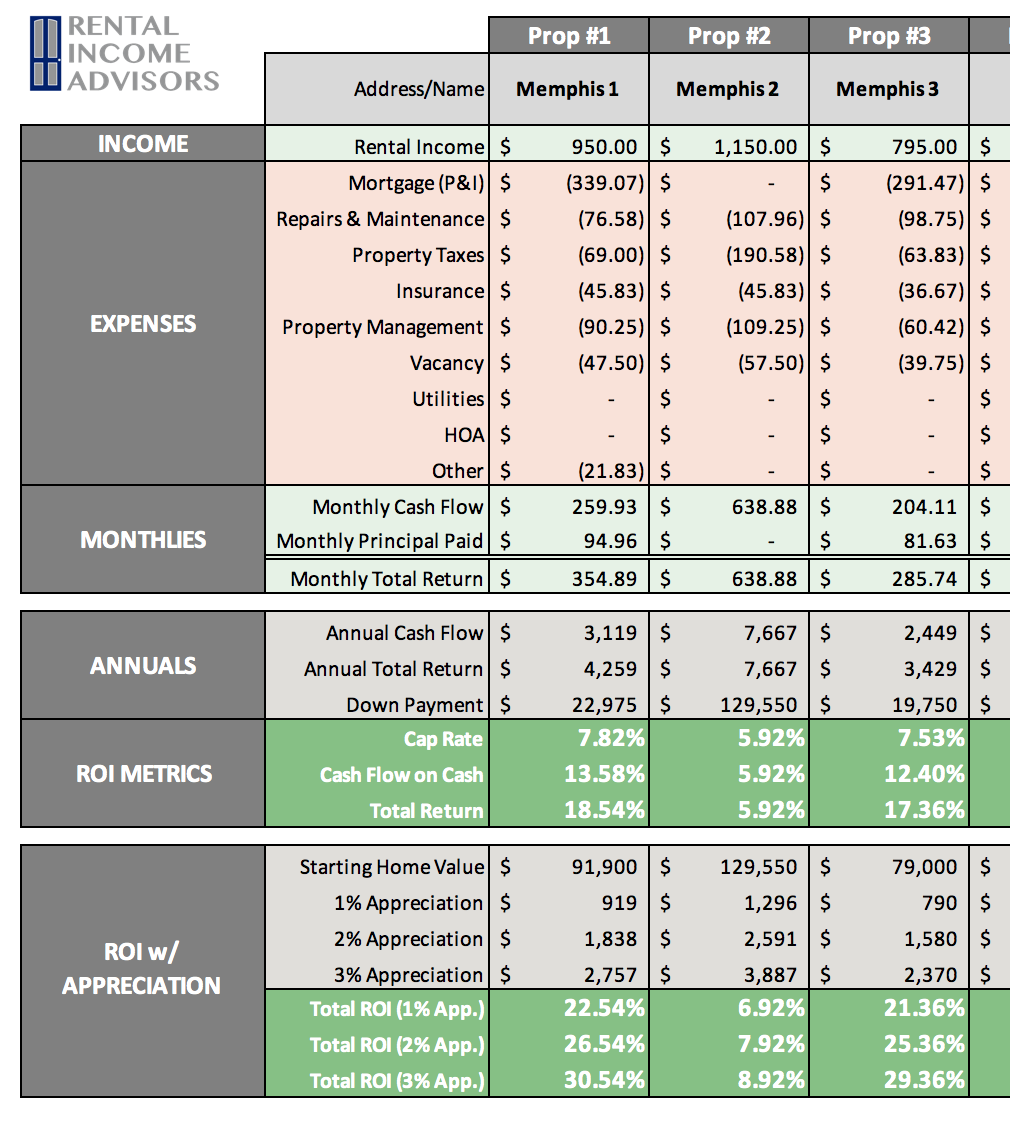
Free Rental Property Analyzer
Need help running the numbers on rental properties? Want to be more confident in your financial projections?
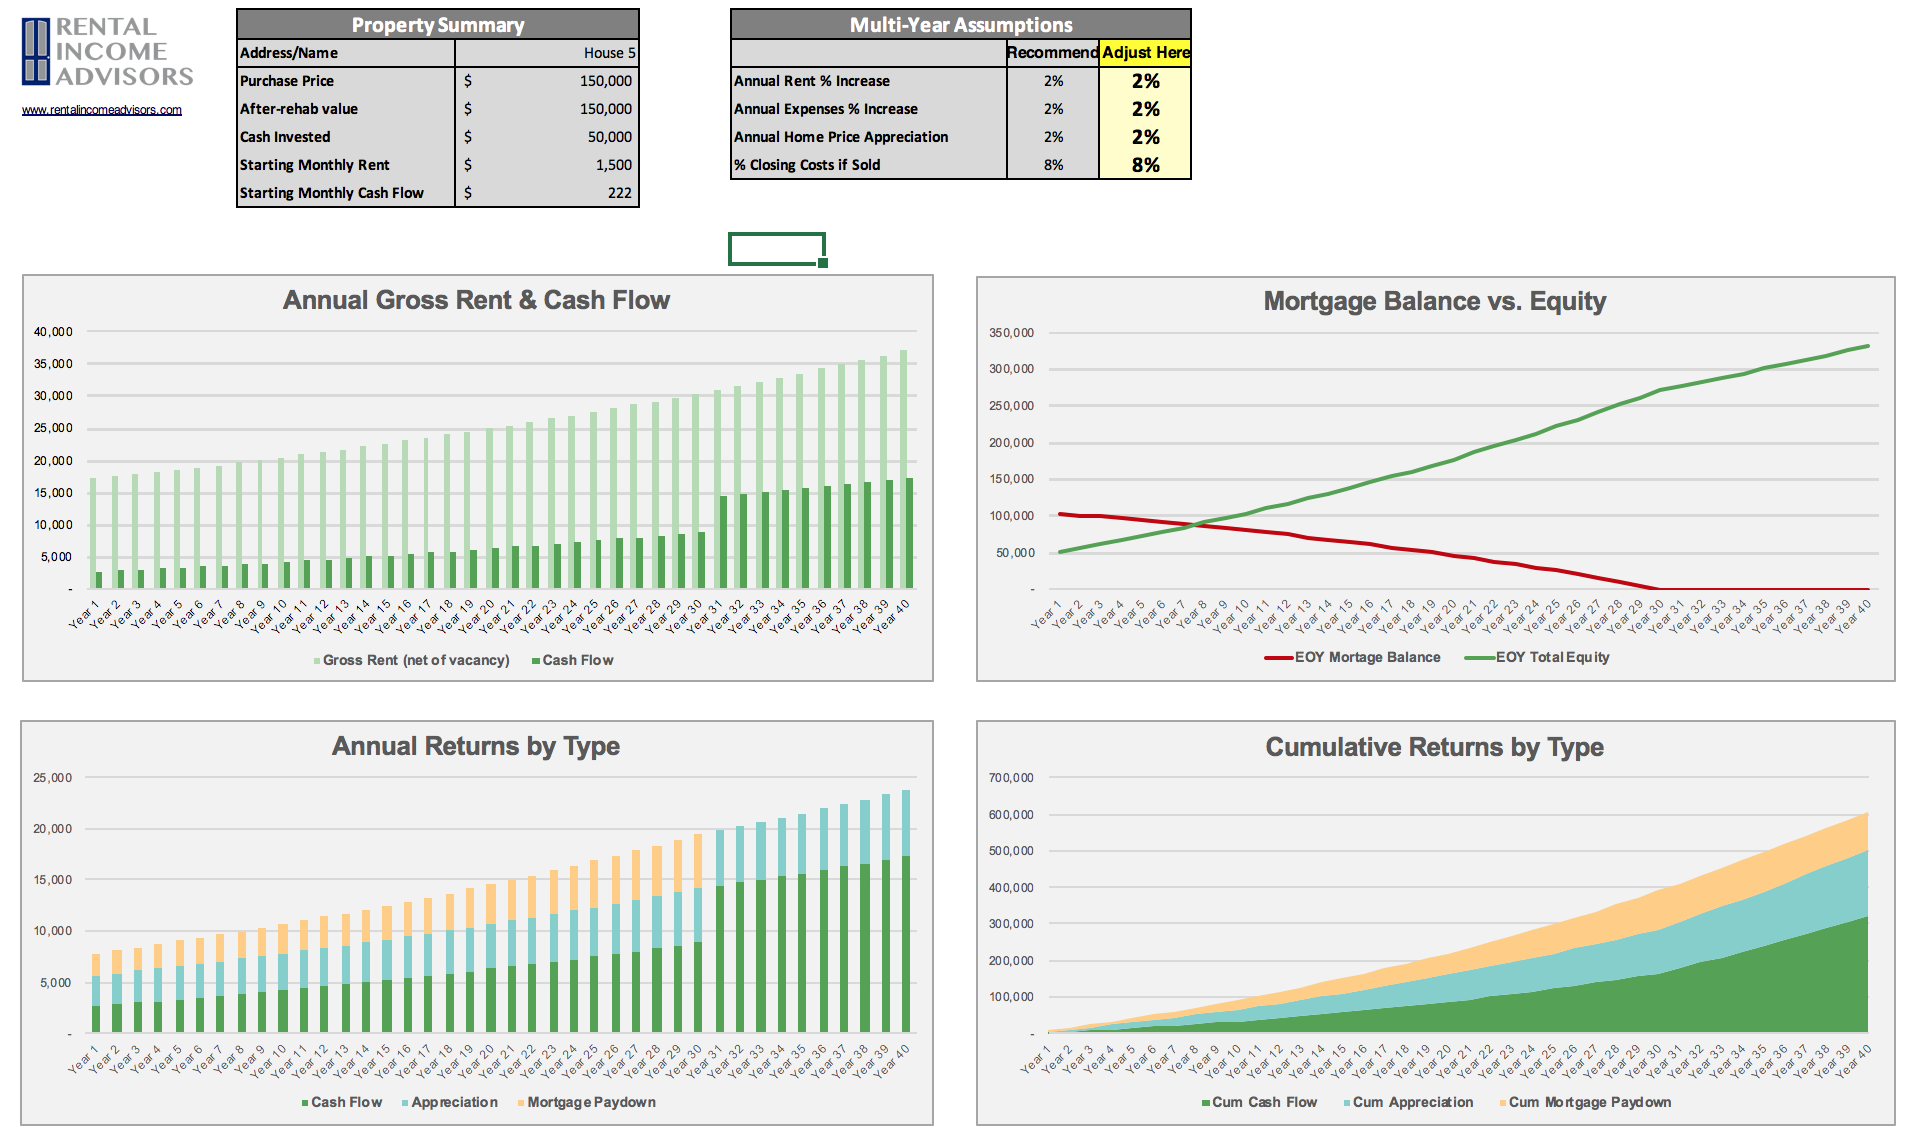
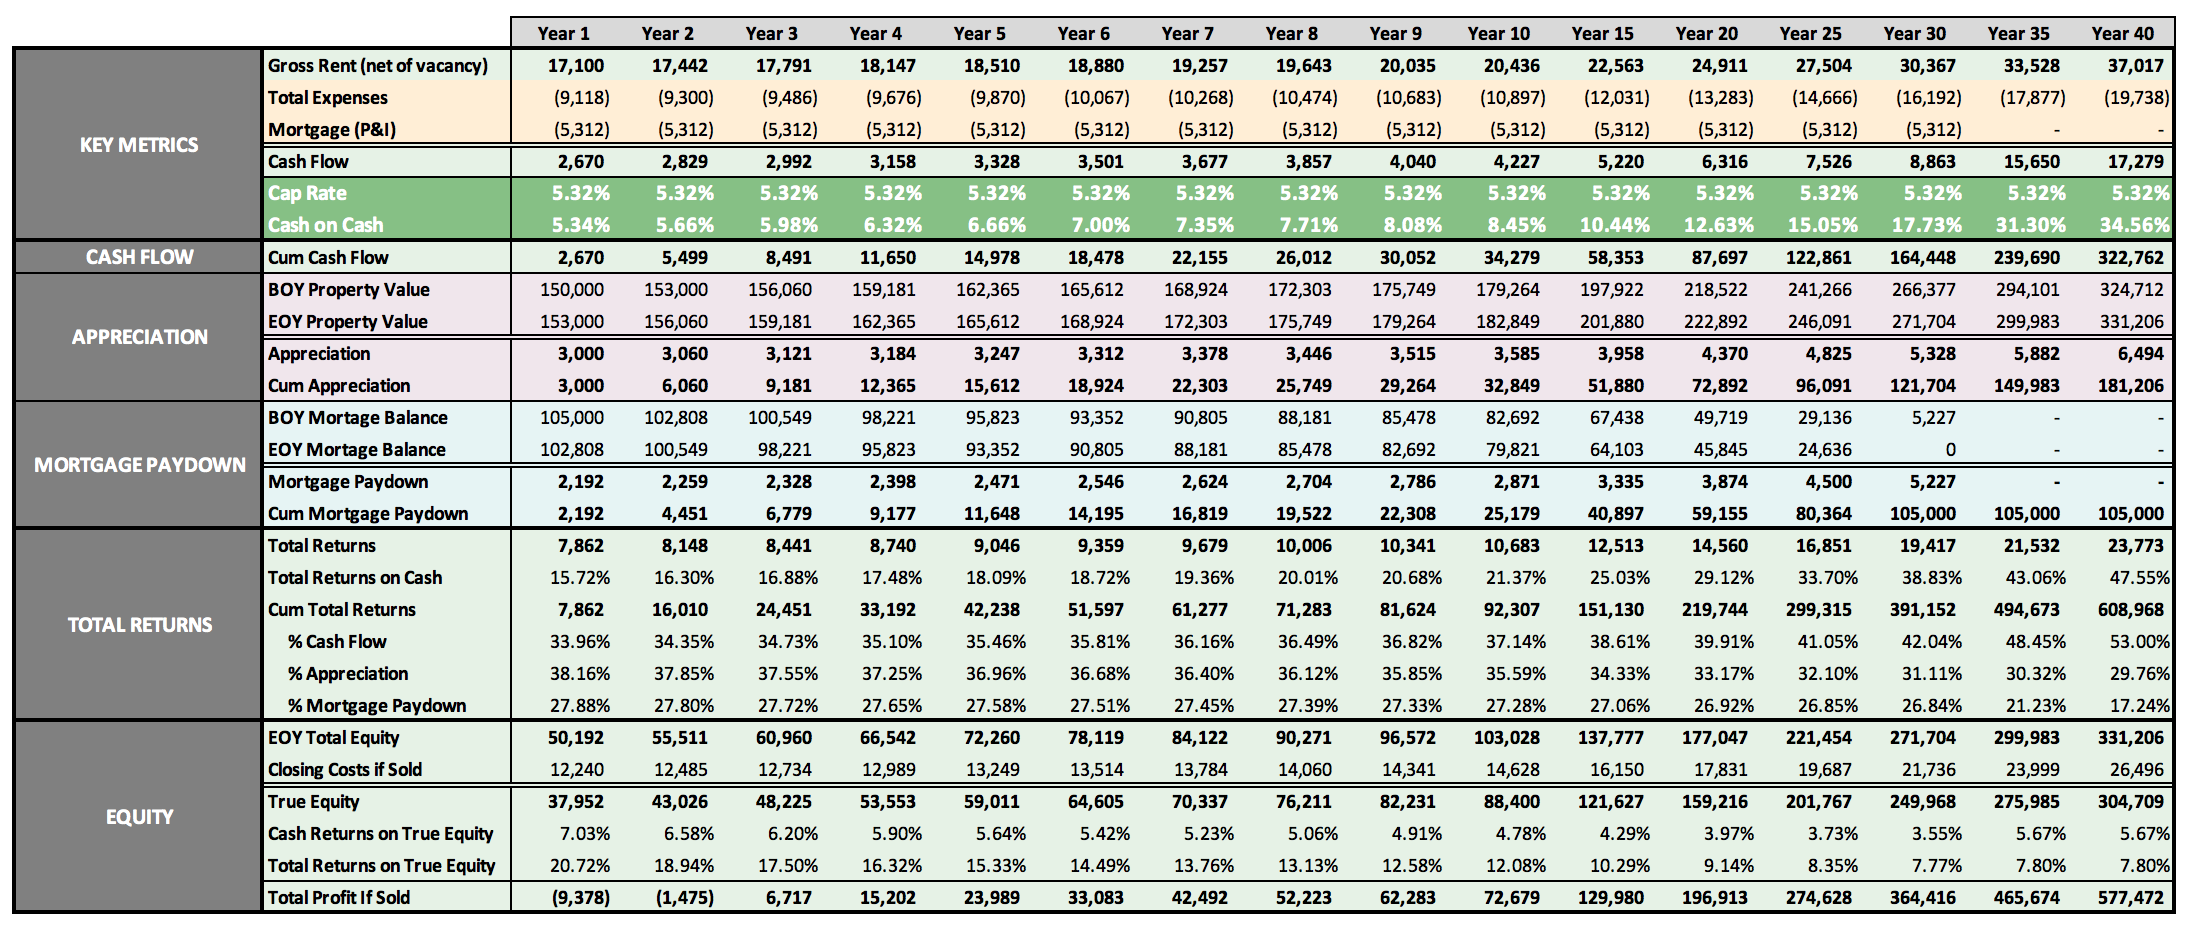
Check out the FREE RIA Property Analyzer. I guarantee this is the most intuitive, elegant, and powerful free tool you’ll find to run the financials on rental properties. I still use it every day, and so do all my coaching clients.
Here’s what the Property Analyzer looks like:
About the Author
Hi, I’m Eric! I used cash-flowing rental properties to leave my corporate career at age 39. I started Rental Income Advisors in 2020 to help other people achieve their own goals through real estate investing.
My blog focuses on learning & education for new investors, and I make numerous tools & resources available for free, including my industry-leading Rental Property Analyzer.
I also now serve as a coach to dozens of private clients starting their own journeys investing in rental properties, and have helped my clients buy millions of dollars (and counting) in real estate. To chat with me about coaching, schedule a free initial consultation.